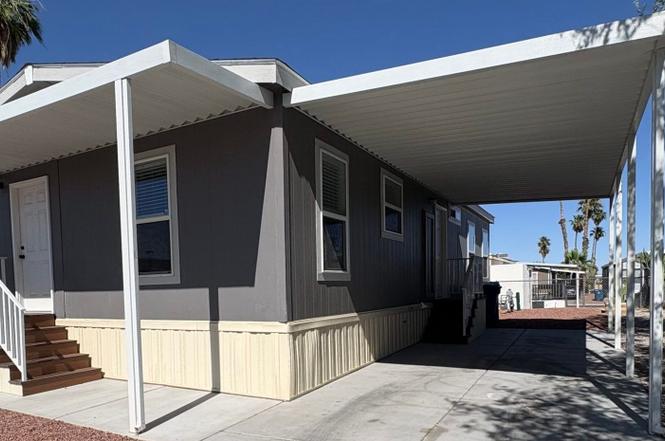
3751 S Nellis Blvd #295 · Paradise, NV
Flood risk No data
- FEMA flood zone
- —
- Chance of flooding over 30 yrs
- —
- Est. flood insurance / yr
- —
Fire risk No data
- Est. fire insurance / yr
- —
Heat risk 8/10 · Major
- Hot days now (above threshold)
- 7 days/yr
- Hot days in 30 yrs
- 17 days/yr
Wind risk No data
- Chance of severe wind over 30 yrs
- —
Air-quality risk 3/10 · Minor
- Unhealthy air days now
- 3 days/yr
- Unhealthy air days in 30 yrs
- 4 days/yr
Risk factors via First Street. Map © Google.
Why this score? — see what drove the B- grade
The composite is a weighted blend of 9 inputs, each scored 0–100. Each bar is that input's sub-score; the figure is the points it added to the 100-point composite (weight × sub-score).
- Cash flow +30.0/30.0
- 1% rule +10.0/10.0
- DSCR +10.0/10.0
- ARV discount +7.5/15.0
- Livability +3.8/5.0
- Schools +2.6/10.0
- Rent growth +2.5/5.0
- Condition / age +2.5/5.0
- Appreciation +0.0/10.0
$95,900
🖨 Deal sheet 📄 Offer letter ✓ Due diligence
Listing remarks
Amazing Value!! Don't Miss Out!!
Key facts
- Built 2025
- Listed 62 days
Property features AI
Finance
- Financial info: List price $95,900
Exterior
- Home design: Spec home, Prescott floor plan
- Exterior features: Located at 3751 S Nellis Blvd #295, Las Vegas, NV 89121
Interior
- Bedrooms: 3 bedrooms
- Bathrooms: 2 full bathrooms
- Interior features: Living area approximately 1,232
Neighborhood map
What this means for you Summary
Snapshot
- This is a 3-bed/2.0-bath manufactured listed at $96k.
Deal economics
- At list price, monthly cash flow is $543 ($7k/yr) — positive.
- The deal already cash-flows at list — no discount required.
- Meets the 1% rule at list price ($2k rent vs $96k).
- Recommended offer: $90k (6.0% below list) — sets the bar for market timing.
Location & tenants
- Location reads 76/100 on livability (#10 in NV, #3,494 nationally) — a middle-class / working-renter tenant base. Strengths: commute A+, housing A-, cost of living B; Watch: employment D+, schools F, crime D-.
- Clark County School District (urban): math 21% / reading 39% proficiency, ranked #11 of 17 in NV (top 65%) — families likely to look elsewhere, expect single-tenant / working-renter base with shorter leases.
- Market conditions: Rents soft (-0.1%/yr); 405 active listings in the ZIP; 40 comparable units currently listed for rent nearby; rentals at typical pace (median 18d on market — plan ~3-4 weeks tenant-placement turnaround); 14,754 units permitted in Clark County in 2024 (2,301 in 5+ unit buildings).
- This rent runs 33% of the median local income ($56k/yr) — at the standard rent-burdened threshold; future hikes will face affordability resistance.
Forward outlook
- Local home prices are declining (-3.0%/yr); year-one equity from $663 of loan paydown is wiped out by about $3k of value loss. Plan a longer hold.
- Clark County population projected at +36% by 2050 — long-run rental-demand tailwind backs the buy-and-hold thesis.
- At projected returns (-3.0% appreciation + 0.0% rent growth), your $27k cash investment doubles in ~6 years — after that, you're playing with house money.
Negotiation context
- It's been on market 62 days — a 6% lower offer ($90k) is reasonable based on typical stale-listing flexibility.
Risks & watch-outs
- Climate carrying-cost: extreme-heat days projected 7→17/yr by 2055 (HVAC capex compounding) — expect insurance premiums to compound above CPI over the hold.
Questions for the listing agent
- It's been on market 62 days. Have you received any prior offers? Is the seller open to a 6% concession, seller financing, or rate buy-down credit?
- Why hasn't it sold? Are there any deal-killer items the seller is aware of (foundation, flood, title, zoning, code violations)?
- Is there a deadline driving the sale (1031 exchange, divorce, estate, relocation)? That informs how much negotiation room exists.
- Schools are F-rated, which usually means shorter tenancies and higher turnover. Who's the typical renter profile here, and what's been the actual vacancy rate?
- Crime grade is D in this area — have there been break-ins, vandalism, or insurance claims at this property in the last 3 years? What carrier currently insures it and at what premium?
- What's the average days-on-market for RENTAL listings here right now (not sales)? A rising rental-DOM trend means longer vacancies and softer asking-rent achievability than the comps imply.
- What's the recent tenant-quality profile in this submarket — average credit score on applications, eviction rate, late-payment / NSF rate, and stable-employment percentage? A property-management company in the area should have these aggregated.
- How much new for-sale + rental construction is in the pipeline within 1–3 miles? Heavy new supply typically softens prices + rents 12–24 months out; constrained supply supports both.
Investment metrics
- 1% rule
- 1.59% ✓
- Cap rate
- 13.08%
- Cash-on-cash
- 24.24%
- DSCR
- 2.08
- GRM
- 5.2
CMA / ARV
No comps found within radius.
Projected returns pro-forma
-3.0% appreciation · 0.0% rent growth · sell at horizon
- IRR
- 14.1%
- Equity multiple
- 1.54×
- Total profit
- $14,565
- Equity at exit
- $14,299
- IRR
- 20.5%
- Equity multiple
- 2.49×
- Total profit
- $39,990
- Equity at exit
- $8,292
Cash invested: $26,852 (down + closing). Projections, not guarantees.
Landlord ↔ Tenant lean methodology
- Overall (STATE)
- 71 Landlord-Friendly
- State Nevada
- 71 Landlord-Friendly · R+1
- County
- — inherits STATE
- City
- — inherits STATE
ZIP-level market 89121
- Rents YoY
- -0.1%
- Active inventory
- 405
- Price-to-rent
- 5.2×
Monthly cashflow live
- Estimated rent
- $1,526 high interval (Pro) →
- Mortgage (P&I)
- −$503
- Tax est. 1.5%
- −$120 /mo · $1,438/yr
- Insurance
- −$40
- HOA
- −$0
- Vacancy / Maint / Mgmt
- −$320
- Net cashflow
- $543
Break-even live
UW: 25.0% down · 7.5% · 30yr · 1.5% tax · 5.0% vac · 8.0% maint · 8.0% mgmt
Financing live
Cash to close
- Down payment
- $23,975
- Closing costs
- $2,877
- Reserves months
- —
- Total cash needed
- —
Loan-product check · same deal, 3 products live
Conventional
25% down · 7.5% · 30yr
- Down + closing
- —
- Monthly P&I
- —
- Monthly cashflow
- —
- DSCR
- —
- Eligible?
- —
Personal DTI + credit; lowest rate.
DSCR
20% down · 8.5% · 30yr
- Down + closing
- —
- Monthly P&I
- —
- Monthly cashflow
- —
- DSCR
- —
- Eligible?
- —
No personal income docs; deal must DSCR.
Hard money
10% down · 12.0% · 12mo
- Down + closing
- —
- Monthly P&I
- —
- Monthly cashflow
- —
- DSCR
- —
- Eligible?
- —
Short-term bridge; refi at stabilization.
Rent comps 40 comps
| Address | Beds | Baths | Sqft | Rent | $/sqft | DOM | Units | Dist |
|---|---|---|---|---|---|---|---|---|
| 3800 S Nellis Blvd Las Vegas, NV | 1.0–3.0 | 1.0–2.0 | 943 | $1,620 | $1.72 | 2d | 16 | 0.26mi |
| 5051 Sitka Ln Las Vegas, NV | 3.0 | 2.0 | 1265 | $1,225 | $0.97 | 44d | 1 | 0.34mi |
| 3850 Mountain Vista St Las Vegas, NV | 1.0–3.0 | 1.0–2.0 | 802 | $1,406 | $1.75 | 15d | 9 | 0.37mi |
| 5101 E Twain Ave Las Vegas, NV | 1.0–2.0 | 1.0–2.0 | 780 | $1,150 | $1.47 | 44d | 4 | 0.37mi |
| 4455 E Twain Ave Las Vegas, NV | 1.0–3.0 | 1.0–2.0 | 871 | $1,352 | $1.55 | 4d | 9 | 0.49mi |
| 3481 Cape Cod Dr Las Vegas, NV | 2.0 | 2.0 | 840 | $1,300 | $1.55 | 3d | 1 | 0.54mi |
| 3956 Clear View Dr Las Vegas, NV | 3.0 | 2.0 | 1306 | $2,600 | $1.99 | 18d | 1 | 0.55mi |
| 4014 Great Plains Way Las Vegas, NV | 2.0 | 1.5 | 1152 | $1,548 | $1.34 | 4d | 1 | 0.70mi |
| 4264 White Sands Ave Las Vegas, NV | 4.0 | 2.0 | 1392 | $1,650 | $1.19 | 11d | 1 | 0.77mi |
| 4952 E Harmon Ave Las Vegas, NV | 2.0 | 1.0 | 800 | $1,900 | $2.38 | 23d | 1 | 0.79mi |
| 3400 Cabana Dr Las Vegas, NV | 2.0–3.0 | 2.0 | 1124 | $1,350 | $1.20 | 22d | 2 | 1.02mi |
| 3400 Cabana Dr #2019 Las Vegas, NV | 2.0 | 2.0 | 1053 | $1,350 | $1.28 | 15d | 1 | 1.02mi |
| 5421 E Harmon Ave Las Vegas, NV | 1.0–2.0 | 1.0–2.0 | 523 | $1,195 | $2.28 | 2d | 17 | 1.02mi |
| 3055 S Nellis Blvd Las Vegas, NV | 1.0–2.0 | 1.0–2.0 | 983 | $1,432 | $1.46 | 2d | 41 | 1.07mi |
| 3037 Aloha Ave Las Vegas, NV | 3.0 | 2.0 | 1270 | $1,800 | $1.42 | 4d | 1 | 1.07mi |
| 3021 Aloha Ave Las Vegas, NV | 3.0 | 2.0 | 1270 | $1,800 | $1.42 | 3d | 1 | 1.09mi |
| 4379 Hilldale Ave Las Vegas, NV | 2.0 | 1.0 | 954 | $1,485 | $1.56 | 8d | 1 | 1.12mi |
| 4855 E Vegas Valley Dr Las Vegas, NV | 1.0–3.0 | 1.0–2.0 | 949 | $1,579 | $1.66 | 2d | 15 | 1.22mi |
| 3012 S Mountain Vista St Unit MV Condo Las Vegas, NV | 2.0 | 1.0 | 828 | $945 | $1.14 | 44d | 1 | 1.23mi |
| 5465 E Jackpot Winner Ln Las Vegas, NV | 2.0 | 2.0 | 1069 | $1,395 | $1.30 | 23d | 1 | 1.24mi |
| 5465 Jackpot Winner Ln #101 Las Vegas, NV | 2.0 | 2.0 | 1069 | $1,440 | $1.35 | 23d | 1 | 1.24mi |
| 4800 E Tropicana Ave Las Vegas, NV | 1.0–2.0 | 1.0–2.0 | 976 | $1,495 | $1.53 | 2d | 31 | 1.26mi |
| 4800 E Tropicana Ave Las Vegas, NV | 1.0–2.0 | 1.0–2.0 | 976 | $1,495 | $1.53 | 23d | 5 | 1.26mi |
| 4663 Color Up Ct #102 Las Vegas, NV | 2.0 | 2.5 | 1170 | $1,600 | $1.37 | 23d | 1 | 1.29mi |
| 2977 Juniper Hills Blvd #104 Las Vegas, NV | 2.0 | 2.0 | 896 | $1,050 | $1.17 | 8d | 1 | 1.30mi |
| 2975 Juniper Hills Blvd #204 Las Vegas, NV | 2.0 | 2.0 | 884 | $1,000 | $1.13 | 44d | 1 | 1.30mi |
| 2979 Juniper Hills Blvd #203 Las Vegas, NV | 2.0 | 2.0 | 889 | $1,195 | $1.34 | 20d | 1 | 1.31mi |
| 4640 Vegas Valley Dr Las Vegas, NV | 1.0–2.0 | 1.0–2.0 | 853 | $1,340 | $1.57 | 44d | 1 | 1.32mi |
| 3950 S Sandhill Rd #121 Las Vegas, NV | 2.0 | 2.5 | 1172 | $1,599 | $1.36 | 4d | 1 | 1.32mi |
| 3950 S Sandhill Rd #121 Las Vegas, NV | 2.0 | 2.5 | 1172 | $1,599 | $1.36 | 23d | 1 | 1.32mi |
| 3950 S Sandhill Rd #121 Las Vegas, NV | 2.0 | 2.5 | 1172 | $1,599 | $1.36 | 44d | 1 | 1.32mi |
| 2985 Juniper Hills Blvd #203 Las Vegas, NV | 2.0 | 2.0 | 884 | $1,000 | $1.13 | 8d | 1 | 1.32mi |
| 2985 Juniper Hills Blvd #102 Las Vegas, NV | 2.0 | 2.0 | 891 | $1,225 | $1.37 | 15d | 1 | 1.32mi |
| 2967 Juniper Hills Blvd Las Vegas, NV | 2.0 | 2.0 | 884 | $1,190 | $1.35 | 18d | 1 | 1.34mi |
| 2967 Juniper Hills Blvd #104 Las Vegas, NV | 2.0 | 4.0 | 891 | $1,350 | $1.52 | 44d | 1 | 1.34mi |
| 2967 Juniper Hills Blvd #203 Las Vegas, NV | 2.0 | 2.0 | 884 | $1,190 | $1.35 | 44d | 1 | 1.34mi |
| 2883 Wheelwright Dr Unit 1 Las Vegas, NV | 2.0 | 2.0 | 918 | $1,195 | $1.30 | 8d | 1 | 1.34mi |
| 2963 Juniper Hills Blvd #204 Las Vegas, NV | 2.0 | 2.0 | 884 | $1,250 | $1.41 | 16d | 1 | 1.35mi |
| 2963 Juniper Hills Blvd #204 Las Vegas, NV | 2.0 | 2.0 | 884 | $1,250 | $1.41 | 44d | 1 | 1.35mi |
| 2967 Ferndale St Las Vegas, NV | 3.0 | 2.0 | 1134 | $1,835 | $1.62 | 23d | 1 | 1.36mi |
Listing history 8 events
-
2026-06-18days on market $95,900 Active 62 DOM
-
2026-06-17days on market $95,900 Active 61 DOM
-
2026-06-15days on market $95,900 Active 59 DOM
-
2026-06-13days on market $95,900 Active 57 DOM
-
2026-06-09days on market $95,900 Active 54 DOM
-
2026-06-08days on market $95,900 Active 53 DOM
-
2026-06-08remarks 32-char remark
-
2026-06-08$95,900 Active 52 DOM
ⓘ Source: listings_history table (triggers on properties + properties_extension) + one-shot
backfill from property_details.listing_events for pre-trigger history.
Climate risk First Street
- Heat 8/10 Severe
- Air quality 3/10 Moderate 3 unhealthy d/yr today · 4 by 30 yrs out
Nearby sold comps map
Loading sold comps map…
Walkable amenities ~0.75 mi
Loading nearby amenities…
Taxation est. · year 1
- Rental income
- $18,308
- − Mortgage interest
- −$5,372
- − Property taxes
- −$1,438
- − Insurance
- −$480
- − Repairs & maintenance
- −$1,465
- − Management
- −$1,465
- − Depreciation
- −$2,790
- Taxable income
- $5,299
- Est. tax owed @ 24.0%
- −$1,272
- After-tax cash flow
- $5,238/yr
For passive investors: Depreciation is non-cash, so a rental often shows a tax loss while cash-flowing — sheltering income. Rental losses are passive: they offset passive income freely, and up to $25,000/yr can offset ordinary (W-2) income if you actively participate and your MAGI is under $100k (phasing out to $0 by $150k); unused losses carry forward. On sale, claimed depreciation is recaptured at up to 25%, and gains may owe capital-gains tax (a 1031 exchange can defer both). Figures are a year-1 estimate at your 24.0% rate — not tax advice; consult a CPA.
Schools (NCES district)
- District
- Clark County School District
- NCES district ID
- 3200060
- Math proficiency
- 21% ▼ -13.00%
- Reading proficiency
- 39% ▼ -8.00%
- Median HH income
- $53,611
- Composite
- 26.48/100
- National rank
- #7211
- State rank
- #11 of 17 in NV
Livability — Paradise
- Score
- 76/100
- State rank
- #10
- US rank
- #3494
Category grades
Schools grade is shown separately in the Schools card above.
Census & demographics
- Census place
- Paradise, NV
- County
- Clark County · 2,306,105 people
- City population
- 227,885
- Metro
- Las Vegas-Henderson-Paradise, NV
- Population (ZIP)
- 68,406
- Household income
- $55,758
- Rent vs Own
- Severe rent burden
- 4080.0
Population outlook (Clark County) Hauer SSP2
- Today (2025)
- 2,504,101 people
- By 2030
- 2,693,770 · +7.6%
- By 2040
- 3,061,208 · +22.2%
- By 2050
- 3,400,072 · +35.8%
- By 2075
- 4,139,522 · +65.3%
- By 2100
- 4,596,916 · +83.6%
Race, ethnicity, and origin ACS 2023
- Neighborhood character
- Diverse neighborhood (Simpson 0.65)
- Race & ethnicity
- Hispanic / Latino 49% White 31% Two or more races 16% Black 11% Asian 4% Native American 1%
- Hispanic origin (detail)
- Mexican 30% Puerto Rican 1% Cuban 5%
- Common ancestry
- Lithuanian 2% Romanian 1% Slovak 1%
- Foreign-born
- 27% · Canada, Dominican Republic, Jamaica
- Languages at home
- 57% English-only · Spanish 37% Tagalog/Filipino 2% Other Asian/Pacific 1%
Political lean MEDSL · Clark
- 2024 margin
- Toss-up / Even · D 50.4% · R 47.8% · Other 1.7%
- 2008→2024 swing
- -16.5pp toward R · 2008: 19.1pp · 2024: 2.6pp
- All cycles
- 2024: D+2.6 2020: D+9.3 2016: D+10.7 2012: D+14.5 2008: D+19.1
Not yet ingested
- Civics
- —
Market trends
- HPI YoY
- ▼ -241.85%
- Current HPI
- 302.201
- Rent YoY
- ▼ -0.10%
- Metro
- Las Vegas-Henderson-Paradise, NV
- State GDP YoY
- ▲ 3.08%
- F500 in state
- 6
Industry mix (Fortune 500 HQ in NV)
| Industry | F500 HQs | Revenue |
|---|---|---|
| Hotels / Casinos | 3 | $36B |
|
||
Cash-flow waterfall
monthlySold comps — $/sqft
last 12 mo · ≤1 miLoading sold comps…