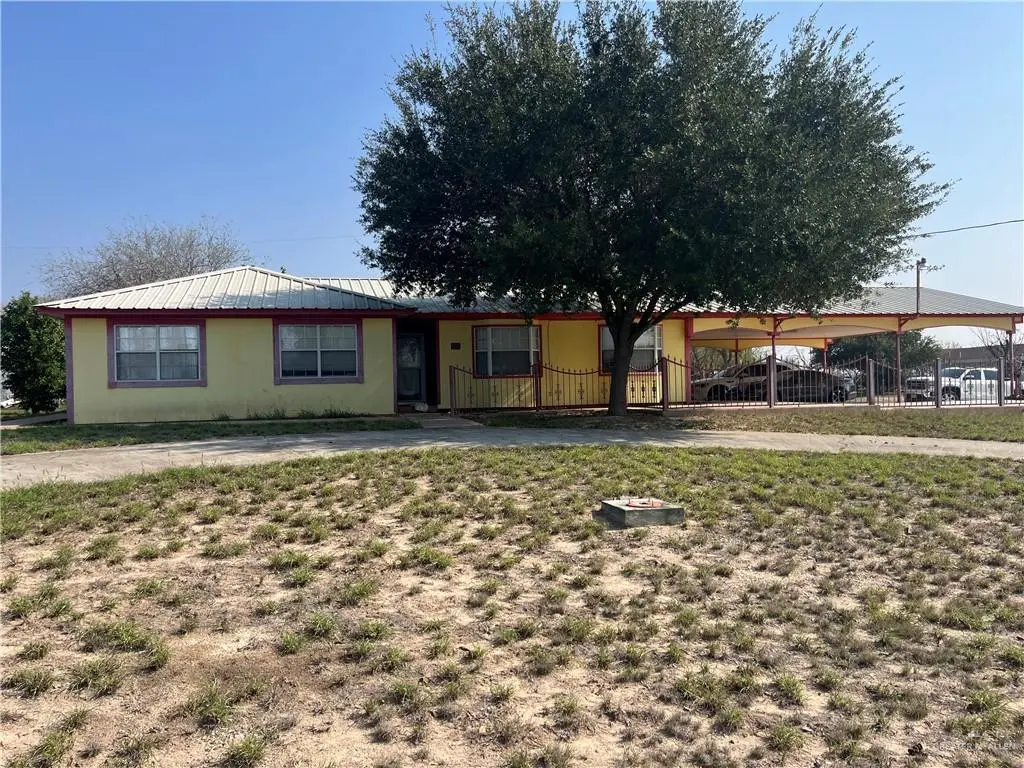
27 Las Palmas Rd · Las Palmas, TX
Flood risk 1/10 · Minimal
- FEMA flood zone
- X (unshaded)
- Chance of flooding over 30 yrs
- 0.0%
- Est. flood insurance / yr
- $507 – $1,088
Fire risk 6/10 · Moderate
- Est. fire insurance / yr
- $1,222 – $2,270
Heat risk 9/10 · Severe
- Hot days now (above 111°F)
- 6 days/yr
- Hot days in 30 yrs
- 19 days/yr
Wind risk 6/10 · Moderate
- Chance of severe wind over 30 yrs
- 66.0%
Air-quality risk 1/10 · Minimal
- Unhealthy air days now
- 0 days/yr
- Unhealthy air days in 30 yrs
- 0 days/yr
Risk factors via First Street. Map © Google.
Why this score? — see what drove the C- grade
The composite is a weighted blend of 9 inputs, each scored 0–100. Each bar is that input's sub-score; the figure is the points it added to the 100-point composite (weight × sub-score).
- Cash flow +19.7/30.0
- ARV discount +7.5/15.0
- Appreciation +6.3/10.0
- DSCR +6.2/10.0
- 1% rule +5.3/10.0
- Rent growth +2.5/5.0
- Condition / age +2.5/5.0
- Livability +2.2/5.0
- Schools +1.8/10.0
$139,000
🖨 Deal sheet (PDF) 📄 Offer letter ✓ Due diligence
Listing remarks MLS
4 Spacious Bedrooms – Plenty of room for family, guests, or a home office. 2 Full Baths . Carport – Covered parking for vehicles, plus extra driveway space. Inviting Living Area Kitchen – Ample cabinet space and great flow for cooking. Large Yard – Perfect for entertaining, pets, or future additions.
Key facts
- Covered parking
- Large yard
- Ample cabinet space
Tags
Neighborhood map
What this means for you Summary
Snapshot
- This is a 4-bed/2.0-bath single-family listed at $139k.
Deal economics
- At list price, monthly cash flow is $162 ($2k/yr) — positive.
- The deal already cash-flows at list — no discount required.
- Meets the 1% rule at list price ($1k rent vs $139k).
- Recommended offer: $122k (12.0% below list) — sets the bar for market timing.
Location & tenants
- Location reads 45/100 on livability (#1,555 in TX) — a working-class tenant base; expect higher turnover. Strengths: cost of living A+, crime A; Watch: amenities F, commute F, employment F.
- Zapata County ISD (town): math 21% / reading 24% proficiency, ranked #767 of 826 in TX (top 93%) — low school quality limits family demand, transient renter base, plan for 1-2y turnover; 70% free/reduced lunch — lower-income household profile, screen leases tightly.
- Zoned schools: Benavides El (math 10% / reading 10%, grade F, #4,250 of 4,322 statewide, top 99%, 61 students, 88% FRL); Zapata Middle (math 15% / reading 25%, grade F, #1,428 of 1,662 statewide, top 87%, 784 students, 83% FRL); Zapata H S (math 25% / reading 23%, grade F, #1,333 of 1,632 statewide, top 82%, 1,034 students, 87% FRL) — zoned schools average 86% FRL vs 70% district-wide (16 pts higher); higher-poverty schools than district average — tighter screening recommended.
- Market conditions: 92 active listings in the ZIP.
Forward outlook
- In year one you build about $5k of equity ($961 loan paydown + $4k appreciation (2.6% local appreciation)).
- Zapata County population projected to shrink 3% by 2050 — rents likely to lag national; underwrite the cash flow, not the appreciation.
- At projected returns (2.6% appreciation + 3.0% rent growth), your $39k cash investment doubles in ~6 years — after that, you're playing with house money.
- By year 8, paydown + projected appreciation supports a ~$34k cash-out refi (75% LTV) — recoverable capital for the next deal without selling this one.
Negotiation context
- It's been on market 201 days — a 12% lower offer ($122k) is reasonable based on typical stale-listing flexibility.
- 2 sale attempts since 9y ago; this cycle's ask has dropped $26k (16%) from the opening price — seller is motivated, your offer sets the floor, not the list.
Risks & watch-outs
- Climate carrying-cost: major wind risk, 66% chance of damaging wind over 30y; major wildfire risk; extreme-heat days projected 6→19/yr by 2055 (HVAC capex compounding) — expect insurance premiums to compound above CPI over the hold.
Questions for the listing agent
- It's been on market 201 days. Have you received any prior offers? Is the seller open to a 12% concession, seller financing, or rate buy-down credit?
- Why hasn't it sold? Are there any deal-killer items the seller is aware of (foundation, flood, title, zoning, code violations)?
- Is there a deadline driving the sale (1031 exchange, divorce, estate, relocation)? That informs how much negotiation room exists.
- What's the average days-on-market for RENTAL listings here right now (not sales)? A rising rental-DOM trend means longer vacancies and softer asking-rent achievability than the comps imply.
- What's the recent tenant-quality profile in this submarket — average credit score on applications, eviction rate, late-payment / NSF rate, and stable-employment percentage? A property-management company in the area should have these aggregated.
- How much new for-sale + rental construction is in the pipeline within 1–3 miles? Heavy new supply typically softens prices + rents 12–24 months out; constrained supply supports both.
Investment metrics
- 1% rule
- 1.03% ✓
- Cap rate
- 7.69%
- Cash-on-cash
- 5.01%
- DSCR
- 1.22
- GRM
- 8.1
CMA / ARV
No comps found within radius.
Projected returns pro-forma
2.61% appreciation · 3.0% rent growth · sell at horizon
- IRR
- 11.1%
- Equity multiple
- 1.62×
- Total profit
- $24,250
- Equity at exit
- $59,458
- IRR
- 13.6%
- Equity multiple
- 2.94×
- Total profit
- $75,503
- Equity at exit
- $89,333
Cash invested: $38,920 (down + closing). Projections, not guarantees.
Landlord ↔ Tenant lean methodology
- Overall (STATE)
- 87 Strongly Landlord-Friendly
- State Texas
- 87 Strongly Landlord-Friendly · R+5
- County
- — inherits STATE
- City
- — inherits STATE
ZIP-level market 78076
- Home prices YoY
- 2.3%
- Active inventory
- 92
- Price-to-rent
- 8.1×
Monthly cashflow live
- Estimated rent
- $1,428 medium interval (Pro) →
- Mortgage (P&I)
- −$729
- Tax from tax record
- −$179 /mo · $2,145/yr
- Insurance
- −$58
- HOA
- −$0
- Vacancy / Maint / Mgmt
- −$300
- Net cashflow
- $162
Break-even live
Sensitivity live
| Price | -10% $241 | -5% $202 | +0% $162 | +5% $123 | +10% $84 |
|---|---|---|---|---|---|
| Rent | -10% $50 | -5% $106 | +0% $162 | +5% $219 | +10% $275 |
| Rate | -1.0pp $232 | -0.5pp $198 | base $162 | +0.5pp $126 | +1.0pp $90 |
UW: 25.0% down · 7.5% · 30yr · 1.5% tax · 5.0% vac · 8.0% maint · 8.0% mgmt
Financing live
Cash to close
- Down payment
- $34,750
- Closing costs
- $4,170
- Reserves months
- —
- Total cash needed
- —
Loan-product check · same deal, 3 products live
Conventional
25% down · 7.5% · 30yr
- Down + closing
- —
- Monthly P&I
- —
- Monthly cashflow
- —
- DSCR
- —
- Eligible?
- —
Personal DTI + credit; lowest rate.
DSCR
20% down · 8.5% · 30yr
- Down + closing
- —
- Monthly P&I
- —
- Monthly cashflow
- —
- DSCR
- —
- Eligible?
- —
No personal income docs; deal must DSCR.
Hard money
10% down · 12.0% · 12mo
- Down + closing
- —
- Monthly P&I
- —
- Monthly cashflow
- —
- DSCR
- —
- Eligible?
- —
Short-term bridge; refi at stabilization.
Listing history 26 events
-
2026-06-21days on market $139,000 Active 201 DOM
-
2026-06-21days on market $139,000 Active 200 DOM
-
2026-06-18days on market $139,000 Active 198 DOM
-
2026-06-17days on market $139,000 Active 197 DOM
-
2026-06-16days on market $139,000 Active 196 DOM
-
2026-06-15days on market $139,000 Active 195 DOM
-
2026-06-15days on market $139,000 Active 194 DOM
-
2026-06-13days on market $139,000 Active 193 DOM
-
2026-06-12days on market $139,000 Active 192 DOM
-
2026-06-09days on market $139,000 Active 189 DOM
-
2026-06-08days on market $139,000 Active 188 DOM
-
2026-06-08days on market $139,000 Active 187 DOM
-
2026-06-07days on market $139,000 Active 186 DOM
-
2026-06-03days on market $139,000 Active 183 DOM
-
2026-06-02days on market $139,000 Active 182 DOM
-
2026-06-01days on market $139,000 Active 181 DOM
-
2026-05-31days on market $139,000 Active 180 DOM
-
2026-01-20price $139,000 332-char remark
Show marketing remark (332 chars)
4 Spacious Bedrooms – Plenty of room for family, guests, or a home office. 2 Full Baths . Carport – Covered parking for vehicles, plus extra driveway space. Inviting Living Area Kitchen – Ample cabinet space and great flow for cooking. Large Yard – Perfect for entertaining, pets, or future additions.
-
2025-12-02$165,000 Active 332-char remark
Show marketing remark (332 chars)
4 Spacious Bedrooms – Plenty of room for family, guests, or a home office. 2 Full Baths . Carport – Covered parking for vehicles, plus extra driveway space. Inviting Living Area Kitchen – Ample cabinet space and great flow for cooking. Large Yard – Perfect for entertaining, pets, or future additions.
-
2020-03-17soldstatus
-
2020-03-10soldstatus 511-char remark
Show marketing remark (511 chars)
Motivated Seller! Las Palmas Subd. - 4BR/2BA, sunroom, huge attached triple carport, one full lot plus partial second lot, corner property. Spacious living, kitchen, built-in appliances, dining nook, built-in hutch, plenty of storage and counters. Large bedrooms, master has sitting area, Jacuzzi tub. Metal roof, circular drive, brick BBQ patio, storage container and storage bldg. This secluded location is a great place to relax and refresh yourself. Only a short drive from townsite! Possible owner finance!
-
2018-06-09historical
-
2018-03-27price $120,000
-
2017-09-28$128,900 Active
-
2007-05-30soldstatus
-
2007-05-14soldstatus
ⓘ Source: listings_history table (triggers on properties + properties_extension) + one-shot
backfill from property_details.listing_events for pre-trigger history.
Tax reassessment forecast TX · Resets to sale price
- Current annual tax
- $2,145 · $179/mo
- Projected year-2 tax
- $2,544 · $212/mo
- Expected delta
- +$399/yr (+$33/mo · 18.6%)
ⓘ Screening estimate from a state-policy table — verify with the county assessor before closing.
Climate risk First Street
- Flood 1/10 Low FEMA zone X (unshaded) · 0% chance over 30 yrs
- Wildfire 6/10 Major
- Heat 9/10 Extreme 6 d/yr ≥111°F today · 19 d/yr by 30 yrs out
- Wind 6/10 Major 66% chance of damaging wind over 30 yrs
- Air quality 1/10 Low 0 unhealthy d/yr today · 0 by 30 yrs out
Nearby sold comps map
Loading sold comps map…
Walkable amenities ~0.75 mi
Loading nearby amenities…
Taxation est. · year 1
- Rental income
- $17,133
- − Mortgage interest
- −$7,786
- − Property taxes
- −$2,145
- − Insurance
- −$695
- − Repairs & maintenance
- −$1,371
- − Management
- −$1,371
- − Depreciation
- −$4,044
- Taxable loss
- −$278
- Est. tax savings @ 24.0%
- +$67
- After-tax cash flow
- $2,015/yr
For passive investors: Depreciation is non-cash, so a rental often shows a tax loss while cash-flowing — sheltering income. Rental losses are passive: they offset passive income freely, and up to $25,000/yr can offset ordinary (W-2) income if you actively participate and your MAGI is under $100k (phasing out to $0 by $150k); unused losses carry forward. On sale, claimed depreciation is recaptured at up to 25%, and gains may owe capital-gains tax (a 1031 exchange can defer both). Figures are a year-1 estimate at your 24.0% rate — not tax advice; consult a CPA.
Schools (NCES district)
- District
- Zapata County ISD
- NCES district ID
- 4846710
- Math proficiency
- 21% ▼ -23.00%
- Reading proficiency
- 24% ▼ -11.00%
- Median HH income
- $30,189
- Composite
- 18.09/100
- National rank
- #8974
- State rank
- #767 of 826 in TX
Livability — Las Palmas
- Score
- 45/100
- State rank
- #1555
- US rank
- #26545
Category grades
Schools grade is shown separately in the Schools card above.
Census & demographics
- Census place
- Las Palmas, TX
- Population (ZIP)
- 13,085
Population outlook (Zapata County) Hauer SSP2
- Today (2025)
- 14,795 people
- By 2030
- 14,837 · +0.3%
- By 2040
- 14,759 · -0.2%
- By 2050
- 14,316 · -3.2%
- By 2075
- 11,647 · -21.3%
- By 2100
- 7,265 · -50.9%
Race, ethnicity, and origin ACS 2023
- Neighborhood character
- Predominantly Hispanic (94%)
- Race & ethnicity
- Hispanic / Latino 94% Two or more races 52% White 5%
- Hispanic origin (detail)
- Mexican 89%
- Foreign-born
- 23% · Canada, Vietnam
- Languages at home
- 16% English-only · Spanish 84% Vietnamese 1%
Political lean MEDSL · Zapata
- 2024 margin
- Strong R (+22.4) · D 38.5% · R 61.0%
- 2008→2024 swing
- -58.0pp toward R · 2008: 35.6pp · 2024: -22.4pp
- All cycles
- 2024: R+22.4 2020: R+5.3 2016: D+32.8 2012: D+43.2 2008: D+35.6
Not yet ingested
- Civics
- —
Market trends
- HPI YoY
- ▲ 2.61%
- Current HPI
- 117.0315
- Rent YoY
- —
- Metro
- —
- State GDP YoY
- ▲ 3.95%
- F500 in state
- 110
Industry mix (Fortune 500 HQ in TX)
| Industry | F500 HQs | Revenue |
|---|---|---|
| Energy | 16 | $1,198B |
|
||
| Technology | 5 | $198B |
|
||
| Engineering / Construction | 4 | $72B |
|
||
| Energy Services | 3 | $60B |
|
||
| Utilities | 3 | $41B |
|
||
| Healthcare | 2 | $330B |
|
||
Price history
+7.8% since first listed9 events — show timeline
- 2026-01-20 Price Changed $139,000 MCALLENMLS
- 2025-12-02 Listed $165,000 MCALLENMLS
- 2020-03-17 Sold (Public Records) — Public Records
- 2020-03-10 Sold (MLS) — LAOR
- 2018-06-09 Delisted — CBMLS
- 2018-03-27 Price Changed $120,000 CBMLS
- 2017-09-28 Listed $128,900 CBMLS
- 2007-05-30 Sold (Public Records) — Public Records
- 2007-05-14 Sold (Public Records) — Public Records
Property tax history
+0.7%/yrLatest (2025): $2,145 · -2.2% YoY. Source: county tax records.
Cash-flow waterfall
monthlySold comps — $/sqft
last 12 mo · ≤1 miLoading sold comps…