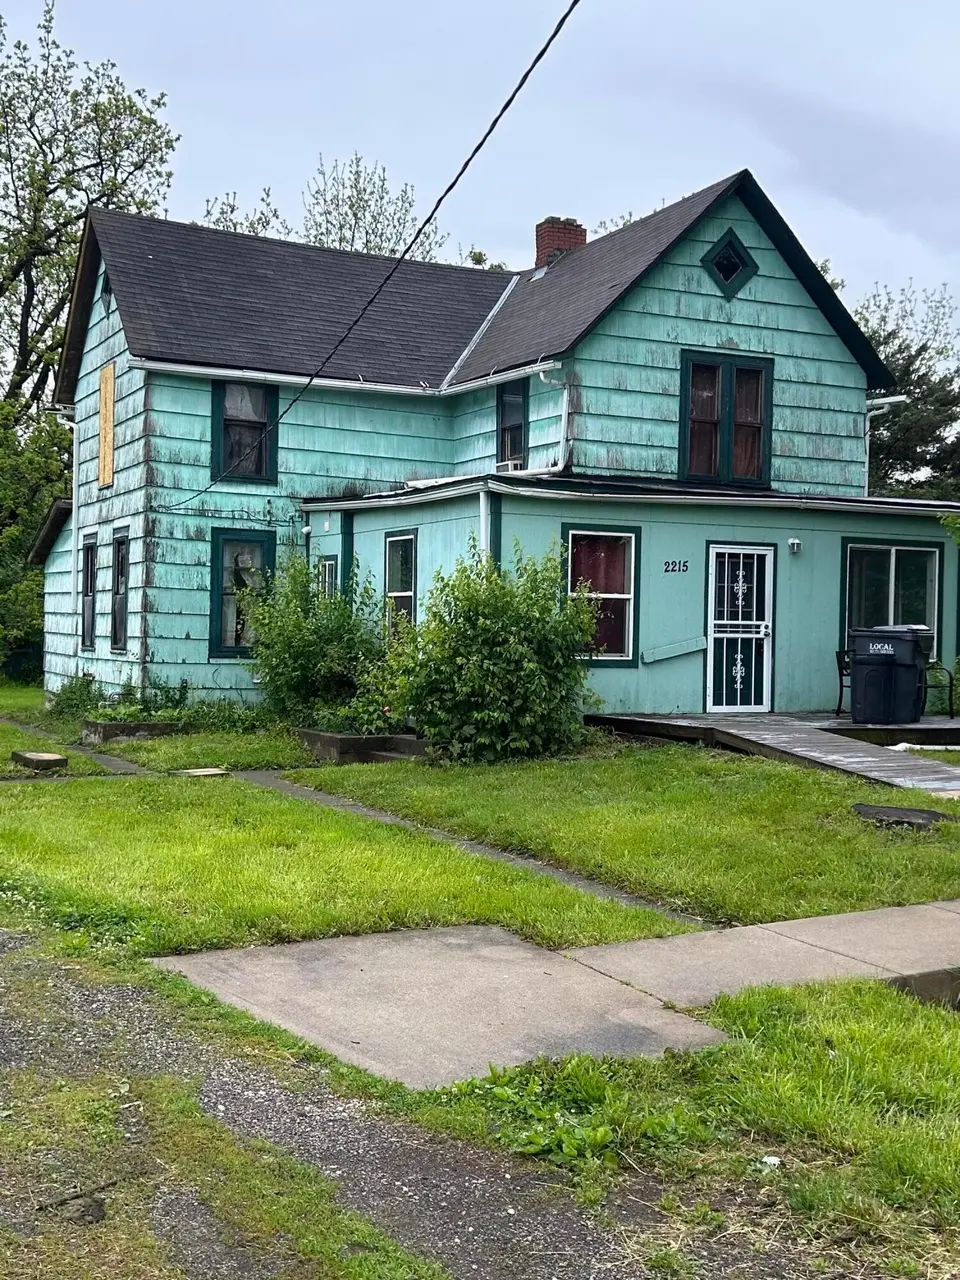
2215 Frank Rd · Columbus, OH
Flood risk 3/10 · Minor
- FEMA flood zone
- X (unshaded)
- Chance of flooding over 30 yrs
- 0.2%
- Est. flood insurance / yr
- $473 – $860
Fire risk 1/10 · Minimal
- Est. fire insurance / yr
- $713 – $1,323
Heat risk 4/10 · Minor
- Hot days now (above 102°F)
- 7 days/yr
- Hot days in 30 yrs
- 17 days/yr
Wind risk 2/10 · Minimal
- Chance of severe wind over 30 yrs
- 1.0%
Air-quality risk 2/10 · Minimal
- Unhealthy air days now
- 1 days/yr
- Unhealthy air days in 30 yrs
- 2 days/yr
Risk factors via First Street. Map © Google.
Why this score? — see what drove the B grade
The composite is a weighted blend of 9 inputs, each scored 0–100. Each bar is that input's sub-score; the figure is the points it added to the 100-point composite (weight × sub-score).
- Cash flow +30.0/30.0
- 1% rule +10.0/10.0
- DSCR +10.0/10.0
- ARV discount +7.9/15.0
- Livability +4.0/5.0
- Schools +3.8/10.0
- Rent growth +3.7/5.0
- Condition / age +2.5/5.0
- Appreciation +0.0/10.0
$110,000
🖨 Deal sheet 📄 Offer letter ✓ Due diligence
Key facts
- 0.45 acre lot
- Built 1905
- Listed 7 days
Property features AI
Exterior
- Utilities: Public water; Public sewer
- Home design: Single family home; Two stories; Built in 1905; No shared/common walls
- Construction: Block foundation
- Exterior features: Approximately 0.45-acre lot
Interior
- Bedrooms: One main-level bedroom
- Bathrooms: Three full bathrooms
- Interior features: Full basement
Neighborhood map
What this means for you Summary
Snapshot
- This is a 3-bed/1.0-bath single-family listed at $110k.
Deal economics
- At list price, monthly cash flow is $800 ($10k/yr) — positive.
- The deal already cash-flows at list — no discount required.
- Meets the 1% rule at list price ($2k rent vs $110k).
- Cap rate 15.0% vs local median 3.8% in Columbus — top-decile yield for the area; either an underpriced asset or a hidden risk that comps aren't pricing in. Stress-test before assuming the spread holds.
Location & tenants
- Location reads 81/100 on livability (#97 in OH, #1,491 nationally) — a professional / high-income tenant draw. Strengths: commute A+, cost of living A+, housing A+; Watch: employment C-, crime F.
- South-Western City (suburban): math 40% / reading 48% proficiency, ranked #500 of 656 in OH (top 76%) — families likely to look elsewhere, expect single-tenant / working-renter base with shorter leases.
- Market conditions: Rents rising fast (+4.6%/yr); 144 active listings in the ZIP; 14 comparable units currently listed for rent nearby; rentals at typical pace (median 24d on market — plan ~3-4 weeks tenant-placement turnaround); 43% of comp listings sitting > 30 days — soft ceiling on asking rent; 8,139 units permitted in Franklin County in 2024 (5,940 in 5+ unit buildings).
- At $1,925/mo this rent would consume 49% of the median local household income ($47k/yr) (locally 1689% of renters already pay >50% of income on rent) — very limited rent-growth headroom before tenants either downsize or default.
Forward outlook
- Local home prices are declining (-3.0%/yr); year-one equity from $761 of loan paydown is wiped out by about $3k of value loss. Plan a longer hold.
- Franklin County population projected at +34% by 2050 — long-run rental-demand tailwind backs the buy-and-hold thesis.
- At projected returns (-3.0% appreciation + 4.6% rent growth), your $31k cash investment doubles in ~4 years — after that, you're playing with house money.
Negotiation context
- Only 7 days on market — expect competitive offers; lowballing is unlikely to land.
Risks & watch-outs
- Watch-outs: built in 1905 — expect roof / HVAC / electrical / plumbing capex.
Questions for the listing agent
- Built in 1905 — when were the roof, HVAC, electrical panel, plumbing, and water heater last replaced?
- Is there a deadline driving the sale (1031 exchange, divorce, estate, relocation)? That informs how much negotiation room exists.
- Crime grade is F in this area — have there been break-ins, vandalism, or insurance claims at this property in the last 3 years? What carrier currently insures it and at what premium?
- What's the average days-on-market for RENTAL listings here right now (not sales)? A rising rental-DOM trend means longer vacancies and softer asking-rent achievability than the comps imply.
- What's the recent tenant-quality profile in this submarket — average credit score on applications, eviction rate, late-payment / NSF rate, and stable-employment percentage? A property-management company in the area should have these aggregated.
- How much new for-sale + rental construction is in the pipeline within 1–3 miles? Heavy new supply typically softens prices + rents 12–24 months out; constrained supply supports both.
Investment metrics
- 1% rule
- 1.75% ✓
- Cap rate
- 15.02%
- Cash-on-cash
- 31.17%
- DSCR
- 2.39
- GRM
- 4.8
CMA / ARV
- ARV (median comp)
- $111,020
- List price
- $110,000
- Delta
- -0.92%
- Verdict
- FAIR
- Comps
- 20 within 1.0 mi
Show comp detail 12 sales within ~0.75 mi
| Address | Dist | Beds/Ba | Sqft | Sold | Price | $/sf | Match |
|---|---|---|---|---|---|---|---|
| 1949 Big Run Bluff Blvd | 0.41mi | 3/2.0 | 1,568 (-7%) | 3mo | $105,000 | $67 | 63 |
| 2248 Golden Leaf Ln | 0.31mi | 3/2.5 | 1,512 (-10%) | 4mo | $255,000 | $169 | 60 |
| 1372 Stanwix Ct | 0.71mi | 3/2.5 | 1,701 (+1%) | 1mo | $289,900 | $170 | 58 |
| 2243 Golden Leaf Ln | 0.29mi | 3/2.0 | 1,448 (-14%) | 5mo | $190,000 | $131 | 55 |
| 1684 Eastbrook Dr N | 0.60mi | 3/2.0 | 1,524 (-9%) | 1mo | $285,000 | $187 | 52 |
| 1360 Hafton Woods Dr | 0.57mi | 3/2.0 | 1,516 (-10%) | 2mo | $305,000 | $201 | 51 |
| 1543 Red Leaf Ln | 0.47mi | 3/2.5 | 1,428 (-15%) | 2mo | $239 | — | 46 |
| 1935 Little Water Dr | 0.65mi | 3/2.5 | 1,808 (+8%) | 7mo | $290,000 | $160 | 45 |
| 1640 Butterfly Ct | 0.45mi | 4/2.0 (+1) | 1,433 (-15%) | 3mo | $244,500 | $171 | 43 |
| 1650 Westbrook Dr | 0.52mi | 4/2.0 (+1) | 1,429 (-15%) | 1mo | $245,000 | $171 | 41 |
| 2894 Creith Ct | 0.65mi | 3/1.5 | 1,444 (-14%) | 6mo | $247,000 | $171 | 40 |
| 1834 Saint Lawrence Dr | 0.71mi | 4/3.0 (+1) | 1,808 (+8%) | 3mo | $310,000 | $171 | 39 |
Match score weights: distance 35% · size 25% · config 20% · recency 20%. Top-matched comps best support the ARV.
Projected returns pro-forma
-3.0% appreciation · 4.61% rent growth · sell at horizon
- IRR
- 27.8%
- Equity multiple
- 2.18×
- Total profit
- $36,303
- Equity at exit
- $16,401
- IRR
- 36.2%
- Equity multiple
- 4.59×
- Total profit
- $110,680
- Equity at exit
- $9,511
Cash invested: $30,800 (down + closing). Projections, not guarantees.
Landlord ↔ Tenant lean methodology
- Overall (STATE)
- 73 Landlord-Friendly
- State Ohio
- 73 Landlord-Friendly · R+6
- County
- — inherits STATE
- City
- — inherits STATE
ZIP-level market 43223
- Rents YoY
- 4.6%
- Active inventory
- 144
- Price-to-rent
- 4.8×
Monthly cashflow live
- Estimated rent
- $1,925 high interval (Pro) →
- Mortgage (P&I)
- −$577
- Tax from tax record
- −$98 /mo · $1,177/yr
- Insurance
- −$46
- HOA
- −$0
- Vacancy / Maint / Mgmt
- −$404
- Net cashflow
- $800
Break-even live
UW: 25.0% down · 7.5% · 30yr · 1.5% tax · 5.0% vac · 8.0% maint · 8.0% mgmt
Financing live
Cash to close
- Down payment
- $27,500
- Closing costs
- $3,300
- Reserves months
- —
- Total cash needed
- —
Loan-product check · same deal, 3 products live
Conventional
25% down · 7.5% · 30yr
- Down + closing
- —
- Monthly P&I
- —
- Monthly cashflow
- —
- DSCR
- —
- Eligible?
- —
Personal DTI + credit; lowest rate.
DSCR
20% down · 8.5% · 30yr
- Down + closing
- —
- Monthly P&I
- —
- Monthly cashflow
- —
- DSCR
- —
- Eligible?
- —
No personal income docs; deal must DSCR.
Hard money
10% down · 12.0% · 12mo
- Down + closing
- —
- Monthly P&I
- —
- Monthly cashflow
- —
- DSCR
- —
- Eligible?
- —
Short-term bridge; refi at stabilization.
Rent comps 14 comps
| Address | Beds | Baths | Sqft | Rent | $/sqft | DOM | Units | Dist |
|---|---|---|---|---|---|---|---|---|
| 1640 Butterfly Ct Columbus, OH | 4.0 | 2.0 | 1433 | $1,849 | $1.29 | 3d | 1 | 0.44mi |
| 2887 Creith Ct Grove City, OH | 3.0 | 2.0 | 1201 | $2,023 | $1.68 | 44d | 1 | 0.68mi |
| 1475 Pineland Ct Columbus, OH | 4.0 | 2.5 | 1170 | $2,023 | $1.73 | 44d | 1 | 0.69mi |
| 2956 Crocker Run Rd Grove City, OH | 3.0 | 1.5 | 1200 | $2,000 | $1.67 | 44d | 1 | 0.75mi |
| 1417 Fahy Dr Columbus, OH | 3.0 | 2.0 | 1932 | $2,345 | $1.21 | 10d | 1 | 0.79mi |
| 2290 Turquoise Dr Grove City, OH | 3.0 | 1.0 | 1232 | $2,225 | $1.81 | 16d | 1 | 0.87mi |
| 2348 Warfield Dr Grove City, OH | 4.0 | 2.0 | 1262 | $1,825 | $1.45 | 44d | 1 | 0.96mi |
| 945 Hodges Dr Columbus, OH | 3.0 | 1.0 | 1078 | $1,640 | $1.52 | 23d | 1 | 1.06mi |
| 2284 Brookbank Dr Grove City, OH | 3.0 | 2.0 | 1478 | $2,275 | $1.54 | 10d | 1 | 1.14mi |
| 1433 Tall Meadows Dr Columbus, OH | 3.0 | 1.5 | 1428 | $1,995 | $1.40 | 12d | 1 | 1.20mi |
| 695 S Eureka Ave Columbus, OH | 3.0 | 1.0 | 1344 | $1,425 | $1.06 | 21d | 1 | 1.38mi |
| 692 S Wheatland Ave Columbus, OH | 3.0 | 1.0 | 1608 | $1,547 | $0.96 | 44d | 1 | 1.40mi |
| 1241 Riegelwood Ln Columbus, OH | 4.0 | 3.0 | 1868 | $2,480 | $1.33 | 1d | 1 | 1.42mi |
| 661-663 S Burgess Ave Columbus, OH | 3.0 | 1.0 | 1100 | $1,028 | $0.93 | 44d | 1 | 1.46mi |
Listing history 2 events
-
2026-05-16status Pending 55-char remark
-
2026-05-08$110,000 Active 55-char remark
ⓘ Source: listings_history table (triggers on properties + properties_extension) + one-shot
backfill from property_details.listing_events for pre-trigger history.
Tax reassessment forecast OH · Partial reset (capped growth)
- Current annual tax
- $1,177 · $98/mo
- Projected year-2 tax
- $1,446 · $121/mo
- Expected delta
- +$270/yr (+$22/mo · 22.9%)
ⓘ Screening estimate from a state-policy table — verify with the county assessor before closing.
Climate risk First Street
- Flood 3/10 Moderate FEMA zone X (unshaded) · 20% chance over 30 yrs
- Wildfire 1/10 Low
- Heat 4/10 Moderate 7 d/yr ≥102°F today · 17 d/yr by 30 yrs out
- Wind 2/10 Low 100% chance of damaging wind over 30 yrs
- Air quality 2/10 Low 1 unhealthy d/yr today · 2 by 30 yrs out
Nearby sold comps map
Loading sold comps map…
Walkable amenities ~0.75 mi
Loading nearby amenities…
Taxation est. · year 1
- Rental income
- $23,100
- − Mortgage interest
- −$6,162
- − Property taxes
- −$1,177
- − Insurance
- −$550
- − Repairs & maintenance
- −$1,848
- − Management
- −$1,848
- − Depreciation
- −$3,200
- Taxable income
- $8,316
- Est. tax owed @ 24.0%
- −$1,996
- After-tax cash flow
- $7,605/yr
For passive investors: Depreciation is non-cash, so a rental often shows a tax loss while cash-flowing — sheltering income. Rental losses are passive: they offset passive income freely, and up to $25,000/yr can offset ordinary (W-2) income if you actively participate and your MAGI is under $100k (phasing out to $0 by $150k); unused losses carry forward. On sale, claimed depreciation is recaptured at up to 25%, and gains may owe capital-gains tax (a 1031 exchange can defer both). Figures are a year-1 estimate at your 24.0% rate — not tax advice; consult a CPA.
Schools (NCES district)
- District
- South-Western City
- NCES district ID
- 3904480
- Math proficiency
- 40% ▼ -18.00%
- Reading proficiency
- 48% ▼ -10.00%
- Median HH income
- $51,689
- Composite
- 37.95/100
- National rank
- #4305
- State rank
- #500 of 656 in OH
Livability — Columbus
- Score
- 81/100
- State rank
- #97
- US rank
- #1491
Category grades
Schools grade is shown separately in the Schools card above.
Census & demographics
- County
- Franklin County · 1,351,780 people
- City population
- 612,189
- Metro
- Columbus, OH
- Population (ZIP)
- 28,187
- Household income
- $46,911
- Rent vs Own
- Severe rent burden
- 1689.0
Population outlook (Franklin County) Hauer SSP2
- Today (2025)
- 1,456,139 people
- By 2030
- 1,556,890 · +6.9%
- By 2040
- 1,757,349 · +20.7%
- By 2050
- 1,950,539 · +34.0%
- By 2075
- 2,376,171 · +63.2%
- By 2100
- 2,636,796 · +81.1%
Race, ethnicity, and origin ACS 2023
- Neighborhood character
- Diverse neighborhood (Simpson 0.55)
- Race & ethnicity
- White 63% Black 22% Two or more races 8% Hispanic / Latino 8%
- Hispanic origin (detail)
- Mexican 4% Puerto Rican 3%
- Common ancestry
- Romanian 4% Italian 1% Slovak 1%
- Foreign-born
- 5% · Canada
- Languages at home
- 91% English-only · Spanish 5%
Political lean MEDSL · Franklin
- 2024 margin
- Strong D (+28.4) · D 63.7% · R 35.3% · Other 1.0%
- 2008→2024 swing
- +7.7pp toward D · 2008: 20.7pp · 2024: 28.4pp
- All cycles
- 2024: D+28.4 2020: D+31.4 2016: D+25.9 2012: D+21.7 2008: D+20.7
Not yet ingested
- Civics
- —
Market trends
- HPI YoY
- ▼ -135.33%
- Current HPI
- 211.6742
- Rent YoY
- ▲ 4.61%
- Metro
- Columbus, OH
- State GDP YoY
- ▲ 1.98%
- F500 in state
- 48
Industry mix (Fortune 500 HQ in OH)
| Industry | F500 HQs | Revenue |
|---|---|---|
| Insurance | 3 | $145B |
|
||
| Industrial Machinery | 3 | $49B |
|
||
| Financial Services | 3 | $24B |
|
||
| Consumer Goods | 2 | $93B |
|
||
| Aerospace / Defense | 2 | $47B |
|
||
| Utilities | 2 | $33B |
|
||
Price history
2 events — show timeline
- 2026-05-16 Pending — CBRMLS
- 2026-05-08 Listed $110,000 CBRMLS
Property tax history
+7.3%/yrLatest (2024): $1,177 · +0.5% YoY. Source: county tax records.
Cash-flow waterfall
monthlySold comps — $/sqft
last 12 mo · ≤1 miLoading sold comps…