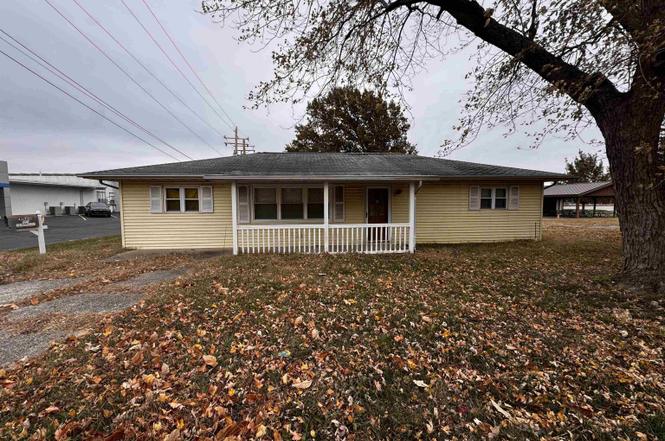
1120 N Market St · Sparta, IL
Flood risk 1/10 · Minimal
- FEMA flood zone
- X (unshaded)
- Chance of flooding over 30 yrs
- 0.0%
- Est. flood insurance / yr
- $473 – $860
Fire risk 1/10 · Minimal
- Est. fire insurance / yr
- $804 – $1,492
Heat risk 5/10 · Moderate
- Hot days now (above 106°F)
- 7 days/yr
- Hot days in 30 yrs
- 21 days/yr
Wind risk 2/10 · Minimal
- Chance of severe wind over 30 yrs
- 2.0%
Air-quality risk 2/10 · Minimal
- Unhealthy air days now
- 0 days/yr
- Unhealthy air days in 30 yrs
- 1 days/yr
Risk factors via First Street. Map © Google.
Why this score? — see what drove the B- grade
The composite is a weighted blend of 9 inputs, each scored 0–100. Each bar is that input's sub-score; the figure is the points it added to the 100-point composite (weight × sub-score).
- Cash flow +30.0/30.0
- 1% rule +10.0/10.0
- DSCR +10.0/10.0
- ARV discount +7.5/15.0
- Livability +2.9/5.0
- Rent growth +2.5/5.0
- Condition / age +2.5/5.0
- Schools +1.2/10.0
- Appreciation +0.0/10.0
$45,000
🖨 Deal sheet 📄 Offer letter ✓ Due diligence
Listing remarks
Great investment opportunity in a prime location! This 3 bedroom, 2 bathroom home with a garage is located on N Market Street in Sparta, surrounded by established and growing commercial properties. With excellent visibility and convenient access to shopping, dining, and local businesses, the location offers outstanding potential. The home features a spacious layout with three bedrooms, two bathrooms, and a garage, but will require significant updating and repairs, making it an ideal project for investors, flippers, or buyers looking to renovate and add value. With its highly desirable location and strong potential, this property is ready for someone with vision to bring it back to life. Pro
Key facts
- Excellent visibility
- Convenient access
- Prime location
Tags
Neighborhood map
What this means for you Summary
Snapshot
- This is a 3-bed/2.0-bath single-family listed at $45k.
Deal economics
- At list price, monthly cash flow is $438 ($5k/yr) — positive.
- The deal already cash-flows at list — no discount required.
- Meets the 1% rule at list price ($902 rent vs $45k).
- Cap rate 18.0% vs local median 6.7% in Sparta — top-decile yield for the area; either an underpriced asset or a hidden risk that comps aren't pricing in. Stress-test before assuming the spread holds.
Location & tenants
- Location reads 58/100 on livability (#1,090 in IL) — a working-class tenant base; expect higher turnover. Strengths: cost of living A+, housing A+, crime B+; Watch: employment C-, amenities F, commute F.
- Sparta CUSD 140 (town): math 13% / reading 14% proficiency, ranked #535 of 620 in IL (top 86%) — low school quality limits family demand, transient renter base, plan for 1-2y turnover.
- Zoned schools: Sparta High School (math 12% / reading 8%, grade F, #567 of 693 statewide, top 83%, 327 students, 0% FRL) — zoned schools average 0% FRL vs 49% district-wide (49 pts lower); this property's tenant base skews higher-income than the district average.
- Market conditions: 31 active listings in the ZIP; 3 units permitted in Randolph County in 2024 (0 in 5+ unit buildings).
Forward outlook
- Local home prices are declining (-3.0%/yr); year-one equity from $311 of loan paydown is wiped out by about $1k of value loss. Plan a longer hold.
- Randolph County population projected at -14% by 2050 — secular population decline; favor cash flow + early exit over multi-decade hold.
- At projected returns (-3.0% appreciation + 3.0% rent growth), your $13k cash investment doubles in ~3 years — after that, you're playing with house money.
Negotiation context
- Only 9 days on market — expect competitive offers; lowballing is unlikely to land.
Risks & watch-outs
- Watch-outs: built in 1950 — expect roof / HVAC / electrical / plumbing capex.
- Climate carrying-cost: extreme-heat days projected 7→21/yr by 2055 (HVAC capex compounding) — expect insurance premiums to compound above CPI over the hold.
Questions for the listing agent
- Built in 1950 — when were the roof, HVAC, electrical panel, plumbing, and water heater last replaced?
- Is there a deadline driving the sale (1031 exchange, divorce, estate, relocation)? That informs how much negotiation room exists.
- Schools are F-rated, which usually means shorter tenancies and higher turnover. Who's the typical renter profile here, and what's been the actual vacancy rate?
- What's the average days-on-market for RENTAL listings here right now (not sales)? A rising rental-DOM trend means longer vacancies and softer asking-rent achievability than the comps imply.
- What's the recent tenant-quality profile in this submarket — average credit score on applications, eviction rate, late-payment / NSF rate, and stable-employment percentage? A property-management company in the area should have these aggregated.
- How much new for-sale + rental construction is in the pipeline within 1–3 miles? Heavy new supply typically softens prices + rents 12–24 months out; constrained supply supports both.
Investment metrics
- 1% rule
- 2.00% ✓
- Cap rate
- 17.97%
- Cash-on-cash
- 41.72%
- DSCR
- 2.86
- GRM
- 4.2
CMA / ARV
- ARV (on-the-fly)
- $116,400
- Comps found
- 12
Show comp detail 12 sales within ~0.75 mi
| Address | Dist | Beds/Ba | Sqft | Sold | Price | $/sf | Match |
|---|---|---|---|---|---|---|---|
| 1120 N Market St | 0.00mi | 3/2.0 | 1,200 (0%) | 1mo | $35,000 | $29 | 99 |
| 905 N Pine St | 0.34mi | 2/2.0 (-1) | 1,224 (+2%) | 3mo | $132,000 | $108 | 73 |
| 700 N James St | 0.48mi | 3/4.0 | 1,196 (-0%) | 12mo | $70,000 | $59 | 59 |
| 630 Cypress Dr | 0.50mi | 3/1.5 | 1,190 (-1%) | 19mo | $120,000 | $101 | 57 |
| 1063 Meadow Ln | 0.46mi | 3/1.0 | 1,225 (+2%) | 18mo | $180,000 | $147 | 56 |
| 307 W Church St | 0.69mi | 3/1.0 | 1,216 (+1%) | 8mo | $115,000 | $95 | 55 |
| 1102 Birch Ln | 0.48mi | 3/1.0 | 1,152 (-4%) | 18mo | $135,000 | $117 | 52 |
| 717 N Saint Louis St | 0.40mi | 2/2.0 (-1) | 1,302 (+8%) | 14mo | $126,000 | $97 | 50 |
| 601 N Vine St | 0.47mi | 3/1.0 | 1,152 (-4%) | 22mo | $60,000 | $52 | 49 |
| 316 N St. Louis St | 0.63mi | 2/1.5 (-1) | 1,310 (+9%) | 2mo | $169,900 | $130 | 47 |
| 317 N Washington St | 0.60mi | 2/1.0 (-1) | 1,100 (-8%) | 10mo | $32,100 | $29 | 41 |
| 401 N James St | 0.64mi | 3/1.0 | 1,040 (-13%) | 16mo | $87,500 | $84 | 31 |
Match score weights: distance 35% · size 25% · config 20% · recency 20%. Top-matched comps best support the ARV.
Projected returns pro-forma
-3.0% appreciation · 3.0% rent growth · sell at horizon
- IRR
- 38.3%
- Equity multiple
- 2.63×
- Total profit
- $20,598
- Equity at exit
- $6,710
- IRR
- 44.8%
- Equity multiple
- 5.27×
- Total profit
- $53,825
- Equity at exit
- $3,891
Cash invested: $12,600 (down + closing). Projections, not guarantees.
Landlord ↔ Tenant lean methodology
- Overall (STATE)
- 43 Moderately Tenant-Leaning
- State Illinois
- 43 Moderately Tenant-Leaning · D+7
- County
- — inherits STATE
- City
- — inherits STATE
ZIP-level market 62286
- Home prices YoY
- -31.0%
- Active inventory
- 31
- Price-to-rent
- 4.2×
Monthly cashflow live
- Estimated rent
- $902 medium interval (Pro) →
- Mortgage (P&I)
- −$236
- Tax from tax record
- −$20 /mo · $237/yr
- Insurance
- −$19
- HOA
- −$0
- Vacancy / Maint / Mgmt
- −$189
- Net cashflow
- $438
Break-even live
UW: 25.0% down · 7.5% · 30yr · 1.5% tax · 5.0% vac · 8.0% maint · 8.0% mgmt
Financing live
Cash to close
- Down payment
- $11,250
- Closing costs
- $1,350
- Reserves months
- —
- Total cash needed
- —
Loan-product check · same deal, 3 products live
Conventional
25% down · 7.5% · 30yr
- Down + closing
- —
- Monthly P&I
- —
- Monthly cashflow
- —
- DSCR
- —
- Eligible?
- —
Personal DTI + credit; lowest rate.
DSCR
20% down · 8.5% · 30yr
- Down + closing
- —
- Monthly P&I
- —
- Monthly cashflow
- —
- DSCR
- —
- Eligible?
- —
No personal income docs; deal must DSCR.
Hard money
10% down · 12.0% · 12mo
- Down + closing
- —
- Monthly P&I
- —
- Monthly cashflow
- —
- DSCR
- —
- Eligible?
- —
Short-term bridge; refi at stabilization.
Listing history 2 events
-
2026-03-22status Pending
-
2026-03-13$45,000 Active
ⓘ Source: listings_history table (triggers on properties + properties_extension) + one-shot
backfill from property_details.listing_events for pre-trigger history.
Tax reassessment forecast IL · Partial reset (capped growth)
- Current annual tax
- $237 · $20/mo
- Projected year-2 tax
- $629 · $52/mo
- Expected delta
- +$392/yr (+$33/mo · 165.4%)
ⓘ Screening estimate from a state-policy table — verify with the county assessor before closing.
Climate risk First Street
- Flood 1/10 Low FEMA zone X (unshaded) · 0% chance over 30 yrs
- Wildfire 1/10 Low
- Heat 5/10 Major 7 d/yr ≥106°F today · 21 d/yr by 30 yrs out
- Wind 2/10 Low 2% chance of damaging wind over 30 yrs
- Air quality 2/10 Low 0 unhealthy d/yr today · 1 by 30 yrs out
Nearby sold comps map
Loading sold comps map…
Walkable amenities ~0.75 mi
Loading nearby amenities…
Taxation est. · year 1
- Rental income
- $10,823
- − Mortgage interest
- −$2,521
- − Property taxes
- −$237
- − Insurance
- −$225
- − Repairs & maintenance
- −$866
- − Management
- −$866
- − Depreciation
- −$1,309
- Taxable income
- $4,800
- Est. tax owed @ 24.0%
- −$1,152
- After-tax cash flow
- $4,105/yr
For passive investors: Depreciation is non-cash, so a rental often shows a tax loss while cash-flowing — sheltering income. Rental losses are passive: they offset passive income freely, and up to $25,000/yr can offset ordinary (W-2) income if you actively participate and your MAGI is under $100k (phasing out to $0 by $150k); unused losses carry forward. On sale, claimed depreciation is recaptured at up to 25%, and gains may owe capital-gains tax (a 1031 exchange can defer both). Figures are a year-1 estimate at your 24.0% rate — not tax advice; consult a CPA.
Schools (NCES district)
- District
- Sparta CUSD 140
- NCES district ID
- 1736900
- Math proficiency
- 13% ▼ -10.00%
- Reading proficiency
- 14% ▼ -13.00%
- Median HH income
- $43,992
- Composite
- 11.95/100
- National rank
- #9668
- State rank
- #535 of 620 in IL
Livability — Sparta
- Score
- 58/100
- State rank
- #1090
- US rank
- #20732
Category grades
Schools grade is shown separately in the Schools card above.
Census & demographics
- Census place
- Sparta, IL
- City population
- 5,482
- Population (ZIP)
- 5,482
Population outlook (Randolph County) Hauer SSP2
- Today (2025)
- 31,417 people
- By 2030
- 30,519 · -2.9%
- By 2040
- 28,841 · -8.2%
- By 2050
- 27,150 · -13.6%
- By 2075
- 22,569 · -28.2%
- By 2100
- 16,584 · -47.2%
Race, ethnicity, and origin ACS 2023
- Neighborhood character
- Predominantly White (82%)
- Race & ethnicity
- White 82% Black 10% Two or more races 7% Hispanic / Latino 3%
- Common ancestry
- Serbian 9% Lithuanian 2% Slovak 2%
- Languages at home
- 99% English-only · French/Haitian/Cajun 1%
Political lean MEDSL · Randolph
- 2024 margin
- Solid R (+50.0) · D 24.1% · R 74.1% · Other 1.7%
- 2008→2024 swing
- -49.0pp toward R · 2008: -0.9pp · 2024: -50.0pp
- All cycles
- 2024: R+50.0 2020: R+50.2 2016: R+46.8 2012: R+17.6 2008: R+0.9
Not yet ingested
- Civics
- —
Market trends
- HPI YoY
- ▼ -52.47%
- Current HPI
- 116.6798
- Rent YoY
- —
- Metro
- —
- State GDP YoY
- ▲ 1.59%
- F500 in state
- 60
Industry mix (Fortune 500 HQ in IL)
| Industry | F500 HQs | Revenue |
|---|---|---|
| Insurance | 4 | $201B |
|
||
| Consumer Goods | 4 | $87B |
|
||
| Industrial Machinery | 3 | $64B |
|
||
| Healthcare | 2 | $55B |
|
||
| Retail / Pharmacy | 1 | $148B |
|
||
| Agriculture / Food | 1 | $86B |
|
||
Price history
2 events — show timeline
- 2026-03-22 Pending — RMLSA as Distributed by MLS Grid
- 2026-03-13 Listed $45,000 RMLSA as Distributed by MLS Grid
Property tax history
-0.4%/yrLatest (2024): $237 · -74.9% YoY. Source: county tax records.
Cash-flow waterfall
monthlySold comps — $/sqft
last 12 mo · ≤1 miLoading sold comps…