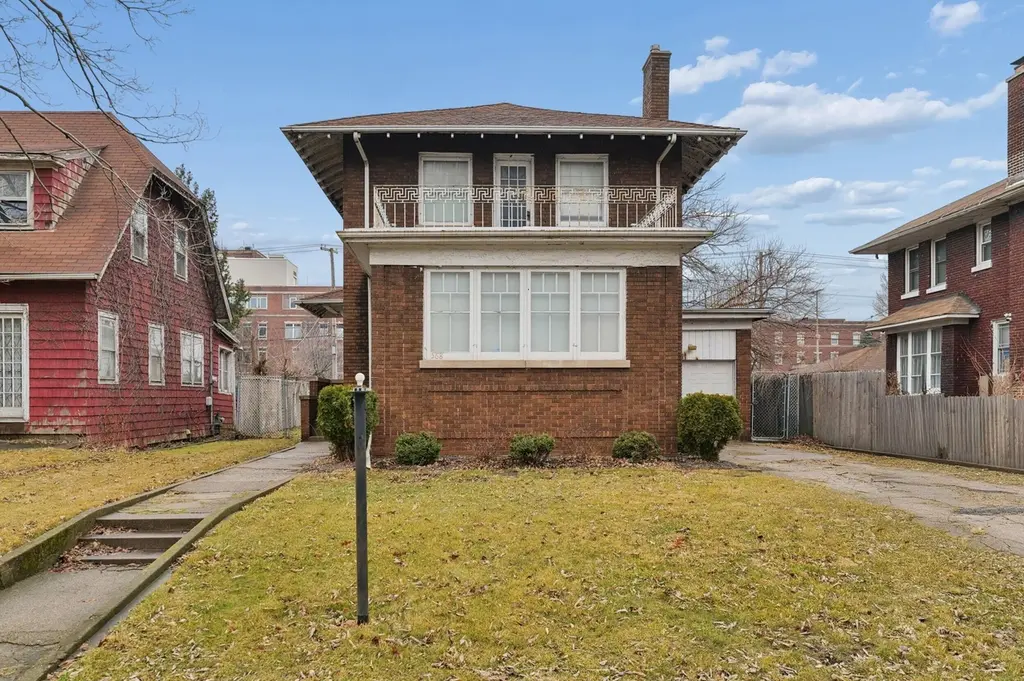
568 Johnson St · Gary, IN
Flood risk 6/10 · Moderate
- FEMA flood zone
- X (unshaded)
- Chance of flooding over 30 yrs
- 0.74%
- Est. flood insurance / yr
- $473 – $860
Fire risk 1/10 · Minimal
- Est. fire insurance / yr
- $717 – $1,331
Heat risk 2/10 · Minimal
- Hot days now (above 102°F)
- 7 days/yr
- Hot days in 30 yrs
- 14 days/yr
Wind risk 2/10 · Minimal
- Chance of severe wind over 30 yrs
- 1.0%
Air-quality risk 4/10 · Minor
- Unhealthy air days now
- 5 days/yr
- Unhealthy air days in 30 yrs
- 6 days/yr
Risk factors via First Street. Map © Google.
Why this score? — see what drove the C grade
The composite is a weighted blend of 9 inputs, each scored 0–100. Each bar is that input's sub-score; the figure is the points it added to the 100-point composite (weight × sub-score).
- Cash flow +22.7/30.0
- ARV discount +13.0/15.0
- DSCR +7.3/10.0
- 1% rule +4.9/10.0
- Livability +3.7/5.0
- Rent growth +2.5/5.0
- Condition / age +2.5/5.0
- Appreciation +1.4/10.0
- Schools +0.5/10.0
$165,000
🖨 Deal sheet (PDF) 📄 Offer letter ✓ Due diligence
Listing remarks MLS
Welcome to 568 Johnson Street, located in the desirable Horace Mann area of Gary. This classic two-story solid brick home is full of character, charm, and opportunity. Inside, you'll find three spacious bedrooms, a cozy fireplace, a formal dining room, and a functional kitchen layout that provides the perfect foundation for both homeowners and investors alike. With its strong structure and great bones, this home is ready for your personal touch to bring out its full potential. The primary bedroom features a private balcony, creating the perfect place to enjoy your morning coffee or unwind in the evening. The basement is nearly completed and ready for your ideas, already featuring a bathroom, making it an ideal space for additional living areas, a recreation room, home office, or guest space. Step outside to enjoy the back deck, perfect for relaxing or entertaining, along with a private driveway providing convenient off-street parking. Location is everything! This home offers close proximity to the hospital, downtown Gary, major highways, and commuter routes, making everyday living simple and convenient. Whether you're searching for your next home or a smart investment opportunity, this property delivers location, character, and value all in one. Schedule your showing
Key facts
- Private driveway
- Private balcony
- Back deck
Tags
Neighborhood map
What this means for you Summary
Snapshot
- This is a 4-bed/1.0-bath single-family listed at $165k.
Deal economics
- At list price, monthly cash flow is $285 ($3k/yr) — positive.
- The deal already cash-flows at list — no discount required.
- To meet the 1% rule (rent ≥ 1% of price), the offer needs to be $163k (0.9% below list).
- Recommended offer: $150k (9.0% below list) — sets the bar for market timing.
Location & tenants
- Location reads 73/100 on livability (#105 in IN) — a middle-class / working-renter tenant base. Strengths: commute A+, cost of living A+, housing A+; Watch: schools F, crime F, employment F.
- Gary Community School Corporation (urban): math 3% / reading 11% proficiency, ranked #299 of 301 in IN (top 99%) — low school quality limits family demand, transient renter base, plan for 1-2y turnover; 80% free/reduced lunch — lower-income household profile, screen leases tightly.
- Market conditions: 47 active listings in the ZIP; 10 comparable units currently listed for rent nearby; rentals leasing fast (median 1d on market — plan ~1-2 weeks tenant-placement turnaround); lower-income renter base — watch delinquency; 1,642 units permitted in Lake County in 2024 (14 in 5+ unit buildings).
- At $1,634/mo this rent would consume 58% of the median local household income ($34k/yr) (locally 336% of renters already pay >50% of income on rent) — very limited rent-growth headroom before tenants either downsize or default.
Forward outlook
- Local home prices are declining (-3.0%/yr); year-one equity from $1k of loan paydown is wiped out by about $5k of value loss. Plan a longer hold.
- Lake County population projected to shrink 7% by 2050 — rents likely to lag national; underwrite the cash flow, not the appreciation.
Negotiation context
- It's been on market 109 days — a 9% lower offer ($150k) is reasonable based on typical stale-listing flexibility.
- 6 sale attempts since 27y ago; this cycle's ask has dropped $30k (15%) from the opening price — seller is motivated, your offer sets the floor, not the list.
Risks & watch-outs
- Watch-outs: built in 1921 — expect roof / HVAC / electrical / plumbing capex.
- Climate carrying-cost: major flood risk — expect insurance premiums to compound above CPI over the hold.
Questions for the listing agent
- It's been on market 109 days. Have you received any prior offers? Is the seller open to a 9% concession, seller financing, or rate buy-down credit?
- Built in 1921 — when were the roof, HVAC, electrical panel, plumbing, and water heater last replaced?
- Why hasn't it sold? Are there any deal-killer items the seller is aware of (foundation, flood, title, zoning, code violations)?
- Is there a deadline driving the sale (1031 exchange, divorce, estate, relocation)? That informs how much negotiation room exists.
- Schools are F-rated, which usually means shorter tenancies and higher turnover. Who's the typical renter profile here, and what's been the actual vacancy rate?
- Crime grade is F in this area — have there been break-ins, vandalism, or insurance claims at this property in the last 3 years? What carrier currently insures it and at what premium?
- What's the average days-on-market for RENTAL listings here right now (not sales)? A rising rental-DOM trend means longer vacancies and softer asking-rent achievability than the comps imply.
- What's the recent tenant-quality profile in this submarket — average credit score on applications, eviction rate, late-payment / NSF rate, and stable-employment percentage? A property-management company in the area should have these aggregated.
- How much new for-sale + rental construction is in the pipeline within 1–3 miles? Heavy new supply typically softens prices + rents 12–24 months out; constrained supply supports both.
Investment metrics
- 1% rule
- 0.99% ✗
- Cap rate
- 8.37%
- Cash-on-cash
- 7.41%
- DSCR
- 1.33
- GRM
- 8.4
CMA / ARV
- ARV (median comp)
- $188,036
- List price
- $165,000
- Delta
- -12.25%
- Verdict
- UNDERPRICED
- Comps
- 20 within 1.0 mi
Show comp detail 12 sales within ~0.75 mi
| Address | Dist | Beds/Ba | Sqft | Sold | Price | $/sf | Match |
|---|---|---|---|---|---|---|---|
| 701 Tyler St | 0.43mi | 4/1.0 | 2,002 (-4%) | 0mo | $94,900 | $47 | 73 |
| 2025 W 4th Pl | 0.37mi | 4/2.5 | 2,124 (+2%) | 4mo | $85,000 | $40 | 70 |
| 851 Johnson St | 0.33mi | 4/2.5 | 1,954 (-6%) | 2mo | $200,000 | $102 | 67 |
| 407 Polk St | 0.41mi | 4/2.5 | 1,991 (-5%) | 2mo | $192,900 | $97 | 65 |
| 419 Cleveland St | 0.35mi | 5/2.0 (+1) | 1,974 (-6%) | 2mo | $250,000 | $127 | 64 |
| 2401 W 6th Ave | 0.57mi | 4/3.0 | 2,134 (+2%) | 1mo | $264,900 | $124 | 61 |
| 329 Pierce St | 0.39mi | 3/1.0 (-1) | 2,288 (+10%) | 0mo | $120,000 | $52 | 61 |
| 817 Fillmore St | 0.41mi | 3/1.0 (-1) | 1,934 (-7%) | 4mo | $45,000 | $23 | 60 |
| 643 Mckinley St | 0.35mi | 4/2.5 | 1,896 (-9%) | 4mo | $148,000 | $78 | 59 |
| 429 Ellsworth St | 0.69mi | 3/2.0 (-1) | 1,952 (-6%) | 4mo | $145,000 | $74 | 45 |
| 1109 W 11th Ave | 0.64mi | 3/1.0 (-1) | 2,382 (+14%) | 1mo | $32,500 | $14 | 41 |
| 2100 W 2nd Ave | 0.62mi | 5/3.5 (+1) | 2,400 (+15%) | 2mo | $235,000 | $98 | 29 |
Match score weights: distance 35% · size 25% · config 20% · recency 20%. Top-matched comps best support the ARV.
Projected returns pro-forma
-3.0% appreciation · 3.0% rent growth · sell at horizon
- IRR
- -5.0%
- Equity multiple
- 0.81×
- Total profit
- $-8,634
- Equity at exit
- $24,602
- IRR
- 4.6%
- Equity multiple
- 1.34×
- Total profit
- $15,633
- Equity at exit
- $14,266
Cash invested: $46,200 (down + closing). Projections, not guarantees.
Landlord ↔ Tenant lean methodology
- Overall (STATE)
- 90 Strongly Landlord-Friendly
- State Indiana
- 90 Strongly Landlord-Friendly · R+11
- County
- — inherits STATE
- City
- — inherits STATE
ZIP-level market 46402
- Home prices YoY
- -2.8%
- Active inventory
- 47
- Price-to-rent
- 8.4×
Monthly cashflow live
- Estimated rent
- $1,634 high interval (Pro) →
- Mortgage (P&I)
- −$865
- Tax from tax record
- −$72 /mo · $864/yr
- Insurance
- −$69
- HOA
- −$0
- Vacancy / Maint / Mgmt
- −$343
- Net cashflow
- $285
Break-even live
Sensitivity live
| Price | -10% $379 | -5% $332 | +0% $285 | +5% $238 | +10% $192 |
|---|---|---|---|---|---|
| Rent | -10% $156 | -5% $221 | +0% $285 | +5% $350 | +10% $414 |
| Rate | -1.0pp $368 | -0.5pp $327 | base $285 | +0.5pp $242 | +1.0pp $199 |
UW: 25.0% down · 7.5% · 30yr · 1.5% tax · 5.0% vac · 8.0% maint · 8.0% mgmt
Financing live
Cash to close
- Down payment
- $41,250
- Closing costs
- $4,950
- Reserves months
- —
- Total cash needed
- —
Loan-product check · same deal, 3 products live
Conventional
25% down · 7.5% · 30yr
- Down + closing
- —
- Monthly P&I
- —
- Monthly cashflow
- —
- DSCR
- —
- Eligible?
- —
Personal DTI + credit; lowest rate.
DSCR
20% down · 8.5% · 30yr
- Down + closing
- —
- Monthly P&I
- —
- Monthly cashflow
- —
- DSCR
- —
- Eligible?
- —
No personal income docs; deal must DSCR.
Hard money
10% down · 12.0% · 12mo
- Down + closing
- —
- Monthly P&I
- —
- Monthly cashflow
- —
- DSCR
- —
- Eligible?
- —
Short-term bridge; refi at stabilization.
Rent comps 10 comps
| Address | Beds | Baths | Sqft | Rent | $/sqft | DOM | Units | Dist |
|---|---|---|---|---|---|---|---|---|
| 765 Garfield St Gary, IN | 3.0 | 1.0 | 1688 | $1,500 | $0.89 | 14d | 1 | 0.27mi |
| 346 Richard Gordon Hatcher Blvd Gary, IN | 5.0 | 3.0 | 2744 | $2,000 | $0.73 | 0d | 1 | 0.31mi |
| 803 Pierce St Gary, IN | 4.0 | 2.0 | 1600 | $1,400 | $0.88 | 2d | 1 | 0.33mi |
| 373 Taft Pl Gary, IN | 4.0 | 2.0 | 1984 | $1,800 | $0.91 | 45d | 1 | 0.60mi |
| 1572 Polk St Gary, IN | 3.0 | 1.0 | 1500 | $1,250 | $0.83 | 0d | 1 | 1.00mi |
| 1744 Tyler St Unit 2 Gary, IN | 4.0 | 2.0 | 1600 | $1,700 | $1.06 | 45d | 1 | 1.11mi |
| 1348 Waite St Gary, IN | 4.0 | 2.0 | 1776 | $1,850 | $1.04 | 0d | 1 | 1.34mi |
| 1368 Waite St Gary, IN | 3.0 | 2.0 | 1696 | $1,800 | $1.06 | 0d | 1 | 1.35mi |
| 1109 Maryland St Unit 1 Gary, IN | 3.0 | 1.5 | 1982 | $1,000 | $0.50 | 0d | 1 | 1.45mi |
| 1109 Maryland St Gary, IN | 3.0 | 1.0 | 1982 | $1,000 | $0.50 | 0d | 1 | 1.45mi |
Listing history 25 events
-
2026-06-21days on market $165,000 Active 109 DOM
-
2026-06-18days on market $165,000 Active 106 DOM
-
2026-06-17days on market $165,000 Active 105 DOM
-
2026-06-16days on market $165,000 Active 104 DOM
-
2026-06-15days on market $165,000 Active 103 DOM
-
2026-06-13days on market $165,000 Active 101 DOM
-
2026-06-13days on market $165,000 Active 100 DOM
-
2026-06-09days on market $165,000 Active 97 DOM
-
2026-06-08days on market $165,000 Active 96 DOM
-
2026-06-07days on market $165,000 Active 95 DOM
-
2026-06-04days on market $165,000 Active 92 DOM
-
2026-06-03days on market $165,000 Active 91 DOM
-
2026-06-02days on market $165,000 Active 90 DOM
-
2026-06-01days on market $165,000 Active 89 DOM
-
2026-05-31days on market $165,000 Active 88 DOM
-
2026-03-23price $179,500 1287-char remark
Show marketing remark (1287 chars)
Welcome to 568 Johnson Street, located in the desirable Horace Mann area of Gary. This classic two-story solid brick home is full of character, charm, and opportunity. Inside, you'll find three spacious bedrooms, a cozy fireplace, a formal dining room, and a functional kitchen layout that provides the perfect foundation for both homeowners and investors alike. With its strong structure and great bones, this home is ready for your personal touch to bring out its full potential. The primary bedroom features a private balcony, creating the perfect place to enjoy your morning coffee or unwind in the evening. The basement is nearly completed and ready for your ideas, already featuring a bathroom, making it an ideal space for additional living areas, a recreation room, home office, or guest space. Step outside to enjoy the back deck, perfect for relaxing or entertaining, along with a private driveway providing convenient off-street parking. Location is everything! This home offers close proximity to the hospital, downtown Gary, major highways, and commuter routes, making everyday living simple and convenient. Whether you're searching for your next home or a smart investment opportunity, this property delivers location, character, and value all in one. Schedule your showing
-
2026-02-27$195,000 Active 1287-char remark
Show marketing remark (1287 chars)
Welcome to 568 Johnson Street, located in the desirable Horace Mann area of Gary. This classic two-story solid brick home is full of character, charm, and opportunity. Inside, you'll find three spacious bedrooms, a cozy fireplace, a formal dining room, and a functional kitchen layout that provides the perfect foundation for both homeowners and investors alike. With its strong structure and great bones, this home is ready for your personal touch to bring out its full potential. The primary bedroom features a private balcony, creating the perfect place to enjoy your morning coffee or unwind in the evening. The basement is nearly completed and ready for your ideas, already featuring a bathroom, making it an ideal space for additional living areas, a recreation room, home office, or guest space. Step outside to enjoy the back deck, perfect for relaxing or entertaining, along with a private driveway providing convenient off-street parking. Location is everything! This home offers close proximity to the hospital, downtown Gary, major highways, and commuter routes, making everyday living simple and convenient. Whether you're searching for your next home or a smart investment opportunity, this property delivers location, character, and value all in one. Schedule your showing
-
2007-01-31historical
-
2006-12-06$75,900
-
2005-12-21historical
-
2005-12-12$87,500
-
2000-08-08$39,900
-
2000-08-07historical
-
2000-04-19$28,500
-
1999-12-29$39,900
ⓘ Source: listings_history table (triggers on properties + properties_extension) + one-shot
backfill from property_details.listing_events for pre-trigger history.
Tax reassessment forecast IN · Partial reset (capped growth)
- Current annual tax
- $864 · $72/mo
- Projected year-2 tax
- $1,133 · $94/mo
- Expected delta
- +$269/yr (+$22/mo · 31.1%)
ⓘ Screening estimate from a state-policy table — verify with the county assessor before closing.
Climate risk First Street
- Flood 6/10 Major FEMA zone X (unshaded) · 74% chance over 30 yrs
- Wildfire 1/10 Low
- Heat 2/10 Low 7 d/yr ≥102°F today · 14 d/yr by 30 yrs out
- Wind 2/10 Low 100% chance of damaging wind over 30 yrs
- Air quality 4/10 Moderate 5 unhealthy d/yr today · 6 by 30 yrs out
Nearby sold comps map
Loading sold comps map…
Walkable amenities ~0.75 mi
Loading nearby amenities…
Taxation est. · year 1
- Rental income
- $19,613
- − Mortgage interest
- −$9,243
- − Property taxes
- −$864
- − Insurance
- −$825
- − Repairs & maintenance
- −$1,569
- − Management
- −$1,569
- − Depreciation
- −$4,800
- Taxable income
- $743
- Est. tax owed @ 24.0%
- −$178
- After-tax cash flow
- $3,243/yr
For passive investors: Depreciation is non-cash, so a rental often shows a tax loss while cash-flowing — sheltering income. Rental losses are passive: they offset passive income freely, and up to $25,000/yr can offset ordinary (W-2) income if you actively participate and your MAGI is under $100k (phasing out to $0 by $150k); unused losses carry forward. On sale, claimed depreciation is recaptured at up to 25%, and gains may owe capital-gains tax (a 1031 exchange can defer both). Figures are a year-1 estimate at your 24.0% rate — not tax advice; consult a CPA.
Schools (NCES district)
- District
- Gary Community School Corporation
- NCES district ID
- 1803870
- Math proficiency
- 3% ▼ -10.00%
- Reading proficiency
- 11% ▼ -6.00%
- Median HH income
- $27,739
- Composite
- 4.98/100
- National rank
- #10039
- State rank
- #299 of 301 in IN
Livability — Gary
- Score
- 73/100
- State rank
- #105
- US rank
- #5592
Category grades
Schools grade is shown separately in the Schools card above.
Census & demographics
- Census place
- Gary, IN
- County
- Lake County · 422,878 people
- City population
- 63,701
- Metro
- Chicago-Naperville-Elgin, IL-IN-WI
- Population (ZIP)
- 5,836
- Household income
- $33,529
- Rent vs Own
- Severe rent burden
- 336.0
Population outlook (Lake County) Hauer SSP2
- Today (2025)
- 484,026 people
- By 2030
- 478,091 · -1.2%
- By 2040
- 462,974 · -4.3%
- By 2050
- 449,894 · -7.1%
- By 2075
- 436,169 · -9.9%
- By 2100
- 426,607 · -11.9%
Race, ethnicity, and origin ACS 2023
- Neighborhood character
- Predominantly Black (87%)
- Race & ethnicity
- Black 87% Two or more races 5% White 5% Hispanic / Latino 4%
- Common ancestry
- Romanian 1% Ukrainian 1%
- Foreign-born
- 1% · Canada
- Languages at home
- 98% English-only · Spanish 1% Arabic 1%
Political lean MEDSL · Lake
- 2024 margin
- Lean D (+5.6) · D 52.1% · R 46.5% · Other 1.5%
- 2008→2024 swing
- -28.6pp toward R · 2008: 34.3pp · 2024: 5.6pp
- All cycles
- 2024: D+5.6 2020: D+15.1 2016: D+20.6 2012: D+31.0 2008: D+34.3
Not yet ingested
- Civics
- —
Market trends
- HPI YoY
- ▼ -7.21%
- Current HPI
- 250.2464
- Rent YoY
- —
- Metro
- Chicago-Naperville-Elgin, IL-IN-WI
- State GDP YoY
- ▲ 2.90%
- F500 in state
- 18
Industry mix (Fortune 500 HQ in IN)
| Industry | F500 HQs | Revenue |
|---|---|---|
| Industrial Machinery | 2 | $37B |
|
||
| Healthcare | 1 | $177B |
|
||
| Pharmaceuticals | 1 | $45B |
|
||
| Metals / Steel | 1 | $18B |
|
||
| Agriculture | 1 | $17B |
|
||
| Packaging | 1 | $12B |
|
||
Price history
+349.9% since first listed10 events — show timeline
- 2026-03-23 Price Changed $179,500 NIRA MLS as Distributed by MLS Grid
- 2026-02-27 Listed $195,000 NIRA MLS as Distributed by MLS Grid
- 2007-01-31 Listing Removed — NIRA MLS as Distributed by MLS Grid
- 2006-12-06 Listed $75,900 NIRA MLS as Distributed by MLS Grid
- 2005-12-21 Listing Removed — NIRA MLS as Distributed by MLS Grid
- 2005-12-12 Listed $87,500 NIRA MLS as Distributed by MLS Grid
- 2000-08-08 Listed $39,900 NIRA MLS as Distributed by MLS Grid
- 2000-08-07 Listing Removed — NIRA MLS as Distributed by MLS Grid
- 2000-04-19 Listed $28,500 NIRA MLS as Distributed by MLS Grid
- 1999-12-29 Listed $39,900 NIRA MLS as Distributed by MLS Grid
Property tax history
-3.9%/yrLatest (2024): $864 · -22.6% YoY. Source: county tax records.
Cash-flow waterfall
monthlySold comps — $/sqft
last 12 mo · ≤1 miLoading sold comps…