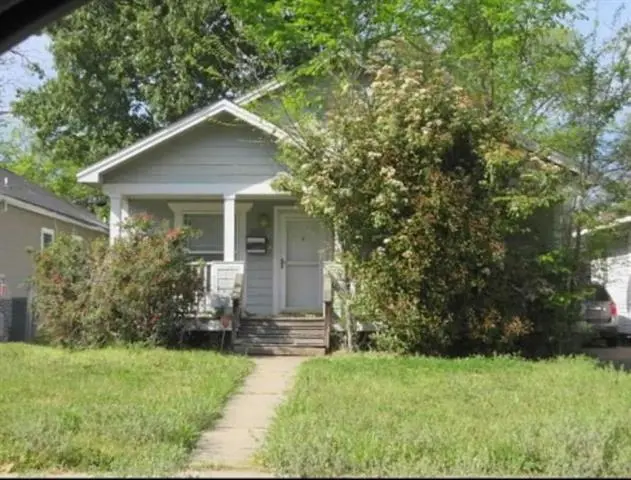
2706 Stonewall St · Shreveport, LA
Flood risk 1/10 · Minimal
- FEMA flood zone
- X (unshaded)
- Chance of flooding over 30 yrs
- 0.0%
- Est. flood insurance / yr
- $507 – $1,088
Fire risk 1/10 · Minimal
- Est. fire insurance / yr
- $1,269 – $2,357
Heat risk 7/10 · Major
- Hot days now (above 110°F)
- 7 days/yr
- Hot days in 30 yrs
- 22 days/yr
Wind risk 6/10 · Moderate
- Chance of severe wind over 30 yrs
- 64.0%
Air-quality risk 2/10 · Minimal
- Unhealthy air days now
- 1 days/yr
- Unhealthy air days in 30 yrs
- 1 days/yr
Risk factors via First Street. Map © Google.
Why this score? — see what drove the C+ grade
The composite is a weighted blend of 9 inputs, each scored 0–100. Each bar is that input's sub-score; the figure is the points it added to the 100-point composite (weight × sub-score).
- Cash flow +30.0/30.0
- 1% rule +10.0/10.0
- DSCR +10.0/10.0
- Appreciation +4.4/10.0
- Livability +3.0/5.0
- Rent growth +2.5/5.0
- Condition / age +2.5/5.0
- Schools +2.2/10.0
- ARV discount +0.0/15.0
$52,800
🖨 Deal sheet 📄 Offer letter ✓ Due diligence
Listing remarks
This ranch style single family home offers 3 bedrooms and 2 bathrooms with approximately 1525 square feet of living space on a 0.12 acre lot. The foreclosure deed has been recorded, allowing for shorter closing timelines. No Buyer Premium on this property. It is a criminal offense to trespass on this property. The buyer has the right to select their own title and closing company or may use the sellers title and closing company. The buyer is responsible for all closing costs in this transaction. Offers to be placed on Xome.com. Interior inspections are not available. Do not trespass! Forward all inquiries and questions to Xome Customer Service (800) 758-8052. NO REPRESENTATION TO VALIDITY OF
Key facts
- 4,791 sq ft lot
- Built 2007
- Listed 37 days
Property features AI
Exterior
- Home design: Single Family Residence
- Construction: Frame construction; Other construction material
- Exterior features: Composition roof
Interior
- Bedrooms: Bedroom 1; Bedroom 2; Bedroom 3
- Bathrooms: 2 full bathrooms
- Heating & cooling: Has heating (type: Other); Has cooling (type: Other)
- Interior features: Living Room; Kitchen
Neighborhood map
What this means for you Summary
Snapshot
- This is a 3-bed/2.0-bath single-family listed at $53k.
Deal economics
- At list price, monthly cash flow is $370 ($4k/yr) — positive.
- The deal already cash-flows at list — no discount required.
- Meets the 1% rule at list price ($983 rent vs $53k).
- Recommended offer: $51k (3.0% below list) — sets the bar for market timing.
- Cap rate 14.7% vs local median 5.7% in Shreveport — top-decile yield for the area; either an underpriced asset or a hidden risk that comps aren't pricing in. Stress-test before assuming the spread holds.
Location & tenants
- Location reads 59/100 on livability (#270 in LA) — a working-class tenant base; expect higher turnover. Strengths: cost of living A+, housing A; Watch: schools D+, crime F, amenities F.
- Caddo Parish (urban): math 21% / reading 32% proficiency, ranked #53 of 98 in LA (top 54%) — low school quality limits family demand, transient renter base, plan for 1-2y turnover; 64% free/reduced lunch — lower-income household profile, screen leases tightly.
- Market conditions: 123 active listings in the ZIP; 17 comparable units currently listed for rent nearby; rentals at typical pace (median 22d on market — plan ~3-4 weeks tenant-placement turnaround); lower-income renter base — watch delinquency; 221 units permitted in Caddo Parish in 2024 (0 in 5+ unit buildings).
- This rent runs 36% of the median local income ($33k/yr) — at the standard rent-burdened threshold; future hikes will face affordability resistance.
Forward outlook
- Local home prices are declining (-1.2%/yr); year-one equity from $365 of loan paydown is wiped out by about $623 of value loss. Plan a longer hold.
- Caddo County population projected at -15% by 2050 — secular population decline; favor cash flow + early exit over multi-decade hold.
- At projected returns (-1.2% appreciation + 3.0% rent growth), your $15k cash investment doubles in ~4 years — after that, you're playing with house money.
Negotiation context
- It's been on market 37 days — a 3% lower offer ($51k) is reasonable based on typical stale-listing flexibility.
Risks & watch-outs
- Climate carrying-cost: major wind risk, 64% chance of damaging wind over 30y; extreme-heat days projected 7→22/yr by 2055 (HVAC capex compounding) — expect insurance premiums to compound above CPI over the hold.
Questions for the listing agent
- It's been on market 37 days. Have you received any prior offers? Is the seller open to a 3% concession, seller financing, or rate buy-down credit?
- Is there a deadline driving the sale (1031 exchange, divorce, estate, relocation)? That informs how much negotiation room exists.
- Schools are D-rated, which usually means shorter tenancies and higher turnover. Who's the typical renter profile here, and what's been the actual vacancy rate?
- Crime grade is F in this area — have there been break-ins, vandalism, or insurance claims at this property in the last 3 years? What carrier currently insures it and at what premium?
- What's the average days-on-market for RENTAL listings here right now (not sales)? A rising rental-DOM trend means longer vacancies and softer asking-rent achievability than the comps imply.
- What's the recent tenant-quality profile in this submarket — average credit score on applications, eviction rate, late-payment / NSF rate, and stable-employment percentage? A property-management company in the area should have these aggregated.
- How much new for-sale + rental construction is in the pipeline within 1–3 miles? Heavy new supply typically softens prices + rents 12–24 months out; constrained supply supports both.
Investment metrics
- 1% rule
- 1.86% ✓
- Cap rate
- 14.71%
- Cash-on-cash
- 30.05%
- DSCR
- 2.34
- GRM
- 4.5
CMA / ARV
- ARV (median comp)
- $38,386
- List price
- $52,800
- Delta
- 37.55%
- Verdict
- OVERPRICED
- Comps
- 20 within 1.0 mi
Show comp detail 12 sales within ~0.75 mi
| Address | Dist | Beds/Ba | Sqft | Sold | Price | $/sf | Match |
|---|---|---|---|---|---|---|---|
| 2828 Darien St | 0.17mi | 2/2.0 (-1) | 1,435 (-8%) | 5mo | $18,000 | $13 | 70 |
| 2828 Jackson St | 0.49mi | 3/2.0 | 1,620 (+4%) | 4mo | $15,000 | $9 | 66 |
| 2900 Lakeshore Dr | 0.31mi | 3/2.0 | 1,557 (+0%) | 23mo | $56,000 | $36 | 66 |
| 2515 Stonewall St | 0.16mi | 3/1.0 | 1,364 (-12%) | 5mo | $38,900 | $29 | 64 |
| 3124 Stonewall St | 0.41mi | 4/2.0 (+1) | 1,479 (-5%) | 7mo | $34,999 | $24 | 62 |
| 2919 Lillian St | 0.28mi | 2/1.0 (-1) | 1,494 (-4%) | 15mo | $14,900 | $10 | 59 |
| 2532 Lillian St | 0.22mi | 4/1.0 (+1) | 1,387 (-11%) | 6mo | $32,000 | $23 | 58 |
| 3221 Jackson St | 0.71mi | 3/2.0 | 1,518 (-2%) | 9mo | $74,000 | $49 | 56 |
| 3242 Penick St | 0.67mi | 3/2.0 | 1,440 (-7%) | 17mo | $58,000 | $40 | 43 |
| 2506 Stonewall St | 0.17mi | 2/1.0 (-1) | 1,354 (-13%) | 24mo | $25,000 | $18 | 42 |
| 3240 Penick St | 0.68mi | 3/1.0 | 1,680 (+8%) | 19mo | $43,000 | $26 | 35 |
| 2427 Corol St | 0.65mi | 2/1.0 (-1) | 1,402 (-10%) | 21mo | $40,000 | $29 | 27 |
Match score weights: distance 35% · size 25% · config 20% · recency 20%. Top-matched comps best support the ARV.
Projected returns pro-forma
-1.18% appreciation · 3.0% rent growth · sell at horizon
- IRR
- 28.4%
- Equity multiple
- 2.30×
- Total profit
- $19,217
- Equity at exit
- $12,288
- IRR
- 33.5%
- Equity multiple
- 4.46×
- Total profit
- $51,125
- Equity at exit
- $12,517
Cash invested: $14,784 (down + closing). Projections, not guarantees.
Landlord ↔ Tenant lean methodology
- Overall (STATE)
- 90 Strongly Landlord-Friendly
- State Louisiana
- 90 Strongly Landlord-Friendly · R+12
- County
- — inherits STATE
- City
- — inherits STATE
ZIP-level market 71109
- Home prices YoY
- -2.1%
- Active inventory
- 123
- Price-to-rent
- 4.5×
Monthly cashflow live
- Estimated rent
- $983 high interval (Pro) →
- Mortgage (P&I)
- −$277
- Tax from tax record
- −$107 /mo · $1,289/yr
- Insurance
- −$22
- HOA
- −$0
- Vacancy / Maint / Mgmt
- −$206
- Net cashflow
- $370
Break-even live
Sensitivity live
| Price | -10% $400 | -5% $385 | +0% $370 | +5% $355 | +10% $340 |
|---|---|---|---|---|---|
| Rent | -10% $293 | -5% $331 | +0% $370 | +5% $409 | +10% $448 |
| Rate | -1.0pp $397 | -0.5pp $384 | base $370 | +0.5pp $357 | +1.0pp $343 |
UW: 25.0% down · 7.5% · 30yr · 1.5% tax · 5.0% vac · 8.0% maint · 8.0% mgmt
Financing live
Cash to close
- Down payment
- $13,200
- Closing costs
- $1,584
- Reserves months
- —
- Total cash needed
- —
Loan-product check · same deal, 3 products live
Conventional
25% down · 7.5% · 30yr
- Down + closing
- —
- Monthly P&I
- —
- Monthly cashflow
- —
- DSCR
- —
- Eligible?
- —
Personal DTI + credit; lowest rate.
DSCR
20% down · 8.5% · 30yr
- Down + closing
- —
- Monthly P&I
- —
- Monthly cashflow
- —
- DSCR
- —
- Eligible?
- —
No personal income docs; deal must DSCR.
Hard money
10% down · 12.0% · 12mo
- Down + closing
- —
- Monthly P&I
- —
- Monthly cashflow
- —
- DSCR
- —
- Eligible?
- —
Short-term bridge; refi at stabilization.
Rent comps 17 comps
| Address | Beds | Baths | Sqft | Rent | $/sqft | DOM | Units | Dist |
|---|---|---|---|---|---|---|---|---|
| 2401 Darien St Shreveport, LA | 3.0 | 2.0 | 2000 | $1,500 | $0.75 | 14d | 1 | 0.30mi |
| 3022 Lillian St Shreveport, LA | 2.0 | 1.0 | 1115 | $695 | $0.62 | 21d | 1 | 0.33mi |
| 3323 Darien St Shreveport, LA | 3.0 | 1.0 | 1200 | $785 | $0.65 | 44d | 1 | 0.58mi |
| 2042 Laurel St Shreveport, LA | 3.0 | 1.0 | 1100 | $800 | $0.73 | 44d | 1 | 0.61mi |
| 3420 Darien St Shreveport, LA | 2.0 | 1.0 | 1200 | $665 | $0.55 | 14d | 1 | 0.65mi |
| 2134 Queens Hwy Shreveport, LA | 3.0 | 1.5 | 1374 | $1,475 | $1.07 | 21d | 1 | 0.73mi |
| 2222 Carleton St Shreveport, LA | 3.0 | 2.0 | 1800 | $750 | $0.42 | 14d | 1 | 0.81mi |
| 1719 Lakeshore Dr Shreveport, LA | 3.0 | 1.5 | 1200 | $950 | $0.79 | 44d | 1 | 0.82mi |
| 2551 Claiborne Ave Shreveport, LA | 2.0 | 1.5 | 1202 | $945 | $0.79 | 14d | 1 | 0.85mi |
| 3612 Michigan Blvd Shreveport, LA | 2.0 | 1.0 | 1200 | $615 | $0.51 | 14d | 1 | 0.96mi |
| 2711 Thayer St Shreveport, LA | 4.0 | 1.0 | 1436 | $1,552 | $1.08 | 44d | 1 | 1.24mi |
| 3907 Milton St Shreveport, LA | 3.0 | 1.5 | 1275 | $1,100 | $0.86 | 44d | 1 | 1.25mi |
| 4223 Lakeshore Dr Shreveport, LA | 1.0–3.0 | 1.0–2.0 | 1002 | $900 | $0.90 | 44d | 1 | 1.37mi |
| 1353 Glen Oak Pl Shreveport, LA | 2.0 | 1.0 | 1116 | $800 | $0.72 | 14d | 1 | 1.40mi |
| 1353 Glen Oak Pl Shreveport, LA | 2.0 | 1.0 | 1116 | $850 | $0.76 | 21d | 1 | 1.40mi |
| 2531 Drexel St Shreveport, LA | 3.0 | 2.0 | 1250 | $950 | $0.76 | 21d | 1 | 1.47mi |
| 2811 Samford Ave Shreveport, LA | 3.0 | 1.0 | 1612 | $850 | $0.53 | 14d | 1 | 1.48mi |
Listing history 20 events
-
2026-06-18days on market $52,800 Active 37 DOM
-
2026-06-17days on market $52,800 Active 36 DOM
-
2026-06-16days on market $52,800 Active 35 DOM
-
2026-06-15days on market $52,800 Active 34 DOM
-
2026-06-14days on market $52,800 Active 32 DOM
-
2026-06-13days on market $52,800 Active 31 DOM
-
2026-06-10days on market $52,800 Active 29 DOM
-
2026-06-09days on market $52,800 Active 28 DOM
-
2026-06-08days on market $52,800 Active 27 DOM
-
2026-06-07days on market $52,800 Active 26 DOM
-
2026-06-05days on market $52,800 Active 23 DOM
-
2026-06-03days on market $52,800 Active 22 DOM
-
2026-06-02days on market $52,800 Active 21 DOM
-
2026-06-01days on market $52,800 Active 20 DOM
-
2026-05-31days on market $52,800 Active 19 DOM
-
2026-05-30days on market $52,800 Active 18 DOM
-
2026-05-11$52,800 Active 759-char remark
-
2017-05-03soldstatus $74,000
-
2010-01-04soldstatus $81,000
-
2002-03-21soldstatus
ⓘ Source: listings_history table (triggers on properties + properties_extension) + one-shot
backfill from property_details.listing_events for pre-trigger history.
Tax reassessment forecast LA · Resets to sale price
- Current annual tax
- $1,289 · $107/mo
- Projected year-2 tax
- $1,289 · $107/mo
- Expected delta
- $0/yr ($0/mo · 0.0%)
ⓘ Screening estimate from a state-policy table — verify with the county assessor before closing.
Climate risk First Street
- Flood 1/10 Low FEMA zone X (unshaded) · 0% chance over 30 yrs
- Wildfire 1/10 Low
- Heat 7/10 Severe 7 d/yr ≥110°F today · 22 d/yr by 30 yrs out
- Wind 6/10 Major 64% chance of damaging wind over 30 yrs
- Air quality 2/10 Low 1 unhealthy d/yr today · 1 by 30 yrs out
Nearby sold comps map
Loading sold comps map…
Walkable amenities ~0.75 mi
Loading nearby amenities…
Taxation est. · year 1
- Rental income
- $11,796
- − Mortgage interest
- −$2,958
- − Property taxes
- −$1,289
- − Insurance
- −$264
- − Repairs & maintenance
- −$944
- − Management
- −$944
- − Depreciation
- −$1,536
- Taxable income
- $3,862
- Est. tax owed @ 24.0%
- −$927
- After-tax cash flow
- $3,516/yr
For passive investors: Depreciation is non-cash, so a rental often shows a tax loss while cash-flowing — sheltering income. Rental losses are passive: they offset passive income freely, and up to $25,000/yr can offset ordinary (W-2) income if you actively participate and your MAGI is under $100k (phasing out to $0 by $150k); unused losses carry forward. On sale, claimed depreciation is recaptured at up to 25%, and gains may owe capital-gains tax (a 1031 exchange can defer both). Figures are a year-1 estimate at your 24.0% rate — not tax advice; consult a CPA.
Schools (NCES district)
- District
- Caddo Parish
- NCES district ID
- 2200300
- Math proficiency
- 21% ▼ -33.00%
- Reading proficiency
- 32% ▼ -30.00%
- Median HH income
- $39,227
- Composite
- 22.23/100
- National rank
- #8148
- State rank
- #53 of 98 in LA
Livability — Shreveport
- Score
- 59/100
- State rank
- #270
- US rank
- #19730
Category grades
Schools grade is shown separately in the Schools card above.
Census & demographics
- Census place
- Shreveport, LA
- County
- Caddo Parish · 178,536 people
- City population
- 164,123
- Metro
- Shreveport-Bossier City, LA
- Population (ZIP)
- 17,412
- Household income
- $32,939
- Rent vs Own
- Severe rent burden
- 1265.0
Population outlook (Caddo County) Hauer SSP2
- Today (2025)
- 243,190 people
- By 2030
- 237,231 · -2.5%
- By 2040
- 222,502 · -8.5%
- By 2050
- 206,516 · -15.1%
- By 2075
- 165,706 · -31.9%
- By 2100
- 122,262 · -49.7%
Race, ethnicity, and origin ACS 2023
- Neighborhood character
- Predominantly Black (95%)
- Race & ethnicity
- Black 95% White 4%
- Common ancestry
- Lithuanian 1%
- Foreign-born
- 0%
Political lean MEDSL · Caddo
- 2024 margin
- Toss-up / Even · D 51.6% · R 47.0% · Other 1.4%
- 2008→2024 swing
- +1.6pp toward D · 2008: 3.0pp · 2024: 4.6pp
- All cycles
- 2024: D+4.6 2020: D+6.8 2016: D+4.2 2012: D+4.9 2008: D+3.0
Not yet ingested
- Civics
- —
Market trends
- HPI YoY
- ▼ -1.18%
- Current HPI
- 54.4158
- Rent YoY
- —
- Metro
- Shreveport-Bossier City, LA
- State GDP YoY
- ▲ 3.29%
- F500 in state
- 10
Industry mix (Fortune 500 HQ in LA)
| Industry | F500 HQs | Revenue |
|---|---|---|
| Telecommunications | 2 | $23B |
|
||
| Utilities | 1 | $12B |
|
||
| Wholesale / Distribution | 1 | $5B |
|
||
| Advertising | 1 | $2B |
|
||
Price history
-34.8% since first listed4 events — show timeline
- 2026-05-11 Listed $52,800 AcadianaMLS
- 2017-05-03 Sold (Public Records) $74,000 Public Records
- 2010-01-04 Sold (Public Records) $81,000 Public Records
- 2002-03-21 Sold (Public Records) — Public Records
Property tax history
+5.7%/yrLatest (2025): $1,289 · +0.4% YoY. Source: county tax records.
Cash-flow waterfall
monthlySold comps — $/sqft
last 12 mo · ≤1 miLoading sold comps…