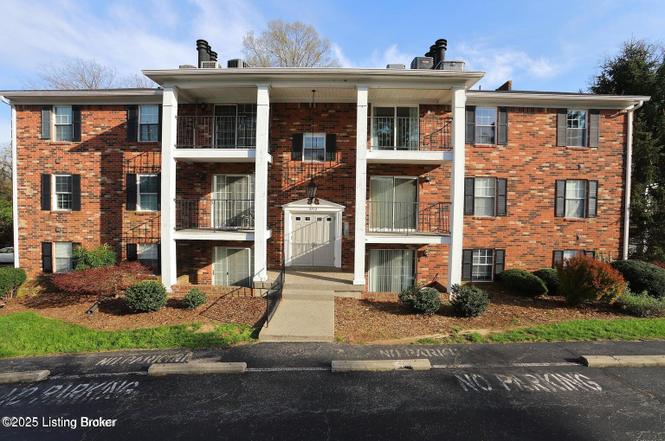
3312 Colonial Manor Cir Unit 6A · Louisville, KY
Flood risk 6/10 · Moderate
- FEMA flood zone
- X (unshaded)
- Chance of flooding over 30 yrs
- 0.75%
- Est. flood insurance / yr
- $507 – $1,088
Fire risk 1/10 · Minimal
- Est. fire insurance / yr
- $839 – $1,559
Heat risk 5/10 · Moderate
- Hot days now (above 105°F)
- 7 days/yr
- Hot days in 30 yrs
- 20 days/yr
Wind risk 2/10 · Minimal
- Chance of severe wind over 30 yrs
- 2.0%
Air-quality risk 3/10 · Minor
- Unhealthy air days now
- 3 days/yr
- Unhealthy air days in 30 yrs
- 5 days/yr
Risk factors via First Street. Map © Google.
Why this score? — see what drove the C grade
The composite is a weighted blend of 9 inputs, each scored 0–100. Each bar is that input's sub-score; the figure is the points it added to the 100-point composite (weight × sub-score).
- Cash flow +23.3/30.0
- 1% rule +8.2/10.0
- DSCR +7.5/10.0
- ARV discount +7.5/15.0
- Livability +3.2/5.0
- Condition / age +2.5/5.0
- Schools +2.3/10.0
- Rent growth +1.6/5.0
- Appreciation +0.0/10.0
$120,000
🖨 Deal sheet 📄 Offer letter ✓ Due diligence
Listing remarks MLS
Welcome home! This is an updated third floor condo with 2 beds 2 full baths. Living room with gas fireplace, dining area Plenty of space for small family with walk-in closet, living room, gas fireplace, dining area. Come check it out for yourself. Not FHA approved. No Rentals.
Key facts
- Walk-in closet
- In-unit laundry
- Elevated view
Tags
Property features AI
Finance
- Other: Part of a 6-unit building with 3 building floors; Subdivision: COLONIAL HILL MANOR
- HOA & community: Association fee (HOA) applicable
Exterior
- Parking: Surface parking
- Security: Secured building
- Utilities: Electricity connected; 1 HVAC unit
- Home design: Condominium; Top-left location in the building; 1 story; Built in 1984
- Construction: Brick construction; Shingle roof; Building 3312; Above-grade finished area: 887; Building area total reported as 887
- Exterior features: Surface parking; Entry at front
Interior
- Kitchen: Kitchen located on the first floor
- Bedrooms: 2 bedrooms, both on the first floor; Primary bedroom on the first floor
- Bathrooms: 2 full bathrooms, primary bathroom on the first floor; First-floor full bathroom
- Heating & cooling: Electric heating; Central air conditioning
- Interior features: No basement; Total of 6 rooms
- Laundry & utility: First-floor laundry
Neighborhood map
What this means for you Summary
Snapshot
- This is a 2-bed/2.0-bath condo listed at $120k.
Deal economics
- At list price, monthly cash flow is $220 ($3k/yr) — positive.
- The deal already cash-flows at list — no discount required.
- Meets the 1% rule at list price ($2k rent vs $120k).
- Recommended offer: $106k (12.0% below list) — sets the bar for market timing.
- Cap rate 8.5% vs local median 5.0% in Louisville — top-decile yield for the area; either an underpriced asset or a hidden risk that comps aren't pricing in. Stress-test before assuming the spread holds.
Location & tenants
- Location reads 63/100 on livability (#333 in KY) — a middle-class / working-renter tenant base. Strengths: cost of living A+, housing A+; Watch: employment C-, health & safety D+, schools D-.
- Jefferson County (urban): math 19% / reading 35% proficiency, ranked #121 of 165 in KY (top 73%) — low school quality limits family demand, transient renter base, plan for 1-2y turnover.
- Market conditions: Rents falling (-3.5%/yr); 100 active listings in the ZIP; 6 comparable units currently listed for rent nearby; rentals at typical pace (median 16d on market — plan ~3-4 weeks tenant-placement turnaround); 2,836 units permitted in Jefferson County in 2024 (1,558 in 5+ unit buildings).
- This rent runs 32% of the median local income ($59k/yr) — at the standard rent-burdened threshold; future hikes will face affordability resistance.
Forward outlook
- Local home prices are declining (-3.0%/yr); year-one equity from $830 of loan paydown is wiped out by about $4k of value loss. Plan a longer hold.
- Jefferson County population projected at +13% by 2050 — modest demand growth; plan on rents tracking national, not racing it.
Negotiation context
- It's been on market 168 days — a 12% lower offer ($106k) is reasonable based on typical stale-listing flexibility.
- 7 sale attempts since 12y ago with the ask held roughly flat each time — persistent listings suggest the price (not the market) is what's stuck; bring a comps-based counter.
- Current owner paid $100k; 20% above their basis — modest negotiation headroom, anchor on the comps not their cost.
Risks & watch-outs
- Climate carrying-cost: major flood risk; extreme-heat days projected 7→20/yr by 2055 (HVAC capex compounding) — expect insurance premiums to compound above CPI over the hold.
Questions for the listing agent
- It's been on market 168 days. Have you received any prior offers? Is the seller open to a 12% concession, seller financing, or rate buy-down credit?
- What does the HOA fee cover, when was the last increase, and are there any pending special assessments or reserve-fund shortfalls?
- Any open or pending special assessments — roof, HVAC, plumbing, elevator, façade? What's the per-unit balance and payoff schedule, and is the seller paying it off at close or rolling it to the buyer?
- Why hasn't it sold? Are there any deal-killer items the seller is aware of (foundation, flood, title, zoning, code violations)?
- Is there a deadline driving the sale (1031 exchange, divorce, estate, relocation)? That informs how much negotiation room exists.
- Schools are D-rated, which usually means shorter tenancies and higher turnover. Who's the typical renter profile here, and what's been the actual vacancy rate?
- Crime grade is F in this area — have there been break-ins, vandalism, or insurance claims at this property in the last 3 years? What carrier currently insures it and at what premium?
- What's the average days-on-market for RENTAL listings here right now (not sales)? A rising rental-DOM trend means longer vacancies and softer asking-rent achievability than the comps imply.
- What's the recent tenant-quality profile in this submarket — average credit score on applications, eviction rate, late-payment / NSF rate, and stable-employment percentage? A property-management company in the area should have these aggregated.
- How much new apartment / multifamily construction is in the pipeline within 1–3 miles? Heavy new supply (>2% of stock underway) typically softens rents 12–24 months out; light construction supports rent growth.
Investment metrics
- 1% rule
- 1.32% ✓
- Cap rate
- 8.49%
- Cash-on-cash
- 7.85%
- DSCR
- 1.35
- GRM
- 6.3
CMA / ARV
No comps found within radius.
Projected returns pro-forma
-3.0% appreciation · 0.0% rent growth · sell at horizon
- IRR
- -8.3%
- Equity multiple
- 0.70×
- Total profit
- $-9,943
- Equity at exit
- $17,892
- IRR
- -4.3%
- Equity multiple
- 0.76×
- Total profit
- $-7,995
- Equity at exit
- $10,375
Cash invested: $33,600 (down + closing). Projections, not guarantees.
Landlord ↔ Tenant lean methodology
- Overall (STATE)
- 83 Strongly Landlord-Friendly
- State Kentucky
- 83 Strongly Landlord-Friendly · R+16
- County
- — inherits STATE
- City
- — inherits STATE
ZIP-level market 40218
- Rents YoY
- -3.5%
- Active inventory
- 100
- Price-to-rent
- 6.3×
Monthly cashflow live
- Estimated rent
- $1,588 high interval (Pro) →
- Mortgage (P&I)
- −$629
- Tax from tax record
- −$105 /mo · $1,260/yr
- Insurance
- −$50
- HOA
- −$250
- Vacancy / Maint / Mgmt
- −$333
- Net cashflow
- $220
Break-even live
UW: 25.0% down · 7.5% · 30yr · 1.5% tax · 5.0% vac · 8.0% maint · 8.0% mgmt
Financing live
Cash to close
- Down payment
- $30,000
- Closing costs
- $3,600
- Reserves months
- —
- Total cash needed
- —
Loan-product check · same deal, 3 products live
Conventional
25% down · 7.5% · 30yr
- Down + closing
- —
- Monthly P&I
- —
- Monthly cashflow
- —
- DSCR
- —
- Eligible?
- —
Personal DTI + credit; lowest rate.
DSCR
20% down · 8.5% · 30yr
- Down + closing
- —
- Monthly P&I
- —
- Monthly cashflow
- —
- DSCR
- —
- Eligible?
- —
No personal income docs; deal must DSCR.
Hard money
10% down · 12.0% · 12mo
- Down + closing
- —
- Monthly P&I
- —
- Monthly cashflow
- —
- DSCR
- —
- Eligible?
- —
Short-term bridge; refi at stabilization.
Rent comps 6 comps
| Address | Beds | Baths | Sqft | Rent | $/sqft | DOM | Units | Dist |
|---|---|---|---|---|---|---|---|---|
| 3101 Sunny Ln Unit 4 Louisville, KY | 2.0 | 2.0 | 1300 | $1,450 | $1.12 | 15d | 1 | 0.39mi |
| 2153 Goldsmith Ln Louisville, KY | 1.0–3.0 | 1.0–2.0 | 950 | $1,062 | $1.12 | 3d | 10 | 0.62mi |
| 3013 Wellbrooke Rd Louisville, KY | 3.0 | 2.0 | 1936 | $2,250 | $1.16 | 3d | 1 | 0.82mi |
| 3013 Wellbrooke Rd Louisville, KY | 3.0 | 2.0 | 1936 | $2,250 | $1.16 | 11d | 1 | 0.82mi |
| 3552 Lisbon Ln Louisville, KY | 3.0 | 1.0 | 1964 | $1,895 | $0.96 | 23d | 1 | 1.19mi |
| 2526 Gardiner Ln Louisville, KY | 3.0 | 1.0 | 1400 | $1,700 | $1.21 | 15d | 1 | 1.26mi |
HOA detail condo
- Monthly dues
- $250 · $3,000/yr
- Likely covers
- gas
- Assessments
- None detected in remarks — confirm with the listing agent.
Listing history 21 events
-
2026-05-03status Pending
-
2026-05-01status Active
-
2026-04-30status Pending
-
2025-11-15$120,000 Active
-
2025-11-01historical $1,500
-
2025-07-31$1,500
-
2023-05-19soldstatus $100,000 Closed 279-char remark
Show marketing remark (279 chars)
Welcome home! This is an updated third floor condo with 2 beds 2 full baths. Living room with gas fireplace, dining area Plenty of space for small family with walk-in closet, living room, gas fireplace, dining area. Come check it out for yourself. Not FHA approved. No Rentals.
-
2023-05-19soldstatus $100,000
Show marketing remark (279 chars)
Welcome home! This is an updated third floor condo with 2 beds 2 full baths. Living room with gas fireplace, dining area Plenty of space for small family with walk-in closet, living room, gas fireplace, dining area. Come check it out for yourself. Not FHA approved. No Rentals.
-
2023-04-06status Pending 279-char remark
Show marketing remark (279 chars)
Welcome home! This is an updated third floor condo with 2 beds 2 full baths. Living room with gas fireplace, dining area Plenty of space for small family with walk-in closet, living room, gas fireplace, dining area. Come check it out for yourself. Not FHA approved. No Rentals.
-
2023-03-30$115,000 Active 279-char remark
Show marketing remark (279 chars)
Welcome home! This is an updated third floor condo with 2 beds 2 full baths. Living room with gas fireplace, dining area Plenty of space for small family with walk-in closet, living room, gas fireplace, dining area. Come check it out for yourself. Not FHA approved. No Rentals.
-
2022-09-27historical
-
2022-09-21$115,000 Active
-
2021-02-19soldstatus $84,500 Closed
-
2021-02-19soldstatus $84,500
-
2021-01-19historical Active Under Contract
-
2021-01-02$84,900 Active
-
2021-01-02price $84,900
-
2014-12-08soldstatus $45,000
-
2014-11-20historical
-
2014-11-17soldstatus $45,000
-
2014-05-22$49,000
ⓘ Source: listings_history table (triggers on properties + properties_extension) + one-shot
backfill from property_details.listing_events for pre-trigger history.
Tax reassessment forecast KY · Resets to sale price
- Current annual tax
- $1,260 · $105/mo
- Projected year-2 tax
- $1,260 · $105/mo
- Expected delta
- $0/yr ($0/mo · 0.0%)
ⓘ Screening estimate from a state-policy table — verify with the county assessor before closing.
Climate risk First Street
- Flood 6/10 Major FEMA zone X (unshaded) · 75% chance over 30 yrs
- Wildfire 1/10 Low
- Heat 5/10 Major 7 d/yr ≥105°F today · 20 d/yr by 30 yrs out
- Wind 2/10 Low 2% chance of damaging wind over 30 yrs
- Air quality 3/10 Moderate 3 unhealthy d/yr today · 5 by 30 yrs out
Nearby sold comps map
Loading sold comps map…
Walkable amenities ~0.75 mi
Loading nearby amenities…
Taxation est. · year 1
- Rental income
- $19,051
- − Mortgage interest
- −$6,722
- − Property taxes
- −$1,260
- − Insurance
- −$600
- − Repairs & maintenance
- −$1,524
- − Management
- −$1,524
- − HOA
- −$3,000
- − Depreciation
- −$3,491
- Taxable income
- $930
- Est. tax owed @ 24.0%
- −$223
- After-tax cash flow
- $2,416/yr
For passive investors: Depreciation is non-cash, so a rental often shows a tax loss while cash-flowing — sheltering income. Rental losses are passive: they offset passive income freely, and up to $25,000/yr can offset ordinary (W-2) income if you actively participate and your MAGI is under $100k (phasing out to $0 by $150k); unused losses carry forward. On sale, claimed depreciation is recaptured at up to 25%, and gains may owe capital-gains tax (a 1031 exchange can defer both). Figures are a year-1 estimate at your 24.0% rate — not tax advice; consult a CPA.
Schools (NCES district)
- District
- Jefferson County
- NCES district ID
- 2102990
- Math proficiency
- 19% ▼ -17.00%
- Reading proficiency
- 35% ▼ -11.00%
- Median HH income
- $47,885
- Composite
- 23.45/100
- National rank
- #7884
- State rank
- #121 of 165 in KY
Livability — Louisville
- Score
- 63/100
- State rank
- #333
- US rank
- #15887
Category grades
Schools grade is shown separately in the Schools card above.
Census & demographics
- Census place
- Louisville, KY
- County
- Jefferson County · 790,184 people
- City population
- 769,292
- Metro
- Louisville/Jefferson County, KY-IN
- Population (ZIP)
- 33,736
- Household income
- $58,811
- Rent vs Own
- Severe rent burden
- 1590.0
Population outlook (Jefferson County) Hauer SSP2
- Today (2025)
- 823,112 people
- By 2030
- 849,343 · +3.2%
- By 2040
- 895,696 · +8.8%
- By 2050
- 933,630 · +13.4%
- By 2075
- 1,028,262 · +24.9%
- By 2100
- 1,072,675 · +30.3%
Race, ethnicity, and origin ACS 2023
- Neighborhood character
- Diverse neighborhood (Simpson 0.69)
- Race & ethnicity
- White 42% Black 32% Hispanic / Latino 17% Two or more races 16% Asian 4%
- Hispanic origin (detail)
- Mexican 5% Puerto Rican 1% Cuban 7%
- Common ancestry
- Lithuanian 1% Portuguese 1% Swiss 1%
- Foreign-born
- 20% · Canada, India, Jamaica
- Languages at home
- 77% English-only · Spanish 12% Other Indo-European 3% Arabic 1%
Political lean MEDSL · Jefferson
- 2024 margin
- D (+16.6) · D 57.4% · R 40.9% · Other 1.7%
- 2008→2024 swing
- +4.5pp toward D · 2008: 12.0pp · 2024: 16.6pp
- All cycles
- 2024: D+16.6 2020: D+20.1 2016: D+13.3 2012: D+11.1 2008: D+12.0
Not yet ingested
- Civics
- —
Market trends
- HPI YoY
- ▼ -208.23%
- Current HPI
- 257.9528
- Rent YoY
- ▼ -3.47%
- Metro
- Louisville/Jefferson County, KY-IN
- State GDP YoY
- ▲ 1.81%
- F500 in state
- 4
Industry mix (Fortune 500 HQ in KY)
| Industry | F500 HQs | Revenue |
|---|---|---|
| Healthcare | 1 | $118B |
|
||
| Food / Beverage | 1 | $7B |
|
||
Price history
+144.9% since first listed21 events — show timeline
- 2026-05-03 Pending — Metro Search MLS
- 2026-05-01 Relisted — Metro Search MLS
- 2026-04-30 Pending — Metro Search MLS
- 2025-11-15 Listed $120,000 Metro Search MLS
- 2025-11-01 Rental Removed $1,500 MSMLS
- 2025-07-31 Listed for Rent $1,500 MSMLS
- 2023-05-19 Sold (Public Records) $100,000 Public Records
- 2023-05-19 Sold (MLS) $100,000 Metro Search MLS
- 2023-04-06 Pending — Metro Search MLS
- 2023-03-30 Listed $115,000 Metro Search MLS
- 2022-09-27 Listing Removed — Metro Search MLS
- 2022-09-21 Listed $115,000 Metro Search MLS
- 2021-02-19 Sold (Public Records) $84,500 Public Records
- 2021-02-19 Sold (MLS) $84,500 Metro Search MLS
- 2021-01-19 Contingent — Metro Search MLS
- 2021-01-02 Price Changed $84,900 Metro Search MLS
- 2021-01-02 Listed $84,900 Metro Search MLS
- 2014-12-08 Sold (Public Records) $45,000 Public Records
- 2014-11-20 Listing Removed — Metro Search MLS
- 2014-11-17 Sold (MLS) $45,000 Metro Search MLS
- 2014-05-22 Listed $49,000 Metro Search MLS
Property tax history
+16.1%/yrLatest (2025): $1,260 · -1.9% YoY. Source: county tax records.
Cash-flow waterfall
monthlySold comps — $/sqft
last 12 mo · ≤1 miLoading sold comps…