36 Wooded Ln · Goldendale, WA
Flood risk 1/10 · Minimal
- FEMA flood zone
- X
- Chance of flooding over 30 yrs
- 0.0%
- Est. flood insurance / yr
- $507 – $1,088
Fire risk 10/10 · Severe
- Est. fire insurance / yr
- $604 – $1,122
Heat risk 3/10 · Minor
- Hot days now (above 92°F)
- 7 days/yr
- Hot days in 30 yrs
- 15 days/yr
Wind risk 1/10 · Minimal
- Chance of severe wind over 30 yrs
- —
Air-quality risk 8/10 · Major
- Unhealthy air days now
- 10 days/yr
- Unhealthy air days in 30 yrs
- 10 days/yr
Risk factors via First Street. Map © Google.
Why this score? — see what drove the D grade
The composite is a weighted blend of 9 inputs, each scored 0–100. Each bar is that input's sub-score; the figure is the points it added to the 100-point composite (weight × sub-score).
- Cash flow +13.1/30.0
- ARV discount +7.5/15.0
- 1% rule +4.2/10.0
- DSCR +3.9/10.0
- Schools +3.7/10.0
- Livability +3.4/5.0
- Rent growth +2.5/5.0
- Condition / age +2.5/5.0
- Appreciation +0.0/10.0
$160,000
🖨 Deal sheet (PDF) 📄 Offer letter ✓ Due diligence
Listing remarks MLS
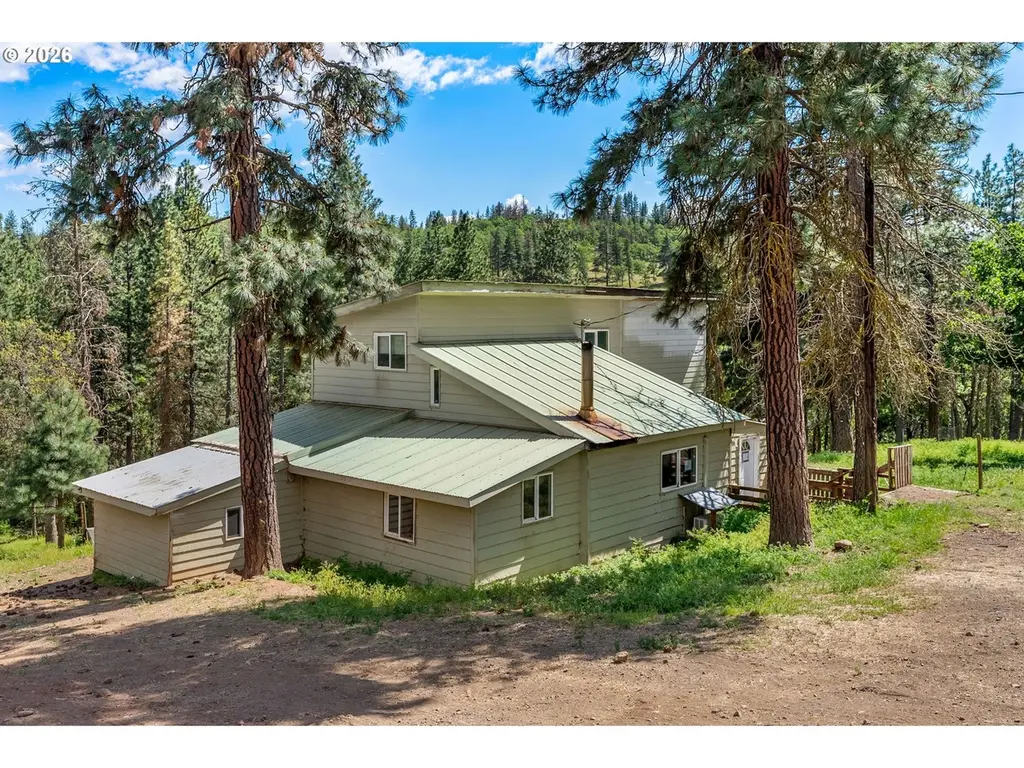
In a private country setting this 1286 Sq Ft, 3 Br 2 Ba home sits on 20 acres fully fenced and located within minutes of downtown Goldendale. With updates made throughout, this home is ready for the next family to take ownership. Updates include double pane windows throughout the home, ductless heat pump, new insulation, new paint job, remodeled kitchen and bathrooms, and a newly built shop. This home is priced well and ready to sell.
Key facts
- Wood flooring
- Seasonal pond
- Flowing creek
Tags
Property features AI
Finance
- Other: Parcel number 04170600001000
- HOA & community: Not a senior community; Zoned GR-5
Exterior
- Utilities: Well water; Standard septic system; Electric service (fuel for hot water and listed as fuel source)
- Home design: Single-family residence, detached; Approximately 1,286 total building area; Main level and upper level (upper level area ~378, main level area ~908); Built in 1985; Property faces territorial and pond views
- Construction: Metal roof; Cement siding construction; Built in 1985
- Exterior features: Cement siding; Pond on property; Private setting; Trees and wooded acreage; Approximately 20 acres
Interior
- Kitchen: Kitchen
- Bedrooms: Primary bedroom (main level); Second bedroom (main level); Third bedroom (upper level)
- Bathrooms: Two full bathrooms (one on main level, one on upper level)
- Heating & cooling: No central heating listed; other heating type noted; No cooling listed
- Interior features: Dining room; Family room; Living room; Great room; Open territorial and pond views with trees/woods
- Laundry & utility: Electric hot water
Neighborhood map
What this means for you Summary
Snapshot
- This is a 3-bed/2.0-bath single-family listed at $160k.
Deal economics
- At list price, monthly cash flow is $-5 ($-57/yr) — negative.
- To cash-flow at today's rent, offer at most $159k (0.5% below list).
- To meet the 1% rule (rent ≥ 1% of price), the offer needs to be $147k (8.3% below list).
- Recommended offer: $147k (8.3% below list) — sets the bar for 1% rule.
- Cap rate 6.3% vs local median 2.4% in Goldendale — top-decile yield for the area; either an underpriced asset or a hidden risk that comps aren't pricing in. Stress-test before assuming the spread holds.
Location & tenants
- Location reads 67/100 on livability (#295 in WA) — a middle-class / working-renter tenant base. Strengths: cost of living A+, housing A+, health & safety A+; Watch: amenities F, commute F, employment F.
- Goldendale School District (town): math 35% / reading 49% proficiency, ranked #213 of 291 in WA (top 73%) — families likely to look elsewhere, expect single-tenant / working-renter base with shorter leases.
- Zoned schools: Goldendale Primary School (291 students, 71% FRL); Goldendale Middle School (262 students, 78% FRL); Goldendale High School (299 students, 63% FRL) — zoned schools average 71% FRL vs 51% district-wide (19 pts higher); higher-poverty schools than district average — tighter screening recommended.
- Market conditions: 254 active listings in the ZIP; 80 units permitted in Klickitat County in 2024 (0 in 5+ unit buildings).
Forward outlook
- Local home prices are declining (-3.0%/yr); year-one equity from $1k of loan paydown is wiped out by about $5k of value loss. Plan a longer hold.
- Klickitat County population projected at +6% by 2050 — modest demand growth; plan on rents tracking national, not racing it.
Negotiation context
- Only 11 days on market — expect competitive offers; lowballing is unlikely to land.
- 3 sale attempts since 17y ago with the ask held roughly flat each time — persistent listings suggest the price (not the market) is what's stuck; bring a comps-based counter.
Risks & watch-outs
- Climate carrying-cost: severe wildfire risk — expect insurance premiums to compound above CPI over the hold.
Questions for the listing agent
- What do current leases actually rent for vs. the listed asking? Can we see a recent rent roll and the last 12 months of T-12 income?
- Is there a deadline driving the sale (1031 exchange, divorce, estate, relocation)? That informs how much negotiation room exists.
- The area grade is low — what's the realistic commute time and amenity access for the typical tenant pool here? Any planned neighborhood developments (good or bad) we should know about?
- What's the average days-on-market for RENTAL listings here right now (not sales)? A rising rental-DOM trend means longer vacancies and softer asking-rent achievability than the comps imply.
- What's the recent tenant-quality profile in this submarket — average credit score on applications, eviction rate, late-payment / NSF rate, and stable-employment percentage? A property-management company in the area should have these aggregated.
- How much new for-sale + rental construction is in the pipeline within 1–3 miles? Heavy new supply typically softens prices + rents 12–24 months out; constrained supply supports both.
Investment metrics
- 1% rule
- 0.92% ✗
- Cap rate
- 6.26%
- Cash-on-cash
- -0.13%
- DSCR
- 0.99
- GRM
- 9.1
CMA / ARV
No comps found within radius.
Projected returns pro-forma
-3.0% appreciation · 3.0% rent growth · sell at horizon
- IRR
- -16.5%
- Equity multiple
- 0.42×
- Total profit
- $-26,171
- Equity at exit
- $23,857
- IRR
- -8.2%
- Equity multiple
- 0.49×
- Total profit
- $-22,944
- Equity at exit
- $13,834
Cash invested: $44,800 (down + closing). Projections, not guarantees.
Landlord ↔ Tenant lean methodology
- Overall (STATE)
- 28 Tenant-Leaning
- State Washington
- 28 Tenant-Leaning · D+8
- County
- — inherits STATE
- City
- — inherits STATE
ZIP-level market 98620
- Active inventory
- 254
- Price-to-rent
- 9.1×
Monthly cashflow live
- Estimated rent
- $1,467 medium interval (Pro) →
- Mortgage (P&I)
- −$839
- Tax from tax record
- −$258 /mo · $3,095/yr
- Insurance
- −$67
- HOA
- −$0
- Vacancy / Maint / Mgmt
- −$308
- Net cashflow
- $-5
Break-even live
Sensitivity live
| Price | -10% $86 | -5% $41 | +0% $-5 | +5% $-50 | +10% $-95 |
|---|---|---|---|---|---|
| Rent | -10% $-121 | -5% $-63 | +0% $-5 | +5% $53 | +10% $111 |
| Rate | -1.0pp $76 | -0.5pp $36 | base $-5 | +0.5pp $-46 | +1.0pp $-88 |
UW: 25.0% down · 7.5% · 30yr · 1.5% tax · 5.0% vac · 8.0% maint · 8.0% mgmt
Financing live
Cash to close
- Down payment
- $40,000
- Closing costs
- $4,800
- Reserves months
- —
- Total cash needed
- —
Loan-product check · same deal, 3 products live
Conventional
25% down · 7.5% · 30yr
- Down + closing
- —
- Monthly P&I
- —
- Monthly cashflow
- —
- DSCR
- —
- Eligible?
- —
Personal DTI + credit; lowest rate.
DSCR
20% down · 8.5% · 30yr
- Down + closing
- —
- Monthly P&I
- —
- Monthly cashflow
- —
- DSCR
- —
- Eligible?
- —
No personal income docs; deal must DSCR.
Hard money
10% down · 12.0% · 12mo
- Down + closing
- —
- Monthly P&I
- —
- Monthly cashflow
- —
- DSCR
- —
- Eligible?
- —
Short-term bridge; refi at stabilization.
Listing history 8 events
-
2026-06-12statusdays on market $160,000 Pending 11 DOM
-
2026-06-09days on market $160,000 Active 8 DOM
-
2026-06-08days on market $160,000 Active 7 DOM
-
2026-06-08days on market $160,000 Active 6 DOM
-
2026-06-07days on market $160,000 Active 5 DOM
-
2026-06-03days on market $160,000 Active 2 DOM
-
2026-06-02remarks 590-char remark
-
2026-06-02$160,000 Active 1 DOM
ⓘ Source: listings_history table (triggers on properties + properties_extension) + one-shot
backfill from property_details.listing_events for pre-trigger history.
Tax reassessment forecast WA · Resets to sale price
- Current annual tax
- $3,095 · $258/mo
- Projected year-2 tax
- $3,095 · $258/mo
- Expected delta
- $0/yr ($0/mo · 0.0%)
ⓘ Screening estimate from a state-policy table — verify with the county assessor before closing.
Climate risk First Street
- Flood 1/10 Low FEMA zone X · 0% chance over 30 yrs
- Wildfire 10/10 Extreme
- Heat 3/10 Moderate 7 d/yr ≥92°F today · 15 d/yr by 30 yrs out
- Wind 1/10 Low
- Air quality 8/10 Severe 10 unhealthy d/yr today · 10 by 30 yrs out
Nearby sold comps map
Loading sold comps map…
Walkable amenities ~0.75 mi
Loading nearby amenities…
Taxation est. · year 1
- Rental income
- $17,603
- − Mortgage interest
- −$8,962
- − Property taxes
- −$3,095
- − Insurance
- −$800
- − Repairs & maintenance
- −$1,408
- − Management
- −$1,408
- − Depreciation
- −$4,655
- Taxable loss
- −$2,725
- Est. tax savings @ 24.0%
- +$654
- After-tax cash flow
- $597/yr
For passive investors: Depreciation is non-cash, so a rental often shows a tax loss while cash-flowing — sheltering income. Rental losses are passive: they offset passive income freely, and up to $25,000/yr can offset ordinary (W-2) income if you actively participate and your MAGI is under $100k (phasing out to $0 by $150k); unused losses carry forward. On sale, claimed depreciation is recaptured at up to 25%, and gains may owe capital-gains tax (a 1031 exchange can defer both). Figures are a year-1 estimate at your 24.0% rate — not tax advice; consult a CPA.
Schools (NCES district)
- District
- Goldendale School District
- NCES district ID
- 5303090
- Math proficiency
- 35% ▼ -1.00%
- Reading proficiency
- 49% ▼ -1.00%
- Median HH income
- $37,859
- Composite
- 37.31/100
- National rank
- #8952
- State rank
- #213 of 291 in WA
Livability — Goldendale
- Score
- 67/100
- State rank
- #295
- US rank
- #10293
Category grades
Schools grade is shown separately in the Schools card above.
Census & demographics
- Population (ZIP)
- 7,617
Population outlook (Klickitat County) Hauer SSP2
- Today (2025)
- 22,337 people
- By 2030
- 22,829 · +2.2%
- By 2040
- 23,382 · +4.7%
- By 2050
- 23,654 · +5.9%
- By 2075
- 24,266 · +8.6%
- By 2100
- 23,782 · +6.5%
Race, ethnicity, and origin ACS 2023
- Neighborhood character
- Predominantly White (86%)
- Race & ethnicity
- White 86% Hispanic / Latino 6% Two or more races 4% Native American 3%
- Hispanic origin (detail)
- Mexican 2%
- Common ancestry
- Portuguese 4% Italian 4% Lithuanian 4%
- Foreign-born
- 4% · Canada
- Languages at home
- 97% English-only · Spanish 2%
Political lean MEDSL · Klickitat
- 2024 margin
- Lean R (+9.3) · D 43.7% · R 53.1% · Other 3.2%
- 2008→2024 swing
- -9.5pp toward R · 2008: 0.2pp · 2024: -9.3pp
- All cycles
- 2024: R+9.3 2020: R+9.4 2016: R+16.3 2012: R+7.8 2008: D+0.2
Not yet ingested
- Civics
- —
Market trends
- HPI YoY
- ▼ -164.36%
- Current HPI
- 210.0159
- Rent YoY
- —
- Metro
- —
- State GDP YoY
- ▲ 4.65%
- F500 in state
- 22
Industry mix (Fortune 500 HQ in WA)
| Industry | F500 HQs | Revenue |
|---|---|---|
| Retail | 2 | $269B |
|
||
| Technology / Retail | 1 | $638B |
|
||
| Technology | 1 | $245B |
|
||
| Telecommunications | 1 | $38B |
|
||
| Food / Beverage | 1 | $36B |
|
||
| Automotive / Trucks | 1 | $34B |
|
||
Price history
+34.5% since first listed9 events — show timeline
- 2026-06-01 Listed $160,000 RMLS
- 2017-11-30 Sold (Public Records) $235,000 Public Records
- 2017-11-30 Sold (MLS) $235,000 RMLS
- 2017-10-04 Pending — RMLS
- 2017-09-15 Price Changed $239,000 RMLS
- 2017-09-01 Listed $245,000 RMLS
- 2009-12-07 Sold (MLS) $119,000 RMLS
- 2009-10-09 Delisted — RMLS
- 2009-08-14 Listed $119,000 RMLS
Property tax history
+15.1%/yrLatest (2026): $3,095 · +10.0% YoY. Source: county tax records.
Cash-flow waterfall
monthlySold comps — $/sqft
last 12 mo · ≤1 miLoading sold comps…