5298 NW 4th Ter · Deerfield Beach, FL
Flood risk 3/10 · Minor
- FEMA flood zone
- AH
- Chance of flooding over 30 yrs
- 0.2%
- Est. flood insurance / yr
- $1,142 – $2,507
Fire risk 1/10 · Minimal
- Est. fire insurance / yr
- $947 – $1,759
Heat risk 9/10 · Severe
- Hot days now (above 107°F)
- 7 days/yr
- Hot days in 30 yrs
- 26 days/yr
Wind risk 10/10 · Severe
- Chance of severe wind over 30 yrs
- 99.0%
Air-quality risk 2/10 · Minimal
- Unhealthy air days now
- 1 days/yr
- Unhealthy air days in 30 yrs
- 3 days/yr
Risk factors via First Street. Map © Google.
Why this score? — see what drove the B grade
The composite is a weighted blend of 9 inputs, each scored 0–100. Each bar is that input's sub-score; the figure is the points it added to the 100-point composite (weight × sub-score).
- Cash flow +27.9/30.0
- ARV discount +15.0/15.0
- DSCR +9.9/10.0
- 1% rule +8.8/10.0
- Schools +4.1/10.0
- Livability +3.8/5.0
- Rent growth +2.9/5.0
- Condition / age +2.5/5.0
- Appreciation +0.0/10.0
$195,000
🖨 Deal sheet 📄 Offer letter ✓ Due diligence
Listing remarks
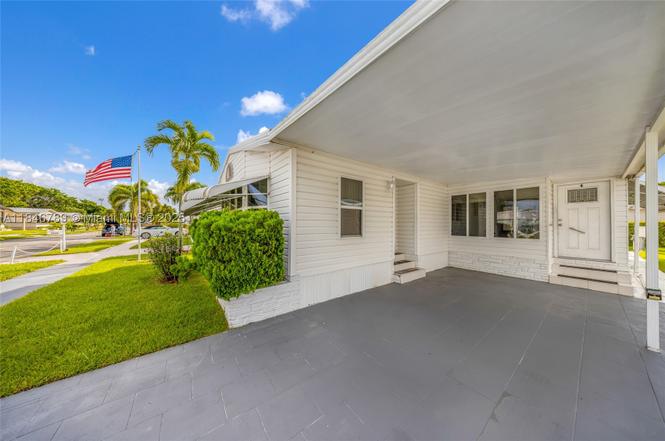
CHARMING NANUFACTURED HOME IN 55+ GATED COMMUNITY, 2/2 OPEN FLOOR PLAN, MINT CONDITIONS OWN THE LAND, (NO LOT FEES) COVERED CARPORT WITH SITTING AREA IN FRONT, BACK PATIO WITH BBQ SETUP AND SHED. VERY QUIET COMMUNITY, WITH MANICURED GARDENS AND A CLUBHOUSE, HEATED POOLS, TENNIS COURT AND SHUFFLEBAORD COURTS. LOW HOA. EQUAL HOUSING OPPORTUNIY.
Key facts
- Gated community
- Open floor plan
- Covered carport
Tags
Property features AI
Finance
- Other: Lot has sprinkler system; Less than quarter acre lot
- Financial info: Pets allowed with restrictions (conditional)
- HOA & community: Quarterly association fee ($350); Association covers common area maintenance, recreation facilities, security and trash; Gated community; Clubhouse; Maintained community; Tennis courts
Exterior
- Parking: Attached carport; Driveway; 2 covered spaces (carport)
- Security: Security gate
- Utilities: Public water; Public sewer
- Home design: Single-story; Manufactured home; Faces northeast
- Construction: Fuqua Homes manufactured model; Aluminum roof; Resale
- Exterior features: Porch; Open porch; Lighting; Community pool
Interior
- Kitchen: Dishwasher; Electric range; Disposal; Refrigerator; Electric water heater
- Bedrooms: Bedroom on main level; Florida room
- Flooring: Carpet; Hardwood; Tile; Wood
- Bathrooms: 2 full bathrooms
- Heating & cooling: Central air (cooling)
- Interior features: Built-in features; Living/dining room; First floor entry
- Laundry & utility: Dryer
Neighborhood map
What this means for you Summary
Snapshot
- This is a 2-bed/2.0-bath manufactured listed at $195k.
Deal economics
- At list price, monthly cash flow is $450 ($5k/yr) — positive.
- The deal already cash-flows at list — no discount required.
- Meets the 1% rule at list price ($3k rent vs $195k).
- Recommended offer: $172k (12.0% below list) — sets the bar for market timing.
- Cap rate 10.0% vs local median 4.2% in Deerfield Beach — top-decile yield for the area; either an underpriced asset or a hidden risk that comps aren't pricing in. Stress-test before assuming the spread holds.
Location & tenants
- Location reads 75/100 on livability (#250 in FL, #3,970 nationally) — a middle-class / working-renter tenant base. Strengths: housing A+, health & safety A+, cost of living A; Watch: schools D-, amenities D-, employment D-.
- Broward (suburban): math 42% / reading 53% proficiency, ranked #46 of 73 in FL (top 63%) — families likely to look elsewhere, expect single-tenant / working-renter base with shorter leases.
- Market conditions: Rents rising (+1.8%/yr); 591 active listings in the ZIP; 40 comparable units currently listed for rent nearby; rentals at typical pace (median 24d on market — plan ~3-4 weeks tenant-placement turnaround); 2,111 units permitted in Broward County in 2024 (1,265 in 5+ unit buildings).
- At $2,685/mo this rent would consume 45% of the median local household income ($71k/yr) (locally 2907% of renters already pay >50% of income on rent) — very limited rent-growth headroom before tenants either downsize or default.
Forward outlook
- Local home prices are declining (-3.0%/yr); year-one equity from $1k of loan paydown is wiped out by about $6k of value loss. Plan a longer hold.
- Broward County population projected at +34% by 2050 — long-run rental-demand tailwind backs the buy-and-hold thesis.
Negotiation context
- It's been on market 329 days — a 12% lower offer ($172k) is reasonable based on typical stale-listing flexibility.
- 2 sale attempts; this cycle's ask has dropped $20k (9%) from the opening price — seller is motivated, your offer sets the floor, not the list.
- Current owner paid $155k; 26% above their basis — modest negotiation headroom, anchor on the comps not their cost.
Risks & watch-outs
- Watch-outs: flood insurance adds $152/mo.
- Climate carrying-cost: in FEMA flood zone AH (mandatory federal flood insurance); severe wind risk, 99% chance of damaging wind over 30y; extreme-heat days projected 7→26/yr by 2055 (HVAC capex compounding) — expect insurance premiums to compound above CPI over the hold.
Questions for the listing agent
- It's been on market 329 days. Have you received any prior offers? Is the seller open to a 12% concession, seller financing, or rate buy-down credit?
- What's the actual annual flood-insurance premium (NFIP or private), and is the property in a SFHA with mandatory coverage?
- What does the HOA fee cover, when was the last increase, and are there any pending special assessments or reserve-fund shortfalls?
- Why hasn't it sold? Are there any deal-killer items the seller is aware of (foundation, flood, title, zoning, code violations)?
- Is there a deadline driving the sale (1031 exchange, divorce, estate, relocation)? That informs how much negotiation room exists.
- Schools are D-rated, which usually means shorter tenancies and higher turnover. Who's the typical renter profile here, and what's been the actual vacancy rate?
- What's the average days-on-market for RENTAL listings here right now (not sales)? A rising rental-DOM trend means longer vacancies and softer asking-rent achievability than the comps imply.
- What's the recent tenant-quality profile in this submarket — average credit score on applications, eviction rate, late-payment / NSF rate, and stable-employment percentage? A property-management company in the area should have these aggregated.
- How much new for-sale + rental construction is in the pipeline within 1–3 miles? Heavy new supply typically softens prices + rents 12–24 months out; constrained supply supports both.
Investment metrics
- 1% rule
- 1.38% ✓
- Cap rate
- 10.00%
- Cash-on-cash
- 13.23%
- DSCR
- 1.59
- GRM
- 6.1
CMA / ARV
- ARV (on-the-fly)
- $318,780
- Comps found
- 1
Show comp detail 1 sale within ~0.75 mi
| Address | Dist | Beds/Ba | Sqft | Sold | Price | $/sf | Match |
|---|---|---|---|---|---|---|---|
| 126 NW 51st St | 0.31mi | 2/2.0 | 1,389 (-14%) | 23mo | $275,000 | $198 | 44 |
Match score weights: distance 35% · size 25% · config 20% · recency 20%. Top-matched comps best support the ARV.
Projected returns pro-forma
-3.0% appreciation · 1.75% rent growth · sell at horizon
- IRR
- -3.0%
- Equity multiple
- 0.89×
- Total profit
- $-6,033
- Equity at exit
- $29,075
- IRR
- 5.1%
- Equity multiple
- 1.35×
- Total profit
- $19,280
- Equity at exit
- $16,860
Cash invested: $54,600 (down + closing). Projections, not guarantees.
Landlord ↔ Tenant lean methodology
- Overall (STATE)
- 87 Strongly Landlord-Friendly
- State Florida
- 87 Strongly Landlord-Friendly · R+3
- County
- — inherits STATE
- City
- — inherits STATE
ZIP-level market 33064
- Home prices YoY
- -18.7%
- Rents YoY
- 1.8%
- Active inventory
- 591
- Price-to-rent
- 6.1×
Monthly cashflow live
- Estimated rent
- $2,685 high interval (Pro) →
- Mortgage (P&I)
- −$1,023
- Tax from tax record
- −$298 /mo · $3,576/yr
- Insurance
- −$81
- Flood insurance flood zone
- −$152 /mo · $1,824/yr
- HOA
- −$117
- Vacancy / Maint / Mgmt
- −$564
- Net cashflow
- $450
Break-even live
UW: 25.0% down · 7.5% · 30yr · 1.5% tax · 5.0% vac · 8.0% maint · 8.0% mgmt
Financing live
Cash to close
- Down payment
- $48,750
- Closing costs
- $5,850
- Reserves months
- —
- Total cash needed
- —
Loan-product check · same deal, 3 products live
Conventional
25% down · 7.5% · 30yr
- Down + closing
- —
- Monthly P&I
- —
- Monthly cashflow
- —
- DSCR
- —
- Eligible?
- —
Personal DTI + credit; lowest rate.
DSCR
20% down · 8.5% · 30yr
- Down + closing
- —
- Monthly P&I
- —
- Monthly cashflow
- —
- DSCR
- —
- Eligible?
- —
No personal income docs; deal must DSCR.
Hard money
10% down · 12.0% · 12mo
- Down + closing
- —
- Monthly P&I
- —
- Monthly cashflow
- —
- DSCR
- —
- Eligible?
- —
Short-term bridge; refi at stabilization.
Rent comps 40 comps
| Address | Beds | Baths | Sqft | Rent | $/sqft | DOM | Units | Dist |
|---|---|---|---|---|---|---|---|---|
| 1929 SW 15th St #41 Deerfield Beach, FL | 2.0 | 2.0 | 1150 | $2,400 | $2.09 | 24d | 1 | 0.19mi |
| 2067 SW 15th St Deerfield Beach, FL | 2.0 | 2.0 | 1150 | $2,300 | $2.00 | 20d | 2 | 0.29mi |
| 1234 S Military Trl #1811 Deerfield Beach, FL | 2.0 | 2.0 | 1099 | $2,500 | $2.27 | 24d | 1 | 0.37mi |
| 2297 SW 15th St #122 Deerfield Beach, FL | 2.0 | 2.0 | 1200 | $2,200 | $1.83 | 12d | 1 | 0.38mi |
| 1947 Discovery Cir E Deerfield Beach, FL | 2.0 | 2.0 | 1126 | $2,450 | $2.18 | 24d | 1 | 0.39mi |
| 1266 S Military Trl Deerfield Beach, FL | 1.0–2.0 | 1.0–2.0 | 1050 | $2,550 | $2.43 | 22d | 2 | 0.41mi |
| 2265 SW 15th St #165 Deerfield Beach, FL | 3.0 | 2.0 | 1350 | $2,400 | $1.78 | 24d | 1 | 0.41mi |
| 2246 Discovery Cir W Deerfield Beach, FL | 2.0 | 2.5 | 1300 | $2,650 | $2.04 | 24d | 1 | 0.45mi |
| 2355 SW 15th St Deerfield Beach, FL | 2.0 | 2.0 | 1100 | $2,098 | $1.91 | 24d | 2 | 0.48mi |
| 1100 S Military Trl Deerfield Beach, FL | 2.0–3.0 | 1.0–2.0 | 1119 | $2,250 | $2.01 | 24d | 2 | 0.48mi |
| 2217 Discovery Cir W Deerfield Beach, FL | 2.0 | 2.5 | 1429 | $2,400 | $1.68 | 15d | 1 | 0.49mi |
| 2149 Discovery Cir W Unit 1 Deerfield Beach, FL | 2.0 | 2.5 | 1300 | $2,850 | $2.19 | 22d | 1 | 0.50mi |
| 2173 Discovery Cir W Deerfield Beach, FL | 2.0 | 2.0 | 1126 | $2,950 | $2.62 | 3d | 1 | 0.54mi |
| 1398 SW 24th Ter Deerfield Beach, FL | 3.0 | 2.0 | 1865 | $5,000 | $2.68 | 24d | 1 | 0.56mi |
| 4905 NE 2nd Way Pompano Beach, FL | 2.0 | 1.0 | 1100 | $2,150 | $1.95 | 24d | 1 | 0.58mi |
| 4503 NW 6th Ave Deerfield Beach, FL | 3.0 | 2.0 | 1148 | $2,850 | $2.48 | 24d | 1 | 0.64mi |
| 5161 NW 11th Ln Deerfield Beach, FL | 3.0 | 2.0 | 1486 | $2,925 | $1.97 | 24d | 1 | 0.70mi |
| 265 NE 46th St Deerfield Beach, FL | 2.0 | 1.0 | 1335 | $2,250 | $1.69 | 17d | 1 | 0.72mi |
| 5140 NW 11th Dr Deerfield Beach, FL | 3.0 | 2.0 | 1324 | $3,000 | $2.27 | 14d | 1 | 0.72mi |
| 378 NE 47th Pl #378 Pompano Beach, FL | 3.0 | 2.5 | 1457 | $3,000 | $2.06 | 24d | 1 | 0.78mi |
| 220 NW 43rd Ct Deerfield Beach, FL | 3.0 | 2.0 | 1458 | $2,700 | $1.85 | 15d | 1 | 0.79mi |
| 2776 SW 15th St Deerfield Beach, FL | 2.0 | 2.5 | 1236 | $2,900 | $2.35 | 24d | 1 | 0.80mi |
| 831 SW 14th Ct Deerfield Beach, FL | 3.0 | 2.0 | 1056 | $2,850 | $2.70 | 24d | 1 | 0.80mi |
| 1361 SW 26th Ave Deerfield Beach, FL | 3.0 | 2.0 | 1932 | $3,850 | $1.99 | 17d | 1 | 0.82mi |
| 4313 NW 6th Ave Deerfield Beach, FL | 3.0 | 2.0 | 1348 | $2,850 | $2.11 | 22d | 1 | 0.82mi |
| 220 NW 43rd St Deerfield Beach, FL | 3.0 | 2.0 | 1458 | $2,800 | $1.92 | 24d | 1 | 0.84mi |
| 4332 NW 1st Ter Deerfield Beach, FL | 3.0 | 2.0 | 1095 | $3,000 | $2.74 | 5d | 1 | 0.85mi |
| 4332 NW 1st Ter Deerfield Beach, FL | 3.0 | 2.0 | 1095 | $3,000 | $2.74 | 24d | 1 | 0.85mi |
| 540 NW 43rd St Deerfield Beach, FL | 2.0 | 2.0 | 1150 | $2,500 | $2.17 | 18d | 1 | 0.86mi |
| 562 Parsons Way Deerfield Beach, FL | 3.0 | 2.5 | 1888 | $4,400 | $2.33 | 10d | 1 | 0.86mi |
| 550 Parsons Way Deerfield Beach, FL | 3.0 | 2.5 | 1883 | $4,100 | $2.18 | 15d | 1 | 0.89mi |
| 550 Parsons Way Deerfield Beach, FL | 3.0 | 2.5 | 1883 | $4,100 | $2.18 | 17d | 1 | 0.89mi |
| 2826 SW 12th St Deerfield Beach, FL | 2.0 | 2.5 | 1236 | $2,600 | $2.10 | 4d | 1 | 0.91mi |
| 4314 NW 9th Ave Deerfield Beach, FL | 1.0–2.0 | 1.5–2.0 | 992 | $1,940 | $1.95 | 15d | 2 | 0.93mi |
| 4344 NW 9th Ave Unit 10-2B Pompano Beach, FL | 2.0 | 2.0 | 1290 | $1,730 | $1.34 | 24d | 1 | 0.93mi |
| 1280 NW 49th St Deerfield Beach, FL | 3.0 | 2.0 | 1575 | $2,700 | $1.71 | 24d | 1 | 0.95mi |
| 4321 NW 9th Ave #204 Deerfield Beach, FL | 2.0 | 2.0 | 1360 | $2,350 | $1.73 | 7d | 1 | 0.98mi |
| 1851 Sandpiper Pointe Pl Deerfield Beach, FL | 3.0 | 2.5 | 1888 | $3,750 | $1.99 | 24d | 1 | 0.98mi |
| 1851 Sandpiper Pointe Pl Unit 1851 Deerfield Beach, FL | 3.0 | 2.5 | 1888 | $3,750 | $1.99 | 14d | 1 | 0.98mi |
| 4362 Veleiros Ave Pompano Beach, FL | 3.0 | 2.5 | 1628 | $3,700 | $2.27 | 24d | 1 | 0.99mi |
HOA detail
- Monthly dues
- $117 · $1,404/yr
- Likely covers
- poolsecurity
Listing history 22 events
-
2026-06-18days on market $195,000 Active 329 DOM
-
2026-06-17days on market $195,000 Active 328 DOM
-
2026-06-16days on market $195,000 Active 327 DOM
-
2026-06-15days on market $195,000 Active 326 DOM
-
2026-06-13days on market $195,000 Active 324 DOM
-
2026-06-09days on market $195,000 Active 320 DOM
-
2026-06-07days on market $195,000 Active 318 DOM
-
2026-06-04days on market $195,000 Active 315 DOM
-
2026-06-03days on market $195,000 Active 314 DOM
-
2026-06-02days on market $195,000 Active 313 DOM
-
2026-06-01days on market $195,000 Active 312 DOM
-
2026-05-31days on market $195,000 Active 311 DOM
-
2026-02-05status Active
-
2026-01-30historical Active Under Contract
-
2026-01-15price $195,000
-
2026-01-07price $199,000
-
2025-11-22price $205,000
-
2025-07-22$215,000 Active
-
2025-04-10soldstatus $155,000
-
2007-08-10soldstatus $120,000
-
1997-11-25soldstatus $59,300
-
1985-07-01soldstatus $24,300
ⓘ Source: listings_history table (triggers on properties + properties_extension) + one-shot
backfill from property_details.listing_events for pre-trigger history.
Tax reassessment forecast FL · Resets to sale price
- Current annual tax
- $3,576 · $298/mo
- Projected year-2 tax
- $3,576 · $298/mo
- Expected delta
- $0/yr ($0/mo · 0.0%)
ⓘ Screening estimate from a state-policy table — verify with the county assessor before closing.
Climate risk First Street
- Flood 3/10 Moderate FEMA zone AH · 20% chance over 30 yrs
- Wildfire 1/10 Low
- Heat 9/10 Extreme 7 d/yr ≥107°F today · 26 d/yr by 30 yrs out
- Wind 10/10 Extreme 99% chance of damaging wind over 30 yrs
- Air quality 2/10 Low 1 unhealthy d/yr today · 3 by 30 yrs out
Nearby sold comps map
Loading sold comps map…
Walkable amenities ~0.75 mi
Loading nearby amenities…
Taxation est. · year 1
- Rental income
- $32,216
- − Mortgage interest
- −$10,923
- − Property taxes
- −$3,576
- − Insurance
- −$2,800
- − Repairs & maintenance
- −$2,577
- − Management
- −$2,577
- − HOA
- −$1,404
- − Depreciation
- −$5,673
- Taxable income
- $2,686
- Est. tax owed @ 24.0%
- −$645
- After-tax cash flow
- $4,755/yr
For passive investors: Depreciation is non-cash, so a rental often shows a tax loss while cash-flowing — sheltering income. Rental losses are passive: they offset passive income freely, and up to $25,000/yr can offset ordinary (W-2) income if you actively participate and your MAGI is under $100k (phasing out to $0 by $150k); unused losses carry forward. On sale, claimed depreciation is recaptured at up to 25%, and gains may owe capital-gains tax (a 1031 exchange can defer both). Figures are a year-1 estimate at your 24.0% rate — not tax advice; consult a CPA.
Schools (NCES district)
- District
- Broward
- NCES district ID
- 1200180
- Math proficiency
- 42% ▼ -18.00%
- Reading proficiency
- 53% ▼ -5.00%
- Median HH income
- $52,139
- Composite
- 40.88/100
- National rank
- #3621
- State rank
- #46 of 73 in FL
Livability — Deerfield Beach
- Score
- 75/100
- State rank
- #250
- US rank
- #3970
Category grades
Schools grade is shown separately in the Schools card above.
Census & demographics
- Census place
- Deerfield Beach, FL
- County
- Broward County · 1,963,430 people
- City population
- 61,449
- Metro
- Miami-Fort Lauderdale-Pompano Beach, FL
- Population (ZIP)
- 64,563
- Household income
- $71,301
- Rent vs Own
- Severe rent burden
- 2907.0
Population outlook (Broward County) Hauer SSP2
- Today (2025)
- 2,207,033 people
- By 2030
- 2,360,704 · +7.0%
- By 2040
- 2,661,208 · +20.6%
- By 2050
- 2,946,698 · +33.5%
- By 2075
- 3,602,273 · +63.2%
- By 2100
- 3,970,984 · +79.9%
Race, ethnicity, and origin ACS 2023
- Neighborhood character
- Highly diverse neighborhood (Simpson 0.75)
- Race & ethnicity
- White 34% Hispanic / Latino 27% Black 25% Two or more races 24% Asian 2%
- Hispanic origin (detail)
- Mexican 4% Puerto Rican 4% Cuban 4% Dominican 2%
- Common ancestry
- Hispanic 13% Estonian 10% Romanian 1%
- Foreign-born
- 43% · Canada, Jamaica, Dominican Republic
- Languages at home
- 45% English-only · Spanish 23% French/Haitian/Cajun 16% Other Indo-European 13%
Political lean MEDSL · Broward
- 2024 margin
- D (+17.0) · D 58.0% · R 41.0%
- 2008→2024 swing
- -17.8pp toward R · 2008: 34.7pp · 2024: 17.0pp
- All cycles
- 2024: D+17.0 2020: D+29.8 2016: D+35.0 2012: D+34.9 2008: D+34.7
Not yet ingested
- Civics
- —
Market trends
- HPI YoY
- ▼ -109.09%
- Current HPI
- 474.7007
- Rent YoY
- ▲ 1.75%
- Metro
- Miami-Fort Lauderdale-Pompano Beach, FL
- State GDP YoY
- ▲ 3.28%
- F500 in state
- 36
Industry mix (Fortune 500 HQ in FL)
| Industry | F500 HQs | Revenue |
|---|---|---|
| Industrial Technology | 2 | $29B |
|
||
| Insurance | 2 | $17B |
|
||
| Retail | 1 | $60B |
|
||
| Technology Distribution | 1 | $58B |
|
||
| Homebuilding | 1 | $35B |
|
||
| Technology Manufacturing | 1 | $35B |
|
||
Price history
+702.5% since first listed10 events — show timeline
- 2026-02-05 Relisted — MARMLS
- 2026-01-30 Contingent — MARMLS
- 2026-01-15 Price Changed $195,000 MARMLS
- 2026-01-07 Price Changed $199,000 MARMLS
- 2025-11-22 Price Changed $205,000 MARMLS
- 2025-07-22 Listed $215,000 MARMLS
- 2025-04-10 Sold (Public Records) $155,000 Public Records
- 2007-08-10 Sold (Public Records) $120,000 Public Records
- 1997-11-25 Sold (Public Records) $59,300 Public Records
- 1985-07-01 Sold (Public Records) $24,300 Public Records
Property tax history
+10.3%/yrLatest (2025): $3,576 · +144.8% YoY. Source: county tax records.
Cash-flow waterfall
monthlySold comps — $/sqft
last 12 mo · ≤1 miLoading sold comps…