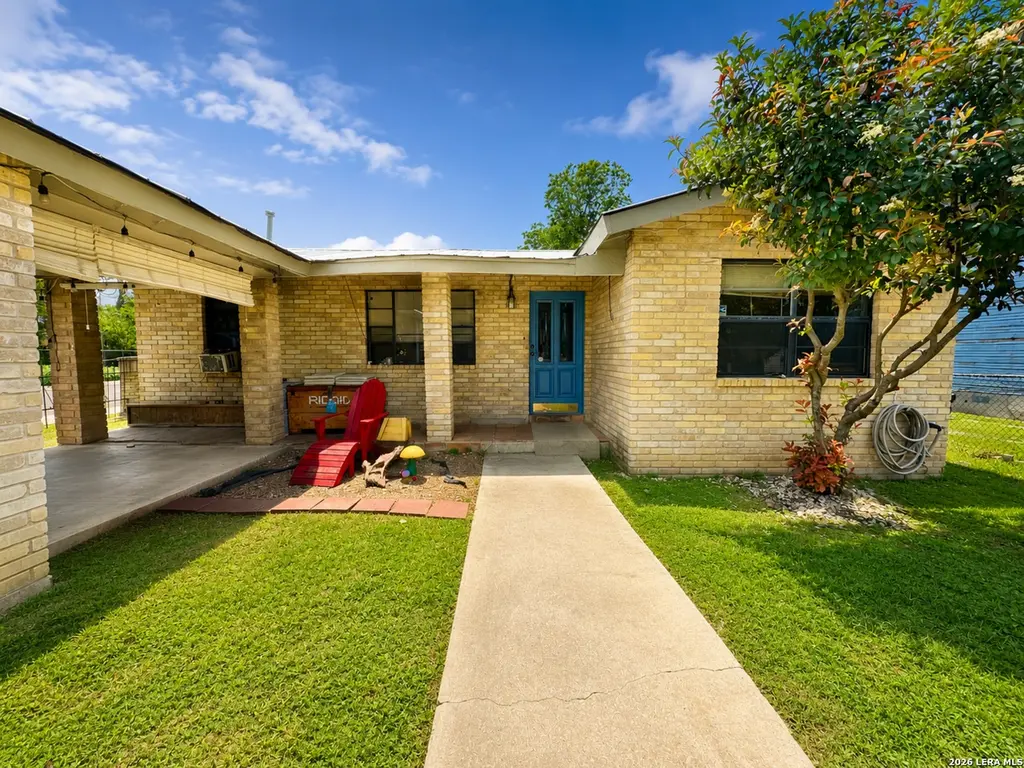
402 Chipinque · San Antonio, TX
Flood risk 1/10 · Minimal
- FEMA flood zone
- X (unshaded)
- Chance of flooding over 30 yrs
- 0.0%
- Est. flood insurance / yr
- $507 – $1,088
Fire risk 1/10 · Minimal
- Est. fire insurance / yr
- $1,222 – $2,270
Heat risk 8/10 · Major
- Hot days now (above 109°F)
- 7 days/yr
- Hot days in 30 yrs
- 20 days/yr
Wind risk 8/10 · Major
- Chance of severe wind over 30 yrs
- 80.0%
Air-quality risk 2/10 · Minimal
- Unhealthy air days now
- 1 days/yr
- Unhealthy air days in 30 yrs
- 1 days/yr
Risk factors via First Street. Map © Google.
Why this score? — see what drove the F grade
The composite is a weighted blend of 9 inputs, each scored 0–100. Each bar is that input's sub-score; the figure is the points it added to the 100-point composite (weight × sub-score).
- Appreciation +10.0/10.0
- Cash flow +7.7/30.0
- Rent growth +4.0/5.0
- Livability +4.0/5.0
- 1% rule +3.0/10.0
- Condition / age +2.5/5.0
- DSCR +1.8/10.0
- Schools +1.3/10.0
- ARV discount +0.0/15.0
$180,000
🖨 Deal sheet (PDF) 📄 Offer letter ✓ Due diligence
Listing remarks
Rare opportunity to own a property with a detached living quarters complete with its own kitchen, living area, bedroom, full bath, and private side entrance. Freshly painted and featuring a durable metal roof, this corner lot property offers flexibility and space that is increasingly difficult to find. The main home features 3 bedrooms and 1 bath, while the detached living quarters provides additional room for guests, extended household needs, hobbies, or a home office. Enjoy a large covered patio, carport, and fully fenced yard with plenty of space to relax and entertain. Conveniently located and full of potential, this is a property you won't want to miss.
Key facts
- Durable metal roof
- Large covered patio
- Fully fenced yard
Tags
Property features AI
Finance
- Financial info: Currently being leased; Not a down payment resource property
Exterior
- Utilities: City water/sewer
- Home design: Siding exterior; Pre-owned home; Level lot
- Construction: Built approximately 49 years ago; Slab foundation; Metal roof
- Exterior features: Covered patio; Chain link fence; Corner lot; Curbs and sidewalks
Interior
- Kitchen: Island kitchen; Gas cooking; Stove/Range
- Bedrooms: Master bedroom 12 x 12 with ceiling fan; Bedroom 2 11 x 10; Bedroom 3 9 x 11; Bedroom 4 13 x 13
- Flooring: Linoleum flooring; Laminate flooring
- Bathrooms: Two full bathrooms; Master bath with tub/shower combination and single vanity (9 x 9)
- Heating & cooling: Heat pump heating; Electric heat; Three or more window A/C units
- Interior features: Ceiling fans; Open floor plan; Island kitchen; Two living areas; Utility room inside; Some window coverings remain; Has fireplace; Accessible/adaptive home; Two or more access exits; Interior door openings 32"+; No carpet; Level lot
- Laundry & utility: Washer connection; Dryer connection; Utility room inside
Neighborhood map
What this means for you Summary
Snapshot
- This is a 3-bed/1.0-bath single-family listed at $180k.
Deal economics
- At list price, monthly cash flow is $-208 ($-2k/yr) — negative.
- To cash-flow at today's rent, offer at most $143k (20.4% below list).
- To meet the 1% rule (rent ≥ 1% of price), the offer needs to be $143k (20.3% below list).
- Recommended offer: $143k (20.4% below list) — sets the bar for cash-flow.
- Cap rate 4.9% vs local median 3.8% in San Antonio — meaningfully above typical; check what's discounted (condition, days-on-market, listing class) to confirm the premium yield is real.
Location & tenants
- Location reads 80/100 on livability (#31 in TX, #1,616 nationally) — a professional / high-income tenant draw. Strengths: amenities A+, commute A+, cost of living A+; Watch: crime F.
- Edgewood ISD (urban): math 12% / reading 21% proficiency, ranked #812 of 826 in TX (top 98%) — low school quality limits family demand, transient renter base, plan for 1-2y turnover.
- Zoned schools: Alonso S Perales El (math 22% / reading 27%, grade F, #3,052 of 4,322 statewide, top 74%, 353 students, 93% FRL); John F Kennedy H S (math 17% / reading 18%, grade F, #1,451 of 1,632 statewide, top 89%, 1,042 students, 92% FRL) — zoned schools average 93% FRL vs 24% district-wide (68 pts higher); higher-poverty schools than district average — tighter screening recommended.
- Market conditions: Rents rising fast (+6.1%/yr); 135 active listings in the ZIP; 5 comparable units currently listed for rent nearby; rentals leasing fast (median 5d on market — plan ~1-2 weeks tenant-placement turnaround); lower-income renter base — watch delinquency; 8,308 units permitted in Bexar County in 2024 (2,506 in 5+ unit buildings).
- This rent runs 40% of the median local income ($43k/yr) — at the standard rent-burdened threshold; future hikes will face affordability resistance.
Forward outlook
- In year one you build about $19k of equity ($1k loan paydown + $18k appreciation (10.0% local appreciation)).
- Bexar County population projected at +50% by 2050 — long-run rental-demand tailwind backs the buy-and-hold thesis.
- By year 2, paydown + projected appreciation supports a ~$31k cash-out refi (75% LTV) — recoverable capital for the next deal without selling this one.
Negotiation context
- It's been on market 23 days — a 2% lower offer ($177k) is reasonable based on typical stale-listing flexibility.
- 3 sale attempts with the ask held roughly flat each time — persistent listings suggest the price (not the market) is what's stuck; bring a comps-based counter.
Risks & watch-outs
- Climate carrying-cost: severe wind risk, 80% chance of damaging wind over 30y; extreme-heat days projected 7→20/yr by 2055 (HVAC capex compounding) — expect insurance premiums to compound above CPI over the hold.
Questions for the listing agent
- What do current leases actually rent for vs. the listed asking? Can we see a recent rent roll and the last 12 months of T-12 income?
- Built in 1977 — when were the roof, HVAC, electrical panel, plumbing, and water heater last replaced?
- Is there a deadline driving the sale (1031 exchange, divorce, estate, relocation)? That informs how much negotiation room exists.
- Crime grade is F in this area — have there been break-ins, vandalism, or insurance claims at this property in the last 3 years? What carrier currently insures it and at what premium?
- The area grade is low — what's the realistic commute time and amenity access for the typical tenant pool here? Any planned neighborhood developments (good or bad) we should know about?
- What's the average days-on-market for RENTAL listings here right now (not sales)? A rising rental-DOM trend means longer vacancies and softer asking-rent achievability than the comps imply.
- What's the recent tenant-quality profile in this submarket — average credit score on applications, eviction rate, late-payment / NSF rate, and stable-employment percentage? A property-management company in the area should have these aggregated.
- How much new for-sale + rental construction is in the pipeline within 1–3 miles? Heavy new supply typically softens prices + rents 12–24 months out; constrained supply supports both.
Investment metrics
- 1% rule
- 0.80% ✗
- Cap rate
- 4.91%
- Cash-on-cash
- -4.94%
- DSCR
- 0.78
- GRM
- 10.5
CMA / ARV
- ARV (on-the-fly)
- $127,040
- Comps found
- 1
Show comp detail 1 sale within ~0.75 mi
| Address | Dist | Beds/Ba | Sqft | Sold | Price | $/sf | Match |
|---|---|---|---|---|---|---|---|
| 1107 Barclay St | 0.64mi | 3/2.0 | 1,557 (-2%) | 15mo | $125,000 | $80 | 51 |
Match score weights: distance 35% · size 25% · config 20% · recency 20%. Top-matched comps best support the ARV.
Projected returns pro-forma
10.0% appreciation · 6.13% rent growth · sell at horizon
- IRR
- 21.8%
- Equity multiple
- 2.78×
- Total profit
- $89,552
- Equity at exit
- $162,158
- IRR
- 20.4%
- Equity multiple
- 6.65×
- Total profit
- $284,999
- Equity at exit
- $349,700
Cash invested: $50,400 (down + closing). Projections, not guarantees.
Landlord ↔ Tenant lean methodology
- Overall (STATE)
- 87 Strongly Landlord-Friendly
- State Texas
- 87 Strongly Landlord-Friendly · R+5
- County
- — inherits STATE
- City
- — inherits STATE
ZIP-level market 78237
- Home prices YoY
- 14.1%
- Rents YoY
- 6.1%
- Active inventory
- 135
- Price-to-rent
- 10.5×
Monthly cashflow live
- Estimated rent
- $1,434 high interval (Pro) →
- Mortgage (P&I)
- −$944
- Tax from tax record
- −$322 /mo · $3,861/yr
- Insurance
- −$75
- HOA
- −$0
- Vacancy / Maint / Mgmt
- −$301
- Net cashflow
- $-208
Break-even live
Sensitivity live
| Price | -10% $-106 | -5% $-157 | +0% $-208 | +5% $-259 | +10% $-309 |
|---|---|---|---|---|---|
| Rent | -10% $-321 | -5% $-264 | +0% $-208 | +5% $-151 | +10% $-94 |
| Rate | -1.0pp $-117 | -0.5pp $-162 | base $-208 | +0.5pp $-254 | +1.0pp $-302 |
UW: 25.0% down · 7.5% · 30yr · 1.5% tax · 5.0% vac · 8.0% maint · 8.0% mgmt
Financing live
Cash to close
- Down payment
- $45,000
- Closing costs
- $5,400
- Reserves months
- —
- Total cash needed
- —
Loan-product check · same deal, 3 products live
Conventional
25% down · 7.5% · 30yr
- Down + closing
- —
- Monthly P&I
- —
- Monthly cashflow
- —
- DSCR
- —
- Eligible?
- —
Personal DTI + credit; lowest rate.
DSCR
20% down · 8.5% · 30yr
- Down + closing
- —
- Monthly P&I
- —
- Monthly cashflow
- —
- DSCR
- —
- Eligible?
- —
No personal income docs; deal must DSCR.
Hard money
10% down · 12.0% · 12mo
- Down + closing
- —
- Monthly P&I
- —
- Monthly cashflow
- —
- DSCR
- —
- Eligible?
- —
Short-term bridge; refi at stabilization.
Rent comps 5 comps
| Address | Beds | Baths | Sqft | Rent | $/sqft | DOM | Units | Dist |
|---|---|---|---|---|---|---|---|---|
| 1135 Ceralvo St San Antonio, TX | 3.0 | 2.0 | 1164 | $1,450 | $1.25 | 22d | 1 | 0.85mi |
| 1135 Ceralvo St San Antonio, TX | 3.0 | 2.0 | 1164 | $1,450 | $1.25 | 5d | 1 | 0.85mi |
| 1823 San Carlos St San Antonio, TX | 3.0 | 2.0 | 1090 | $1,099 | $1.01 | 2d | 1 | 1.12mi |
| 1906 Montezuma St San Antonio, TX | 2.0 | 1.5 | 1790 | $1,300 | $0.73 | 44d | 1 | 1.25mi |
| 2910 S Laredo St Unit 2 San Antonio, TX | 2.0 | 2.0 | 2127 | $1,295 | $0.61 | 4d | 1 | 1.35mi |
Listing history 16 events
-
2026-06-21days on market $180,000 Active 23 DOM
-
2026-06-18days on market $180,000 Active 21 DOM
-
2026-06-17days on market $180,000 Active 20 DOM
-
2026-06-16days on market $180,000 Active 19 DOM
-
2026-06-15days on market $180,000 Active 18 DOM
-
2026-06-13days on market $180,000 Active 16 DOM
-
2026-06-12days on market $180,000 Active 15 DOM
-
2026-06-09days on market $180,000 Active 12 DOM
-
2026-06-08statusdays on market $180,000 Active 11 DOM
-
2026-06-08days on market $180,000 New 10 DOM
-
2026-06-07days on market $180,000 New 9 DOM
-
2026-06-03days on market $180,000 New 6 DOM
-
2026-06-02days on market $180,000 New 5 DOM
-
2026-06-01days on market $180,000 New 4 DOM
-
2026-05-31remarks 666-char remark
-
2026-05-31$180,000 New 3 DOM
ⓘ Source: listings_history table (triggers on properties + properties_extension) + one-shot
backfill from property_details.listing_events for pre-trigger history.
Tax reassessment forecast TX · Resets to sale price
- Current annual tax
- $3,861 · $322/mo
- Projected year-2 tax
- $3,861 · $322/mo
- Expected delta
- $0/yr ($0/mo · 0.0%)
ⓘ Screening estimate from a state-policy table — verify with the county assessor before closing.
Climate risk First Street
- Flood 1/10 Low FEMA zone X (unshaded) · 0% chance over 30 yrs
- Wildfire 1/10 Low
- Heat 8/10 Severe 7 d/yr ≥109°F today · 20 d/yr by 30 yrs out
- Wind 8/10 Severe 80% chance of damaging wind over 30 yrs
- Air quality 2/10 Low 1 unhealthy d/yr today · 1 by 30 yrs out
Nearby sold comps map
Loading sold comps map…
Walkable amenities ~0.75 mi
Loading nearby amenities…
Taxation est. · year 1
- Rental income
- $17,212
- − Mortgage interest
- −$10,083
- − Property taxes
- −$3,861
- − Insurance
- −$900
- − Repairs & maintenance
- −$1,377
- − Management
- −$1,377
- − Depreciation
- −$5,236
- Taxable loss
- −$5,622
- Est. tax savings @ 24.0%
- +$1,349
- After-tax cash flow
- $-1,142/yr
For passive investors: Depreciation is non-cash, so a rental often shows a tax loss while cash-flowing — sheltering income. Rental losses are passive: they offset passive income freely, and up to $25,000/yr can offset ordinary (W-2) income if you actively participate and your MAGI is under $100k (phasing out to $0 by $150k); unused losses carry forward. On sale, claimed depreciation is recaptured at up to 25%, and gains may owe capital-gains tax (a 1031 exchange can defer both). Figures are a year-1 estimate at your 24.0% rate — not tax advice; consult a CPA.
Schools (NCES district)
- District
- Edgewood ISD
- NCES district ID
- 4818150
- Math proficiency
- 12% ▼ -18.00%
- Reading proficiency
- 21% ▼ -5.00%
- Median HH income
- $27,419
- Composite
- 12.82/100
- National rank
- #9597
- State rank
- #812 of 826 in TX
Livability — San Antonio
- Score
- 80/100
- State rank
- #31
- US rank
- #1616
Category grades
Schools grade is shown separately in the Schools card above.
Census & demographics
- Census place
- San Antonio, TX
- County
- Bexar County · 1,990,555 people
- City population
- 1,806,925
- Metro
- San Antonio-New Braunfels, TX
- Population (ZIP)
- 37,379
- Household income
- $42,772
- Rent vs Own
- Severe rent burden
- 1185.0
Population outlook (Bexar County) Hauer SSP2
- Today (2025)
- 2,336,851 people
- By 2030
- 2,560,728 · +9.6%
- By 2040
- 3,020,569 · +29.3%
- By 2050
- 3,493,522 · +49.5%
- By 2075
- 4,668,459 · +99.8%
- By 2100
- 5,533,242 · +136.8%
Race, ethnicity, and origin ACS 2023
- Neighborhood character
- Predominantly Hispanic (95%)
- Race & ethnicity
- Hispanic / Latino 95% Two or more races 50% White 3% Native American 2% Black 2%
- Hispanic origin (detail)
- Mexican 84%
- Foreign-born
- 18% · Canada
- Languages at home
- 34% English-only · Spanish 66%
Political lean MEDSL · Bexar
- 2024 margin
- Lean D (+9.8) · D 54.3% · R 44.6% · Other 1.1%
- 2008→2024 swing
- +4.2pp toward D · 2008: 5.6pp · 2024: 9.8pp
- All cycles
- 2024: D+9.8 2020: D+18.2 2016: D+13.5 2012: D+4.6 2008: D+5.6
Not yet ingested
- Civics
- —
Market trends
- HPI YoY
- ▲ 30.52%
- Current HPI
- 247.7257
- Rent YoY
- ▲ 6.13%
- Metro
- San Antonio-New Braunfels, TX
- State GDP YoY
- ▲ 3.95%
- F500 in state
- 110
Industry mix (Fortune 500 HQ in TX)
| Industry | F500 HQs | Revenue |
|---|---|---|
| Energy | 16 | $1,198B |
|
||
| Technology | 5 | $198B |
|
||
| Engineering / Construction | 4 | $72B |
|
||
| Energy Services | 3 | $60B |
|
||
| Utilities | 3 | $41B |
|
||
| Healthcare | 2 | $330B |
|
||
Price history
+2.9% since first listed6 events — show timeline
- 2026-05-28 Listed $180,000 LERA
- 2026-03-10 Listing Removed — LERA
- 2025-10-12 Price Changed $174,500 LERA
- 2025-09-29 Relisted — LERA
- 2025-09-26 Listing Removed — LERA
- 2025-09-13 Listed $175,000 LERA
Property tax history
+5.6%/yrLatest (2025): $3,861 · -11.3% YoY. Source: county tax records.
Cash-flow waterfall
monthlySold comps — $/sqft
last 12 mo · ≤1 miLoading sold comps…