 6-Plex
410 Main St W · Ashland, WI
Flood risk No data
- FEMA flood zone
- —
- Chance of flooding over 30 yrs
- —
- Est. flood insurance / yr
- —
Fire risk No data
- Est. fire insurance / yr
- —
Heat risk No data
- Hot days now (above threshold)
- —
- Hot days in 30 yrs
- —
Wind risk No data
- Chance of severe wind over 30 yrs
- —
Air-quality risk No data
- Unhealthy air days now
- —
- Unhealthy air days in 30 yrs
- —
Risk factors via First Street. Map © Google.
Why this score? — see what drove the C- grade
The composite is a weighted blend of 9 inputs, each scored 0–100. Each bar is that input's sub-score; the figure is the points it added to the 100-point composite (weight × sub-score).
- Cash flow +21.9/30.0
- ARV discount +7.5/15.0
- DSCR +7.0/10.0
- 1% rule +5.7/10.0
- Livability +4.2/5.0
- Rent growth +2.5/5.0
- Condition / age +2.2/5.0
- Schools +1.9/10.0
- Appreciation +0.0/10.0
$450,000
🖨 Deal sheet (PDF) 📄 Offer letter ✓ Due diligence
Multi-family units
County records classify this as Multi-Family (5+ Unit). Listing-text estimate: 6 units. confirmed
5+ unit building — per-unit beds/baths from public records are typically unavailable; the breakdown below (if shown) is an estimate from the listing text.
Listing remarks MLS
Located in the heart of downtown Ashland, this 6-unit mixed-use investment opportunity offers strong rental income potential with historically solid occupancy in one of Northern Wisconsin’s most charming Lake Superior communities. The property features one commercial storefront on the main level along with five upper-level residential units, each offering 1 bedroom and 1 bathroom. Tenants pay electric separately for their own units, and each unit is individually zoned for boiler heat, providing added efficiency and management flexibility for ownership. Positioned along historic Main Street, tenants and visitors alike enjoy close proximity to Ashland’s vibrant downtown district, local shops, restaurants, the Lake Superior waterfront, and the renowned Ashland Mural Walk. Whether you are looking to expand your investment portfolio or own a versatile income-producing property, this listing presents a great opportunity! Willing to sell individually or as a package with 210 Main Street.
Key facts
- Historic main street
- Local shops
- 3,484 sq ft lot
Tags
Property features AI
Exterior
- Parking: Off-street parking; Street parking
- Home design: Duplex (up/down) style within a multi-family property; Three stories
- Construction: Built on a 0.08-acre lot
- Exterior features: Off-street parking and street parking available
Interior
- Bedrooms: One-bedroom unit (Unit 1)
- Bathrooms: One full bath (Unit 1)
- Interior features: Multi-family building with six units; Three-story structure
Neighborhood map
What this means for you Summary
Snapshot
- This is a 6 × 1-bed/1-bath units multifamily listed at $450k. Condition is rated fair.
Deal economics
- At list price, monthly cash flow is $705 ($8k/yr) — positive. Per door: $118/mo.
- The deal already cash-flows at list — no discount required.
- Meets the 1% rule at list price ($5k rent vs $450k).
- Recommended offer: $443k (1.5% below list) — sets the bar for market timing.
- Cap rate 8.2% vs local median 3.4% in Ashland — top-decile yield for the area; either an underpriced asset or a hidden risk that comps aren't pricing in. Stress-test before assuming the spread holds.
Location & tenants
- Location reads 84/100 on livability (#37 in WI, #750 nationally) — a professional / high-income tenant draw. Strengths: cost of living A+, health & safety A+, commute A; Watch: schools C-, employment F.
- Ashland School District (town): math 16% / reading 30% proficiency, ranked #325 of 342 in WI (top 95%) — low school quality limits family demand, transient renter base, plan for 1-2y turnover.
- Market conditions: 87 active listings in the ZIP; 2 comparable units currently listed for rent nearby; 30 units permitted in Ashland County in 2024 (0 in 5+ unit buildings).
Forward outlook
- Local home prices are declining (-3.0%/yr); year-one equity from $3k of loan paydown is wiped out by about $14k of value loss. Plan a longer hold.
- Ashland County population projected at -22% by 2050 — secular population decline; favor cash flow + early exit over multi-decade hold.
Negotiation context
- It's been on market 24 days — a 2% lower offer ($443k) is reasonable based on typical stale-listing flexibility.
- 2 sale attempts with the ask held roughly flat each time — persistent listings suggest the price (not the market) is what's stuck; bring a comps-based counter.
Questions for the listing agent
- Can we see the unit-by-unit rent roll, current vacancy, and any below-market leases? What's the average tenancy length?
- What capital expenditures (roof, boiler, parking lot, exteriors) have been made in the last 5 years, and what's planned in the next 2?
- Have any recent inspections been done? Can we get a copy of the seller's disclosures and any deferred-maintenance estimates?
- Is there a deadline driving the sale (1031 exchange, divorce, estate, relocation)? That informs how much negotiation room exists.
- What's the average days-on-market for RENTAL listings here right now (not sales)? A rising rental-DOM trend means longer vacancies and softer asking-rent achievability than the comps imply.
- What's the recent tenant-quality profile in this submarket — average credit score on applications, eviction rate, late-payment / NSF rate, and stable-employment percentage? A property-management company in the area should have these aggregated.
- How much new apartment / multifamily construction is in the pipeline within 1–3 miles? Heavy new supply (>2% of stock underway) typically softens rents 12–24 months out; light construction supports rent growth.
Investment metrics
- 1% rule
- 1.07% ✓
- Cap rate
- 8.17%
- Cash-on-cash
- 6.71%
- DSCR
- 1.30
- GRM
- 7.8
CMA / ARV
No comps found within radius.
Show comp detail 12 sales within ~0.75 mi
| Address | Dist | Beds/Ba | Sqft | Sold | Price | $/sf | Match |
|---|---|---|---|---|---|---|---|
| 612 6th St W | 0.31mi | 2/1.0 | 1,160 | 5mo | $950 | $1 | 69 |
| 213 Main St E | 0.36mi | 2/1.0 | 3,750 | 3mo | $969 | — | 68 |
| 609 10th Ave W | 0.49mi | 4/2.0 | — | 2mo | $166,000 | — | 63 |
| 1208 Main St St W | 0.55mi | 2/1.0 | 2,400 | 1mo | $1,200 | $1 | 61 |
| 420 1/2 E Lake Shore Dr | 0.52mi | 1/1.0 | 1,872 | 4mo | $900 | — | 60 |
| 423 5th Ave Ave E | 0.54mi | 1/1.0 | 3,000 | 4mo | $899 | — | 59 |
| 612 St Claire St | 0.64mi | 4/3.0 | — | 5mo | $150,900 | — | 53 |
| 614 St Claire St | 0.65mi | 2/1.0 | 980 | 5mo | $999 | $1 | 53 |
| 1101 6th St W | 0.53mi | 8/4.0 | — | 13mo | $225,000 | — | 52 |
| 511 3rd St E | 0.56mi | 2/2.0 | — | 12mo | $185,000 | — | 51 |
| 617 Main St St E | 0.64mi | 1/1.0 | 3,000 | 9mo | $850 | — | 50 |
| 1110 - 1112 Ellis Ave | 0.69mi | 4/2.0 | — | 11mo | $80,000 | — | 46 |
Match score weights: distance 35% · size 25% · config 20% · recency 20%. Top-matched comps best support the ARV.
Projected returns pro-forma
-3.0% appreciation · 3.0% rent growth · sell at horizon
- IRR
- -6.0%
- Equity multiple
- 0.78×
- Total profit
- $-27,941
- Equity at exit
- $67,096
- IRR
- 3.7%
- Equity multiple
- 1.27×
- Total profit
- $33,789
- Equity at exit
- $38,908
Cash invested: $126,000 (down + closing). Projections, not guarantees.
Landlord ↔ Tenant lean methodology
- Overall (STATE)
- 73 Landlord-Friendly
- State Wisconsin
- 73 Landlord-Friendly · R+2
- County
- — inherits STATE
- City
- — inherits STATE
ZIP-level market 54806
- Active inventory
- 87
- Price-to-rent
- 46.6×
Monthly cashflow live
- Estimated rent
- $4,829 medium interval (Pro) →
- Mortgage (P&I)
- −$2,360
- Tax est. 1.5%
- −$562 /mo · $6,750/yr
- Insurance
- −$188
- HOA
- −$0
- Vacancy / Maint / Mgmt
- −$1,014
- Net cashflow
- $705
Break-even live
Sensitivity live
| Price | -10% $1,016 | -5% $861 | +0% $705 | +5% $550 | +10% $394 |
|---|---|---|---|---|---|
| Rent | -10% $324 | -5% $514 | +0% $705 | +5% $896 | +10% $1,087 |
| Rate | -1.0pp $932 | -0.5pp $820 | base $705 | +0.5pp $588 | +1.0pp $470 |
6-unit breakdown (identical units grouped — click to expand)
| Units | Beds | Baths | Est. rent |
|---|---|---|---|
| 6× units | 1 | 1 | $4,830 |
| #1 | 1 | 1 | $805 |
| #2 | 1 | 1 | $805 |
| #3 | 1 | 1 | $805 |
| #4 | 1 | 1 | $805 |
| #5 | 1 | 1 | $805 |
| #6 | 1 | 1 | $805 |
| Total (6 units) | $4,829 | ||
UW: 25.0% down · 7.5% · 30yr · 1.5% tax · 5.0% vac · 8.0% maint · 8.0% mgmt
Financing live
Cash to close
- Down payment
- $112,500
- Closing costs
- $13,500
- Reserves months
- —
- Total cash needed
- —
Loan-product check · same deal, 3 products live
Conventional
25% down · 7.5% · 30yr
- Down + closing
- —
- Monthly P&I
- —
- Monthly cashflow
- —
- DSCR
- —
- Eligible?
- —
Personal DTI + credit; lowest rate.
DSCR
20% down · 8.5% · 30yr
- Down + closing
- —
- Monthly P&I
- —
- Monthly cashflow
- —
- DSCR
- —
- Eligible?
- —
No personal income docs; deal must DSCR.
Hard money
10% down · 12.0% · 12mo
- Down + closing
- —
- Monthly P&I
- —
- Monthly cashflow
- —
- DSCR
- —
- Eligible?
- —
Short-term bridge; refi at stabilization.
Rent comps 2 comps
| Address | Beds | Baths | Sqft | Rent | $/sqft | DOM | Units | Dist |
|---|---|---|---|---|---|---|---|---|
| 522 Chapple Ave Apt 102 Ashland, WI | 1.0 | 1.0 | — | $741 | — | 44d | 1 | 0.26mi |
| 1406 Lake Shore Dr E Ashland, WI | 2.0 | 1.0 | 2800 | $1,100 | $0.39 | 44d | 1 | 1.20mi |
Listing history 18 events
-
2026-06-21days on market $450,000 Active 24 DOM
-
2026-06-18days on market $450,000 Active 22 DOM
-
2026-06-17days on market $450,000 Active 21 DOM
-
2026-06-16days on market $450,000 Active 20 DOM
-
2026-06-15days on market $450,000 Active 19 DOM
-
2026-06-15days on market $450,000 Active 18 DOM
-
2026-06-13days on market $450,000 Active 17 DOM
-
2026-06-12days on market $450,000 Active 16 DOM
-
2026-06-09days on market $450,000 Active 13 DOM
-
2026-06-08days on market $450,000 Active 12 DOM
-
2026-06-08days on market $450,000 Active 11 DOM
-
2026-06-07days on market $450,000 Active 10 DOM
-
2026-06-03days on market $450,000 Active 7 DOM
-
2026-06-02days on market $450,000 Active 6 DOM
-
2026-06-01days on market $450,000 Active 5 DOM
-
2026-05-31days on market $450,000 Active 4 DOM
-
2026-05-27$450,000 Active 1007-char remark
Show marketing remark (1007 chars)
Located in the heart of downtown Ashland, this 6-unit mixed-use investment opportunity offers strong rental income potential with historically solid occupancy in one of Northern Wisconsin’s most charming Lake Superior communities. The property features one commercial storefront on the main level along with five upper-level residential units, each offering 1 bedroom and 1 bathroom. Tenants pay electric separately for their own units, and each unit is individually zoned for boiler heat, providing added efficiency and management flexibility for ownership. Positioned along historic Main Street, tenants and visitors alike enjoy close proximity to Ashland’s vibrant downtown district, local shops, restaurants, the Lake Superior waterfront, and the renowned Ashland Mural Walk. Whether you are looking to expand your investment portfolio or own a versatile income-producing property, this listing presents a great opportunity! Willing to sell individually or as a package with 210 Main Street.
ⓘ Source: listings_history table (triggers on properties + properties_extension) + one-shot
backfill from property_details.listing_events for pre-trigger history.
Nearby sold comps map
Loading sold comps map…
Walkable amenities ~0.75 mi
Loading nearby amenities…
Taxation est. · year 1
- Rental income
- $57,948
- − Mortgage interest
- −$25,207
- − Property taxes
- −$6,750
- − Insurance
- −$2,250
- − Repairs & maintenance
- −$4,636
- − Management
- −$4,636
- − Depreciation
- −$13,091
- Taxable income
- $1,378
- Est. tax owed @ 24.0%
- −$331
- After-tax cash flow
- $8,130/yr
For passive investors: Depreciation is non-cash, so a rental often shows a tax loss while cash-flowing — sheltering income. Rental losses are passive: they offset passive income freely, and up to $25,000/yr can offset ordinary (W-2) income if you actively participate and your MAGI is under $100k (phasing out to $0 by $150k); unused losses carry forward. On sale, claimed depreciation is recaptured at up to 25%, and gains may owe capital-gains tax (a 1031 exchange can defer both). Figures are a year-1 estimate at your 24.0% rate — not tax advice; consult a CPA.
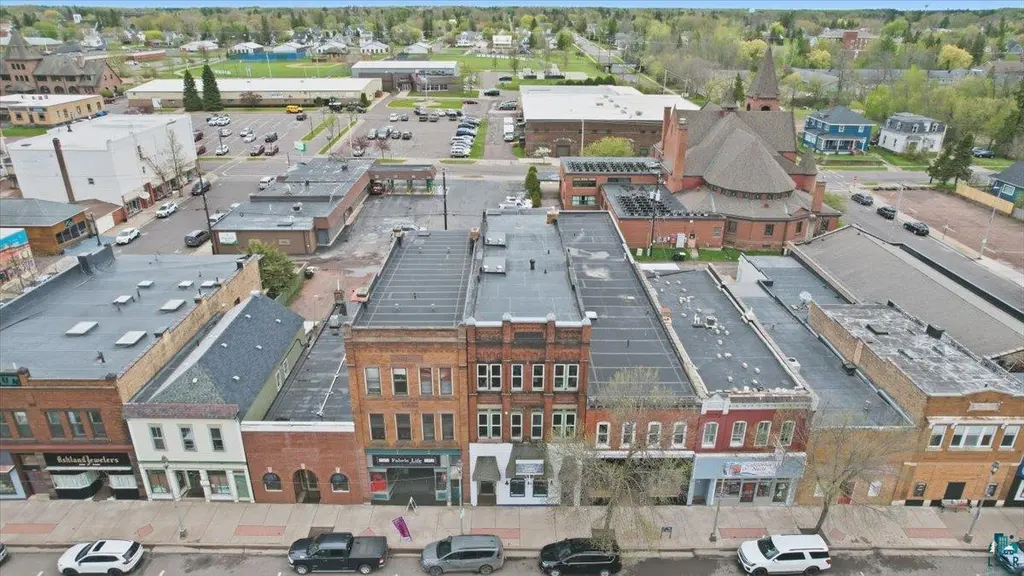
Condition & rehab AI · 11 photos
This multi-family property requires moderate rehabilitation, focusing on the roof and exterior walls. Painting and updating the interior can significantly enhance its value and appeal to both buyers and renters.
Repairs flagged
- Major roof — Significant wear and tear visible in aerial view.
- Minor exterior walls — Some discoloration noted, but not severe enough to require immediate attention.
Value-add opportunities
- Both Painting exterior and interior walls — Fresh paint can improve curb appeal and interior aesthetics.
- Both New flooring — New carpet or tile can enhance the living space and increase appeal.
- Both Roof replacement — A new roof will improve the property's value and reduce maintenance costs.
Renovation cost estimate screening
| Repair item | Severity | Est. cost |
|---|---|---|
| roof · Significant wear and tear visible in aerial view. | Major | $15,000–50,000 |
| exterior walls · Some discoloration noted, but not severe enough to require immediate attention. | Minor | $500–3,000 |
| Total estimated repair cost · 2 items | $15,500–53,000 |
Value-add ROI direction
- Both Painting exterior and interior walls — Fresh paint can improve curb appeal and interior aesthetics. ↑
- Both New flooring — New carpet or tile can enhance the living space and increase appeal. ↑
- Both Roof replacement — A new roof will improve the property's value and reduce maintenance costs. ↑
ⓘ Cost ranges are severity-bucket heuristics (US national rule-of-thumb). Get contractor quotes + a written scope before underwriting a rehab budget.
Schools (NCES district)
- District
- Ashland School District
- NCES district ID
- 5500510
- Math proficiency
- 16% ▼ -16.00%
- Reading proficiency
- 30% ▼ -4.00%
- Median HH income
- $40,114
- Composite
- 19.4/100
- National rank
- #8782
- State rank
- #325 of 342 in WI
Livability — Ashland
- Score
- 84/100
- State rank
- #37
- US rank
- #750
Category grades
Schools grade is shown separately in the Schools card above.
Census & demographics
- Census place
- Ashland, WI
- Population (ZIP)
- 11,708
Population outlook (Ashland County) Hauer SSP2
- Today (2025)
- 15,204 people
- By 2030
- 14,639 · -3.7%
- By 2040
- 13,198 · -13.2%
- By 2050
- 11,841 · -22.1%
- By 2075
- 9,755 · -35.8%
- By 2100
- 8,675 · -42.9%
Race, ethnicity, and origin ACS 2023
- Neighborhood character
- Predominantly White (81%)
- Race & ethnicity
- White 81% Native American 9% Two or more races 6% Hispanic / Latino 4%
- Common ancestry
- Romanian 8% Portuguese 6% Lithuanian 2%
- Foreign-born
- 2% · Canada
- Languages at home
- 96% English-only · Spanish 1% Other Indo-European 1%
Political lean MEDSL · Ashland
- 2024 margin
- Toss-up / Even · D 51.6% · R 46.9% · Other 1.5%
- 2008→2024 swing
- -32.4pp toward R · 2008: 37.1pp · 2024: 4.7pp
- All cycles
- 2024: D+4.7 2020: D+11.0 2016: D+8.9 2012: D+30.8 2008: D+37.1
Not yet ingested
- Civics
- —
Market trends
- HPI YoY
- ▼ -142.11%
- Current HPI
- 168.3012
- Rent YoY
- —
- Metro
- —
- State GDP YoY
- ▲ 2.10%
- F500 in state
- 20
Industry mix (Fortune 500 HQ in WI)
| Industry | F500 HQs | Revenue |
|---|---|---|
| Industrial Machinery | 4 | $23B |
|
||
| Industrial Technology | 2 | $36B |
|
||
| Insurance | 1 | $36B |
|
||
| Professional Services | 1 | $19B |
|
||
| Utilities | 1 | $9B |
|
||
| Consumer Goods | 1 | $3B |
|
||
Price history
+0.0% since first listed2 events — show timeline
- 2026-05-27 Listed $450,000 LSAR
- 2026-05-27 Listed $450,000 SAAR
Cash-flow waterfall
monthlySold comps — $/sqft
last 12 mo · ≤1 miLoading sold comps…