111 Kahului Beach Rd Unit D117 · Kahului, HI
Flood risk 1/10 · Minimal
- FEMA flood zone
- VE
- Chance of flooding over 30 yrs
- 0.0%
- Est. flood insurance / yr
- $5,013 – $11,043
Fire risk No data
- Est. fire insurance / yr
- —
Heat risk No data
- Hot days now (above threshold)
- —
- Hot days in 30 yrs
- —
Wind risk No data
- Chance of severe wind over 30 yrs
- —
Air-quality risk 1/10 · Minimal
- Unhealthy air days now
- —
- Unhealthy air days in 30 yrs
- —
Risk factors via First Street. Map © Google.
Why this score? — see what drove the D+ grade
The composite is a weighted blend of 9 inputs, each scored 0–100. Each bar is that input's sub-score; the figure is the points it added to the 100-point composite (weight × sub-score).
- Cash flow +13.0/30.0
- 1% rule +10.0/10.0
- ARV discount +7.5/15.0
- DSCR +3.9/10.0
- Schools +3.7/10.0
- Livability +3.7/5.0
- Rent growth +2.5/5.0
- Condition / age +2.5/5.0
- Appreciation +0.0/10.0
$149,000
🖨 Deal sheet (PDF) 📄 Offer letter ✓ Due diligence
Listing remarks MLS
Sold before listed
Key facts
- On-site security
- New kitchen
- New flooring
Tags
Property features AI
Finance
- Financial info: Fee simple ownership
- HOA & community: Monthly association fee; Association maintenance fee approximately $1,241.79
Exterior
- Utilities: Cable connected
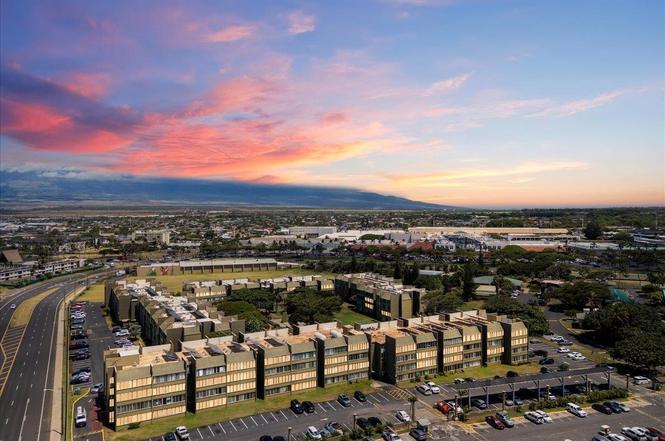
- Home design: Condominium (attached); Part of Harbor Lights
- Construction: Concrete construction; Built in 1974 (effective year 2025); Solar energy generation
- Exterior features: Garden view; Across street from the ocean; Public water
Interior
- Kitchen: Microwave; Refrigerator
- Bathrooms: 2 total bathrooms
- Heating & cooling: No central A/C
- Interior features: Ceiling fan(s); Microwave; Refrigerator
Neighborhood map
What this means for you Summary
Snapshot
- This is a 2-bed/1.5-bath condo listed at $149k.
Deal economics
- At list price, monthly cash flow is $-677 ($-8k/yr) — negative.
- To cash-flow at today's rent, offer at most $29k (80.3% below list).
- Meets the 1% rule at list price ($3k rent vs $149k).
- Recommended offer: $29k (80.3% below list) — sets the bar for cash-flow.
Location & tenants
- Location reads 74/100 on livability (#17 in HI, #4,968 nationally) — a middle-class / working-renter tenant base. Strengths: commute A+, employment A+, health & safety A+; Watch: amenities F, cost of living F.
- Hawaii Department Of Education (suburban): math 32% / reading 50% proficiency, ranked #1 of 1 in HI (top 100%) — families likely to look elsewhere, expect single-tenant / working-renter base with shorter leases.
- Zoned schools: Wailuku Elementary School (math 18% / reading 35%, grade F, #143 of 183 statewide, top 78%, 562 students, 64% FRL); Iao Intermediate School (math 17% / reading 43%, grade F, #28 of 42 statewide, top 66%, 780 students, 50% FRL); Henry Perrine Baldwin High School (math 30% / reading 57%, grade F, #23 of 43 statewide, top 52%, 1,338 students, 43% FRL).
- Market conditions: 60 active listings in the ZIP; 17 comparable units currently listed for rent nearby; rentals lingering (median 46d on market — plan ~5-8 weeks vacancy on turnover, expect pricing pressure); 53% of comp listings sitting > 30 days — soft ceiling on asking rent; 906 units permitted in Maui County in 2024 (289 in 5+ unit buildings).
Forward outlook
- Local home prices are declining (-3.0%/yr); year-one equity from $1k of loan paydown is wiped out by about $4k of value loss. Plan a longer hold.
- Maui County population projected at +22% by 2050 — long-run rental-demand tailwind backs the buy-and-hold thesis.
Negotiation context
- Only 4 days on market — expect competitive offers; lowballing is unlikely to land.
- 7 sale attempts since 30y ago with the ask held roughly flat each time — persistent listings suggest the price (not the market) is what's stuck; bring a comps-based counter.
Risks & watch-outs
- Watch-outs: flood insurance adds $669/mo; HOA is 45% of rent.
- Climate carrying-cost: in FEMA flood zone VE (mandatory federal flood insurance) — expect insurance premiums to compound above CPI over the hold.
Questions for the listing agent
- What do current leases actually rent for vs. the listed asking? Can we see a recent rent roll and the last 12 months of T-12 income?
- Built in 1974 — when were the roof, HVAC, electrical panel, plumbing, and water heater last replaced?
- What's the actual annual flood-insurance premium (NFIP or private), and is the property in a SFHA with mandatory coverage?
- What does the HOA fee cover, when was the last increase, and are there any pending special assessments or reserve-fund shortfalls?
- Any open or pending special assessments — roof, HVAC, plumbing, elevator, façade? What's the per-unit balance and payoff schedule, and is the seller paying it off at close or rolling it to the buyer?
- Is there a deadline driving the sale (1031 exchange, divorce, estate, relocation)? That informs how much negotiation room exists.
- Schools are D-rated, which usually means shorter tenancies and higher turnover. Who's the typical renter profile here, and what's been the actual vacancy rate?
- The area grade is low — what's the realistic commute time and amenity access for the typical tenant pool here? Any planned neighborhood developments (good or bad) we should know about?
- What's the average days-on-market for RENTAL listings here right now (not sales)? A rising rental-DOM trend means longer vacancies and softer asking-rent achievability than the comps imply.
- What's the recent tenant-quality profile in this submarket — average credit score on applications, eviction rate, late-payment / NSF rate, and stable-employment percentage? A property-management company in the area should have these aggregated.
- How much new apartment / multifamily construction is in the pipeline within 1–3 miles? Heavy new supply (>2% of stock underway) typically softens rents 12–24 months out; light construction supports rent growth.
Investment metrics
- 1% rule
- 1.85% ✓
- Cap rate
- 6.23%
- Cash-on-cash
- -0.24%
- DSCR
- 0.99
- GRM
- 4.5
CMA / ARV
No comps found within radius.
Projected returns pro-forma
-3.0% appreciation · 3.0% rent growth · sell at horizon
- IRR
- -54.1%
- Equity multiple
- -0.58×
- Total profit
- $-66,118
- Equity at exit
- $22,216
- IRR
- —
- Equity multiple
- -1.60×
- Total profit
- $-108,396
- Equity at exit
- $12,883
Cash invested: $41,720 (down + closing). Projections, not guarantees.
Landlord ↔ Tenant lean methodology
- Overall (STATE)
- 37 Tenant-Leaning
- State Hawaii
- 37 Tenant-Leaning · D+13
- County
- — inherits STATE
- City
- — inherits STATE
ZIP-level market 96732
- Home prices YoY
- -4.7%
- Active inventory
- 60
- Price-to-rent
- 4.5×
Monthly cashflow live
- Estimated rent
- $2,756 high interval (Pro) →
- Mortgage (P&I)
- −$781
- Tax from tax record
- −$101 /mo · $1,212/yr
- Insurance
- −$62
- Flood insurance flood zone
- −$669 /mo · $8,028/yr
- HOA
- −$1,241
- Lot rent
- −$0
- Vacancy / Maint / Mgmt
- −$579
- Net cashflow
- $-677
Break-even live
Sensitivity live
| Price | -10% $-593 | -5% $-635 | +0% $-677 | +5% $-719 | +10% $-762 |
|---|---|---|---|---|---|
| Rent | -10% $-895 | -5% $-786 | +0% $-677 | +5% $-568 | +10% $-460 |
| Rate | -1.0pp $-602 | -0.5pp $-639 | base $-677 | +0.5pp $-716 | +1.0pp $-755 |
UW: 25.0% down · 7.5% · 30yr · 1.5% tax · 5.0% vac · 8.0% maint · 8.0% mgmt
Financing live
Cash to close
- Down payment
- $37,250
- Closing costs
- $4,470
- Reserves months
- —
- Total cash needed
- —
Loan-product check · same deal, 3 products live
Conventional
25% down · 7.5% · 30yr
- Down + closing
- —
- Monthly P&I
- —
- Monthly cashflow
- —
- DSCR
- —
- Eligible?
- —
Personal DTI + credit; lowest rate.
DSCR
20% down · 8.5% · 30yr
- Down + closing
- —
- Monthly P&I
- —
- Monthly cashflow
- —
- DSCR
- —
- Eligible?
- —
No personal income docs; deal must DSCR.
Hard money
10% down · 12.0% · 12mo
- Down + closing
- —
- Monthly P&I
- —
- Monthly cashflow
- —
- DSCR
- —
- Eligible?
- —
Short-term bridge; refi at stabilization.
Rent comps 17 comps
| Address | Beds | Baths | Sqft | Rent | $/sqft | DOM | Units | Dist |
|---|---|---|---|---|---|---|---|---|
| 111 Kahului Beach Rd Kahului, HI | 2.0 | 1.5 | 800 | $2,875 | $3.59 | 5d | 1 | 0.01mi |
| 111 Kahului Beach Rd Unit A104 Kahului, HI | 2.0 | 1.5 | 787 | $2,399 | $3.05 | 18d | 1 | 0.02mi |
| 111 Kahului Beach Rd Unit D126 Kahului, HI | 2.0 | 1.5 | 787 | $2,950 | $3.75 | 46d | 1 | 0.02mi |
| 434 Aleo Pl Kahului, HI | 2.0 | 1.0 | 600 | $2,500 | $4.17 | 46d | 1 | 0.55mi |
| 432 Aleo Pl Kahului, HI | 3.0 | 1.0 | 864 | $3,000 | $3.47 | 46d | 1 | 0.55mi |
| 91 Alehela St Kahului, HI | 3.0 | 1.0 | 750 | $2,750 | $3.67 | 19d | 1 | 0.61mi |
| 529 Pio Dr Unit 2 Wailuku, HI | 1.0 | 1.0 | 525 | $1,650 | $3.14 | 46d | 1 | 1.03mi |
| 493 Pio Dr #202 Wailuku, HI | 1.0 | 1.0 | 586 | $2,900 | $4.95 | 26d | 1 | 1.04mi |
| 1063 Lower Main St #402 Wailuku, HI | 2.0 | 1.5 | 757 | $2,800 | $3.70 | 46d | 1 | 1.08mi |
| 1371 Lower Main St Unit 8 Wailuku, HI | 2.0 | 1.0 | 651 | $2,850 | $4.38 | 46d | 1 | 1.18mi |
| 1371 Lower Main St Apt 6 Wailuku, HI | 1.0 | 1.0 | 651 | $2,600 | $3.99 | 19d | 1 | 1.18mi |
| 71 Waiaka Ln Unit 35-204 Wailuku, HI | 3.0 | 2.0 | 980 | $3,450 | $3.52 | 46d | 1 | 1.20mi |
| 33 Waiaka Ln Unit 104 Wailuku, HI | 2.0 | 2.0 | 796 | $3,200 | $4.02 | 0d | 1 | 1.25mi |
| 60 Kapi Ln Unit 15-201 1 Wailuku, HI | 2.0 | 1.0 | 657 | $2,800 | $4.26 | 46d | 1 | 1.29mi |
| 796 Pomaikai St Unit 796 Kahului, HI | 3.0 | 1.0 | 900 | $3,100 | $3.44 | 46d | 1 | 1.45mi |
| 441 Ani St Kahului, HI | 3.0 | 1.5 | 943 | $3,100 | $3.29 | 26d | 1 | 1.47mi |
| 694 Kaae Rd Wailuku, HI | 1.0 | 1.0 | 540 | $2,300 | $4.26 | 26d | 1 | 1.48mi |
HOA detail condo
- Monthly dues
- $1,241 · $14,892/yr
- Assessments
- None detected in remarks — confirm with the listing agent.
Listing history 4 events
-
2026-06-22days on market $149,000 Active 4 DOM
-
2026-06-21days on market $149,000 Active 3 DOM
-
2026-06-19remarks 681-char remark
-
2026-06-19$149,000 Active 1 DOM
ⓘ Source: listings_history table (triggers on properties + properties_extension) + one-shot
backfill from property_details.listing_events for pre-trigger history.
Tax reassessment forecast HI · Partial reset (capped growth)
- Current annual tax
- $1,212 · $101/mo
- Projected year-2 tax
- $1,212 · $101/mo
- Expected delta
- $0/yr ($0/mo · 0.0%)
ⓘ Screening estimate from a state-policy table — verify with the county assessor before closing.
Climate risk First Street
- Flood 1/10 Low FEMA zone VE · 0% chance over 30 yrs
- Air quality 1/10 Low
Nearby sold comps map
Loading sold comps map…
Walkable amenities ~0.75 mi
Loading nearby amenities…
Taxation est. · year 1
- Rental income
- $33,071
- − Mortgage interest
- −$8,346
- − Property taxes
- −$1,212
- − Insurance
- −$8,773
- − Repairs & maintenance
- −$2,646
- − Management
- −$2,646
- − HOA
- −$14,892
- − Depreciation
- −$4,335
- Taxable loss
- −$9,778
- Est. tax savings @ 24.0%
- +$2,347
- After-tax cash flow
- $-5,781/yr
For passive investors: Depreciation is non-cash, so a rental often shows a tax loss while cash-flowing — sheltering income. Rental losses are passive: they offset passive income freely, and up to $25,000/yr can offset ordinary (W-2) income if you actively participate and your MAGI is under $100k (phasing out to $0 by $150k); unused losses carry forward. On sale, claimed depreciation is recaptured at up to 25%, and gains may owe capital-gains tax (a 1031 exchange can defer both). Figures are a year-1 estimate at your 24.0% rate — not tax advice; consult a CPA.
Schools (NCES district)
- District
- Hawaii Department Of Education
- NCES district ID
- 1500030
- Math proficiency
- 32% ▼ -10.00%
- Reading proficiency
- 50% ▼ -3.00%
- Median HH income
- $69,005
- Composite
- 37.07/100
- National rank
- #4504
- State rank
- #1 of 1 in HI
Livability — Kahului
- Score
- 74/100
- State rank
- #17
- US rank
- #4968
Category grades
Schools grade is shown separately in the Schools card above.
Census & demographics
- Census place
- Kahului, HI
- City population
- 25,889
- Population (ZIP)
- 25,889
Population outlook (Maui County) Hauer SSP2
- Today (2025)
- 185,013 people
- By 2030
- 194,315 · +5.0%
- By 2040
- 210,917 · +14.0%
- By 2050
- 226,396 · +22.4%
- By 2075
- 270,475 · +46.2%
- By 2100
- 316,825 · +71.2%
Race, ethnicity, and origin ACS 2023
- Neighborhood character
- Diverse neighborhood (Simpson 0.65)
- Race & ethnicity
- Asian 58% Two or more races 20% White 10% Pacific Islander 8% Hispanic / Latino 6%
- Hispanic origin (detail)
- Mexican 2% Puerto Rican 3%
- Common ancestry
- Russian 3% Subsaharan African 1% Slovak 1%
- Foreign-born
- 33% · Canada, South Korea, Vietnam
- Languages at home
- 65% English-only · Other Asian/Pacific 22% Tagalog/Filipino 11%
Political lean MEDSL · Maui
- 2024 margin
- Strong D (+25.9) · D 61.9% · R 36.0% · Other 2.2%
- 2008→2024 swing
- -29.3pp toward R · 2008: 55.2pp · 2024: 25.9pp
- All cycles
- 2024: D+25.9 2020: D+35.5 2016: D+38.6 2012: D+50.3 2008: D+55.2
Not yet ingested
- Civics
- —
Market trends
- HPI YoY
- ▼ -33.40%
- Current HPI
- 684.5949
- Rent YoY
- —
- Metro
- —
- State GDP YoY
- —
- F500 in state
- 0
Price history
+129.2% since first listed19 events — show timeline
- 2026-06-18 Listed $149,000 RAM MLS
- 2025-11-01 Listing Removed — RAM MLS
- 2025-07-03 Price Changed $249,000 RAM MLS
- 2025-04-21 Listed $280,000 RAM MLS
- 2023-12-28 Sold (MLS) $215,000 RAM MLS
- 2023-12-17 Listed $215,000 RAM MLS
- 2021-01-14 Sold (MLS) $150,000 RAM MLS
- 2020-11-30 Contingent — RAM MLS
- 2020-10-29 Relisted — RAM MLS
- 2020-10-14 Listing Removed — RAM MLS
- 2020-09-16 Price Changed $155,000 RAM MLS
- 2020-02-13 Listed $165,000 RAM MLS
- 2001-10-22 Sold (Public Records) $49,000 Public Records
- 2001-08-21 Sold (Public Records) $49,000 Public Records
- 2001-04-04 Listed $49,000 RAM MLS
- 1999-08-31 Sold (Public Records) $25,100 Public Records
- 1997-04-12 Listing Removed — RAM MLS
- 1996-04-30 Listed $69,000 RAM MLS
- 1996-01-12 Sold (Public Records) $65,000 Public Records
Property tax history
+12.9%/yrLatest (2025): $1,212 · +11.6% YoY. Source: county tax records.
Cash-flow waterfall
monthlySold comps — $/sqft
last 12 mo · ≤1 miLoading sold comps…