1107 W Paris St · Marfa, TX
Flood risk 1/10 · Minimal
- FEMA flood zone
- —
- Chance of flooding over 30 yrs
- 0.0%
- Est. flood insurance / yr
- —
Fire risk 8/10 · Major
- Est. fire insurance / yr
- $1,222 – $2,270
Heat risk 5/10 · Moderate
- Hot days now (above 96°F)
- 6 days/yr
- Hot days in 30 yrs
- 15 days/yr
Wind risk 1/10 · Minimal
- Chance of severe wind over 30 yrs
- —
Air-quality risk 1/10 · Minimal
- Unhealthy air days now
- 0 days/yr
- Unhealthy air days in 30 yrs
- 0 days/yr
Risk factors via First Street. Map © Google.
Why this score? — see what drove the D grade
The composite is a weighted blend of 9 inputs, each scored 0–100. Each bar is that input's sub-score; the figure is the points it added to the 100-point composite (weight × sub-score).
- Cash flow +10.0/30.0
- ARV discount +7.5/15.0
- Appreciation +7.1/10.0
- Schools +4.0/10.0
- Livability +3.7/5.0
- DSCR +2.9/10.0
- Rent growth +2.5/5.0
- Condition / age +2.5/5.0
- 1% rule +1.7/10.0
$299,000
🖨 Deal sheet (PDF) 📄 Offer letter ✓ Due diligence
Listing remarks MLS
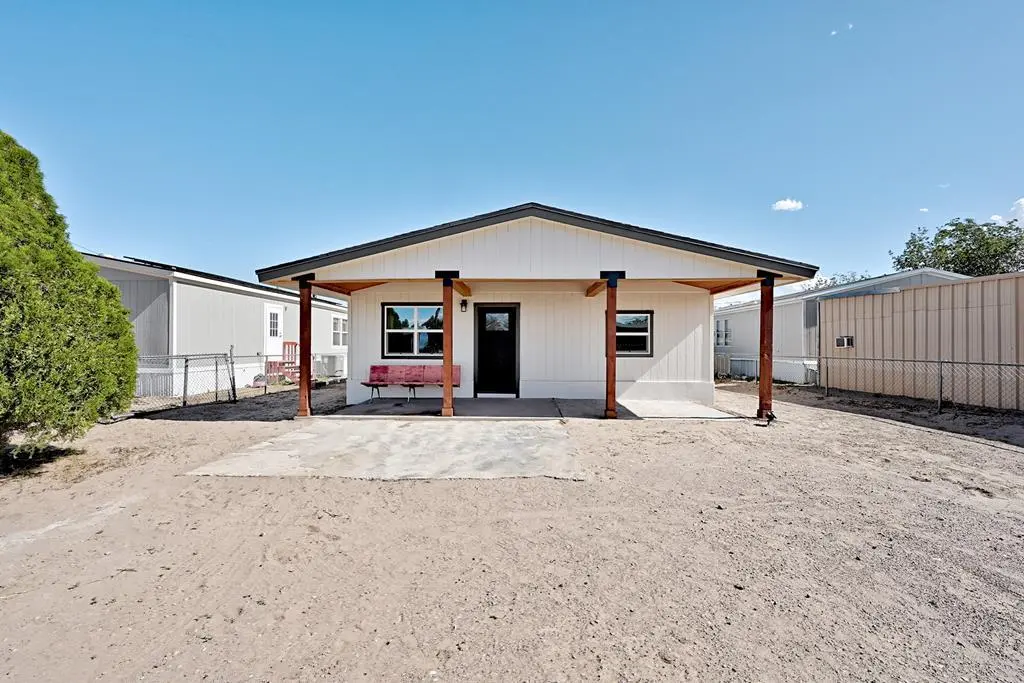
1107 W Paris has just undergone a full renovation, completed in 2025, This cottage in Marfa's West Heights Addition is close to restaurants, the Chinati Foundation, and Pinto Canyon Road which is popular among locals for walking and cycling. A wide north facing porch welcomes you into the bright living room with vaulted ceiling. Move-in ready condition featuring new cabinetry, ductless HVAC, stainless steel appliances, washer/dryer connections, level lot, alley access. Recent private appraisal.
Key facts
- Vaulted ceiling
- North facing porch
- Bright living room
Tags
Neighborhood map
What this means for you Summary
Snapshot
- This is a 2-bed/1.0-bath single-family listed at $299k.
Deal economics
- At list price, monthly cash flow is $-180 ($-2k/yr) — negative.
- To cash-flow at today's rent, offer at most $267k (10.6% below list).
- To meet the 1% rule (rent ≥ 1% of price), the offer needs to be $200k (33.1% below list).
- Recommended offer: $200k (33.1% below list) — sets the bar for 1% rule.
Location & tenants
- Location reads 73/100 on livability (#215 in TX) — a middle-class / working-renter tenant base. Strengths: crime A+, cost of living A+, housing A+; Watch: employment D+, schools D, commute F.
- Marfa ISD (rural): math 45% / reading 45% proficiency, ranked #559 of 1,141 in TX (top 49%) — families likely to look elsewhere, expect single-tenant / working-renter base with shorter leases.
- Market conditions: 79 active listings in the ZIP; 1 comparable units currently listed for rent nearby; 23 units permitted in Presidio County in 2024 (0 in 5+ unit buildings).
Forward outlook
- In year one you build about $15k of equity ($2k loan paydown + $13k appreciation (4.2% local appreciation)).
- Presidio County population projected at -44% by 2050 — secular population decline; favor cash flow + early exit over multi-decade hold.
- By year 3, paydown + projected appreciation supports a ~$36k cash-out refi (75% LTV) — recoverable capital for the next deal without selling this one.
Negotiation context
- It's been on market 334 days — a 12% lower offer ($263k) is reasonable based on typical stale-listing flexibility.
Risks & watch-outs
- Watch-outs: built in 1945 — expect roof / HVAC / electrical / plumbing capex.
- Climate carrying-cost: severe wildfire risk; extreme-heat days projected 6→15/yr by 2055 (HVAC capex compounding) — expect insurance premiums to compound above CPI over the hold.
Questions for the listing agent
- What do current leases actually rent for vs. the listed asking? Can we see a recent rent roll and the last 12 months of T-12 income?
- It's been on market 334 days. Have you received any prior offers? Is the seller open to a 33% concession, seller financing, or rate buy-down credit?
- Built in 1945 — when were the roof, HVAC, electrical panel, plumbing, and water heater last replaced?
- Why hasn't it sold? Are there any deal-killer items the seller is aware of (foundation, flood, title, zoning, code violations)?
- Is there a deadline driving the sale (1031 exchange, divorce, estate, relocation)? That informs how much negotiation room exists.
- Schools are D-rated, which usually means shorter tenancies and higher turnover. Who's the typical renter profile here, and what's been the actual vacancy rate?
- The area grade is low — what's the realistic commute time and amenity access for the typical tenant pool here? Any planned neighborhood developments (good or bad) we should know about?
- What's the average days-on-market for RENTAL listings here right now (not sales)? A rising rental-DOM trend means longer vacancies and softer asking-rent achievability than the comps imply.
- What's the recent tenant-quality profile in this submarket — average credit score on applications, eviction rate, late-payment / NSF rate, and stable-employment percentage? A property-management company in the area should have these aggregated.
- How much new for-sale + rental construction is in the pipeline within 1–3 miles? Heavy new supply typically softens prices + rents 12–24 months out; constrained supply supports both.
Investment metrics
- 1% rule
- 0.67% ✗
- Cap rate
- 5.57%
- Cash-on-cash
- -2.58%
- DSCR
- 0.89
- GRM
- 12.5
CMA / ARV
No comps found within radius.
Projected returns pro-forma
4.23% appreciation · 3.0% rent growth · sell at horizon
- IRR
- 8.6%
- Equity multiple
- 1.53×
- Total profit
- $44,329
- Equity at exit
- $155,631
- IRR
- 10.6%
- Equity multiple
- 2.80×
- Total profit
- $150,368
- Equity at exit
- $257,820
Cash invested: $83,720 (down + closing). Projections, not guarantees.
Landlord ↔ Tenant lean methodology
- Overall (STATE)
- 87 Strongly Landlord-Friendly
- State Texas
- 87 Strongly Landlord-Friendly · R+5
- County
- — inherits STATE
- City
- — inherits STATE
ZIP-level market 79843
- Home prices YoY
- 2.0%
- Active inventory
- 79
- Price-to-rent
- 12.5×
Monthly cashflow live
- Estimated rent
- $2,000 medium interval (Pro) →
- Mortgage (P&I)
- −$1,568
- Tax from tax record
- −$67 /mo · $806/yr
- Insurance
- −$125
- HOA
- −$0
- Vacancy / Maint / Mgmt
- −$420
- Net cashflow
- $-180
Break-even live
Sensitivity live
| Price | -10% $-10 | -5% $-95 | +0% $-180 | +5% $-264 | +10% $-349 |
|---|---|---|---|---|---|
| Rent | -10% $-338 | -5% $-259 | +0% $-180 | +5% $-101 | +10% $-22 |
| Rate | -1.0pp $-29 | -0.5pp $-104 | base $-180 | +0.5pp $-257 | +1.0pp $-336 |
UW: 25.0% down · 7.5% · 30yr · 1.5% tax · 5.0% vac · 8.0% maint · 8.0% mgmt
Financing live
Cash to close
- Down payment
- $74,750
- Closing costs
- $8,970
- Reserves months
- —
- Total cash needed
- —
Loan-product check · same deal, 3 products live
Conventional
25% down · 7.5% · 30yr
- Down + closing
- —
- Monthly P&I
- —
- Monthly cashflow
- —
- DSCR
- —
- Eligible?
- —
Personal DTI + credit; lowest rate.
DSCR
20% down · 8.5% · 30yr
- Down + closing
- —
- Monthly P&I
- —
- Monthly cashflow
- —
- DSCR
- —
- Eligible?
- —
No personal income docs; deal must DSCR.
Hard money
10% down · 12.0% · 12mo
- Down + closing
- —
- Monthly P&I
- —
- Monthly cashflow
- —
- DSCR
- —
- Eligible?
- —
Short-term bridge; refi at stabilization.
Rent comps 1 comps
| Address | Beds | Baths | Sqft | Rent | $/sqft | DOM | Units | Dist |
|---|---|---|---|---|---|---|---|---|
| 104 E Waco St Marfa, TX | 2.0 | 1.0 | 991 | $2,000 | $2.02 | 22d | 1 | 0.78mi |
Listing history 19 events
-
2026-06-21days on market $299,000 Active 334 DOM
-
2026-06-18days on market $299,000 Active 331 DOM
-
2026-06-17days on market $299,000 Active 330 DOM
-
2026-06-16days on market $299,000 Active 329 DOM
-
2026-06-15days on market $299,000 Active 328 DOM
-
2026-06-14days on market $299,000 Active 326 DOM
-
2026-06-10days on market $299,000 Active 323 DOM
-
2026-06-09days on market $299,000 Active 322 DOM
-
2026-06-08days on market $299,000 Active 321 DOM
-
2026-06-07days on market $299,000 Active 320 DOM
-
2026-06-05days on market $299,000 Active 317 DOM
-
2026-06-03days on market $299,000 Active 316 DOM
-
2026-06-02days on market $299,000 Active 315 DOM
-
2026-06-01days on market $299,000 Active 314 DOM
-
2026-05-31days on market $299,000 Active 313 DOM
-
2026-05-31days on market $299,000 Active 312 DOM
-
2026-04-27price $299,000 499-char remark
Show marketing remark (499 chars)
1107 W Paris has just undergone a full renovation, completed in 2025, This cottage in Marfa's West Heights Addition is close to restaurants, the Chinati Foundation, and Pinto Canyon Road which is popular among locals for walking and cycling. A wide north facing porch welcomes you into the bright living room with vaulted ceiling. Move-in ready condition featuring new cabinetry, ductless HVAC, stainless steel appliances, washer/dryer connections, level lot, alley access. Recent private appraisal.
-
2025-07-23$349,000 Active 499-char remark
Show marketing remark (499 chars)
1107 W Paris has just undergone a full renovation, completed in 2025, This cottage in Marfa's West Heights Addition is close to restaurants, the Chinati Foundation, and Pinto Canyon Road which is popular among locals for walking and cycling. A wide north facing porch welcomes you into the bright living room with vaulted ceiling. Move-in ready condition featuring new cabinetry, ductless HVAC, stainless steel appliances, washer/dryer connections, level lot, alley access. Recent private appraisal.
-
2023-04-24soldstatus
ⓘ Source: listings_history table (triggers on properties + properties_extension) + one-shot
backfill from property_details.listing_events for pre-trigger history.
Tax reassessment forecast TX · Resets to sale price
- Current annual tax
- $806 · $67/mo
- Projected year-2 tax
- $5,472 · $456/mo
- Expected delta
- +$4,666/yr (+$389/mo · 578.7%)
ⓘ Screening estimate from a state-policy table — verify with the county assessor before closing.
Climate risk First Street
- Flood 1/10 Low 0% chance over 30 yrs
- Wildfire 8/10 Severe
- Heat 5/10 Major 6 d/yr ≥96°F today · 15 d/yr by 30 yrs out
- Wind 1/10 Low
- Air quality 1/10 Low 0 unhealthy d/yr today · 0 by 30 yrs out
Nearby sold comps map
Loading sold comps map…
Walkable amenities ~0.75 mi
Loading nearby amenities…
Taxation est. · year 1
- Rental income
- $24,000
- − Mortgage interest
- −$16,749
- − Property taxes
- −$806
- − Insurance
- −$1,495
- − Repairs & maintenance
- −$1,920
- − Management
- −$1,920
- − Depreciation
- −$8,698
- Taxable loss
- −$7,588
- Est. tax savings @ 24.0%
- +$1,821
- After-tax cash flow
- $-336/yr
For passive investors: Depreciation is non-cash, so a rental often shows a tax loss while cash-flowing — sheltering income. Rental losses are passive: they offset passive income freely, and up to $25,000/yr can offset ordinary (W-2) income if you actively participate and your MAGI is under $100k (phasing out to $0 by $150k); unused losses carry forward. On sale, claimed depreciation is recaptured at up to 25%, and gains may owe capital-gains tax (a 1031 exchange can defer both). Figures are a year-1 estimate at your 24.0% rate — not tax advice; consult a CPA.
Schools (NCES district)
- District
- Marfa ISD
- NCES district ID
- 4829040
- Math proficiency
- 45% ▲ 10.00%
- Reading proficiency
- 45% ▬ 0.00%
- Median HH income
- $41,354
- Composite
- 40.04/100
- National rank
- #7884
- State rank
- #559 of 1141 in TX
Livability — Marfa
- Score
- 73/100
- State rank
- #215
- US rank
- #5308
Category grades
Schools grade is shown separately in the Schools card above.
Census & demographics
- Census place
- Marfa, TX
- Population (ZIP)
- 2,578
Population outlook (Presidio County) Hauer SSP2
- Today (2025)
- 5,330 people
- By 2030
- 4,671 · -12.4%
- By 2040
- 3,654 · -31.4%
- By 2050
- 3,001 · -43.7%
- By 2075
- 2,326 · -56.4%
- By 2100
- 2,106 · -60.5%
Race, ethnicity, and origin ACS 2023
- Neighborhood character
- Diverse neighborhood (Simpson 0.58)
- Race & ethnicity
- Hispanic / Latino 48% White 44% Two or more races 33% Native American 5%
- Hispanic origin (detail)
- Mexican 45%
- Common ancestry
- Romanian 10% Iranian 2% Lithuanian 2%
- Foreign-born
- 18% · Canada
- Languages at home
- 61% English-only · Spanish 39%
Political lean MEDSL · Presidio
- 2024 margin
- Solid D (+30.2) · D 64.6% · R 34.4%
- 2008→2024 swing
- -13.2pp toward R · 2008: 43.4pp · 2024: 30.2pp
- All cycles
- 2024: D+30.2 2020: D+33.5 2016: D+36.6 2012: D+42.5 2008: D+43.4
Not yet ingested
- Civics
- —
Market trends
- HPI YoY
- ▲ 4.23%
- Current HPI
- 214.5241
- Rent YoY
- —
- Metro
- —
- State GDP YoY
- ▲ 3.95%
- F500 in state
- 110
Industry mix (Fortune 500 HQ in TX)
| Industry | F500 HQs | Revenue |
|---|---|---|
| Energy | 16 | $1,198B |
|
||
| Technology | 5 | $198B |
|
||
| Engineering / Construction | 4 | $72B |
|
||
| Energy Services | 3 | $60B |
|
||
| Utilities | 3 | $41B |
|
||
| Healthcare | 2 | $330B |
|
||
Price history
-14.3% since first listed3 events — show timeline
- 2026-04-27 Price Changed $299,000 ODMLS
- 2025-07-23 Listed $349,000 ODMLS
- 2023-04-24 Sold (Public Records) — Public Records
Property tax history
+1.9%/yrLatest (2025): $806 · +14.1% YoY. Source: county tax records.
Cash-flow waterfall
monthlySold comps — $/sqft
last 12 mo · ≤1 miLoading sold comps…