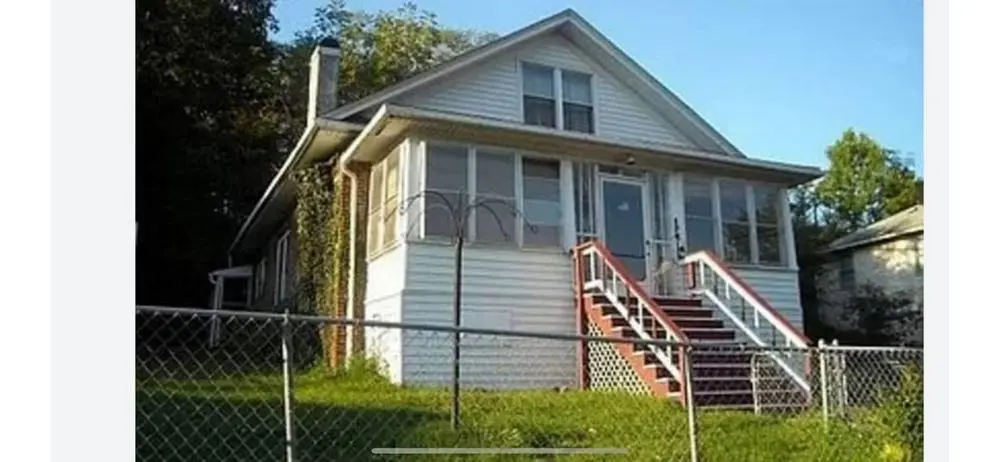
126 Meredith St · Bluefield, VA
Flood risk 1/10 · Minimal
- FEMA flood zone
- X (unshaded)
- Chance of flooding over 30 yrs
- 0.0%
- Est. flood insurance / yr
- $473 – $860
Fire risk 3/10 · Minor
- Est. fire insurance / yr
- $666 – $1,236
Heat risk 3/10 · Minor
- Hot days now (above 90°F)
- 9 days/yr
- Hot days in 30 yrs
- 26 days/yr
Wind risk 2/10 · Minimal
- Chance of severe wind over 30 yrs
- 0.0%
Air-quality risk 1/10 · Minimal
- Unhealthy air days now
- 0 days/yr
- Unhealthy air days in 30 yrs
- 0 days/yr
Risk factors via First Street. Map © Google.
Why this score? — see what drove the C grade
The composite is a weighted blend of 9 inputs, each scored 0–100. Each bar is that input's sub-score; the figure is the points it added to the 100-point composite (weight × sub-score).
- Cash flow +27.7/30.0
- DSCR +9.8/10.0
- 1% rule +6.4/10.0
- Schools +6.0/10.0
- Livability +3.1/5.0
- Rent growth +2.5/5.0
- Condition / age +2.5/5.0
- ARV discount +2.0/15.0
- Appreciation +0.0/10.0
$90,000
🖨 Deal sheet (PDF) 📄 Offer letter ✓ Due diligence
Listing remarks MLS
Oak Trim and Oak French Doors in Living Room. Bedroom on the Main Level. Laundry off of Kitchen in enclosed back porch. New exterior Vinyl and Roof in 2003. Possible Hardwood under vinyl. Double lot for off street parking. Storage Building on back of 2nd lot.
Key facts
- 0.23 acre lot
- Built 1925
- Listed 17 days
Property features AI
Exterior
- Home design: House
- Exterior features: Lot approximately 10,019 sq ft
Neighborhood map
What this means for you Summary
Snapshot
- This is a 2-bed/1.0-bath single-family listed at $90k.
Deal economics
- At list price, monthly cash flow is $272 ($3k/yr) — positive.
- The deal already cash-flows at list — no discount required.
- Meets the 1% rule at list price ($1k rent vs $90k).
- Recommended offer: $89k (1.5% below list) — sets the bar for market timing.
- Cap rate 9.9% vs local median 4.1% in Bluefield — top-decile yield for the area; either an underpriced asset or a hidden risk that comps aren't pricing in. Stress-test before assuming the spread holds.
Location & tenants
- Location reads 62/100 on livability (#408 in VA) — a middle-class / working-renter tenant base. Strengths: cost of living A+, housing A+, schools A-; Watch: employment C-, amenities F, commute F.
- Tazewell County Public School District (town): math 67% / reading 78% proficiency, ranked #21 of 131 in VA (top 16%) — strong family-tenant draw, lease renewals of 3-5y typical.
- Market conditions: 46 active listings in the ZIP; 4 units permitted in Tazewell County in 2024 (0 in 5+ unit buildings).
Forward outlook
- Local home prices are declining (-3.0%/yr); year-one equity from $622 of loan paydown is wiped out by about $3k of value loss. Plan a longer hold.
- Tazewell County population projected at -30% by 2050 — secular population decline; favor cash flow + early exit over multi-decade hold.
- At projected returns (-3.0% appreciation + 3.0% rent growth), your $25k cash investment doubles in ~9 years — after that, you're playing with house money.
Negotiation context
- It's been on market 17 days — a 2% lower offer ($89k) is reasonable based on typical stale-listing flexibility.
- 3 sale attempts since 15y ago with the ask held roughly flat each time — persistent listings suggest the price (not the market) is what's stuck; bring a comps-based counter.
- Current owner paid $40k; list at $90k implies a 125% gain — meaningful room to come down on a strong offer.
Risks & watch-outs
- Watch-outs: built in 1925 — expect roof / HVAC / electrical / plumbing capex.
Questions for the listing agent
- Built in 1925 — when were the roof, HVAC, electrical panel, plumbing, and water heater last replaced?
- Is there a deadline driving the sale (1031 exchange, divorce, estate, relocation)? That informs how much negotiation room exists.
- Schools are A-rated — typically a magnet for longer-tenancy family renters. What's the average tenant stay here, and is there a school-zone premium baked into asking?
- What's the average days-on-market for RENTAL listings here right now (not sales)? A rising rental-DOM trend means longer vacancies and softer asking-rent achievability than the comps imply.
- What's the recent tenant-quality profile in this submarket — average credit score on applications, eviction rate, late-payment / NSF rate, and stable-employment percentage? A property-management company in the area should have these aggregated.
- How much new for-sale + rental construction is in the pipeline within 1–3 miles? Heavy new supply typically softens prices + rents 12–24 months out; constrained supply supports both.
Investment metrics
- 1% rule
- 1.14% ✓
- Cap rate
- 9.92%
- Cash-on-cash
- 12.94%
- DSCR
- 1.58
- GRM
- 7.3
CMA / ARV
- ARV (on-the-fly)
- $80,199
- Comps found
- 3
Show comp detail 3 sales within ~0.75 mi
| Address | Dist | Beds/Ba | Sqft | Sold | Price | $/sf | Match |
|---|---|---|---|---|---|---|---|
| 101 Aden St | 0.20mi | 3/1.0 (+1) | 1,552 (+10%) | 10mo | $75,000 | $48 | 60 |
| 511 Tazewell Ave | 0.58mi | 3/1.5 (+1) | 1,434 (+2%) | 21mo | $82,000 | $57 | 45 |
| 130 Stockton St | 0.59mi | 2/1.0 | 1,517 (+8%) | 22mo | $131,000 | $86 | 41 |
Match score weights: distance 35% · size 25% · config 20% · recency 20%. Top-matched comps best support the ARV.
Projected returns pro-forma
-3.0% appreciation · 3.0% rent growth · sell at horizon
- IRR
- 2.8%
- Equity multiple
- 1.11×
- Total profit
- $2,688
- Equity at exit
- $13,419
- IRR
- 12.3%
- Equity multiple
- 1.97×
- Total profit
- $24,483
- Equity at exit
- $7,782
Cash invested: $25,200 (down + closing). Projections, not guarantees.
Landlord ↔ Tenant lean methodology
- Overall (STATE)
- 55 Moderately Landlord-Leaning
- State Virginia
- 55 Moderately Landlord-Leaning · D+2
- County
- — inherits STATE
- City
- — inherits STATE
ZIP-level market 24605
- Home prices YoY
- -27.8%
- Active inventory
- 46
- Price-to-rent
- 7.3×
Monthly cashflow live
- Estimated rent
- $1,027 medium interval (Pro) →
- Mortgage (P&I)
- −$472
- Tax from tax record
- −$30 /mo · $364/yr
- Insurance
- −$38
- HOA
- −$0
- Vacancy / Maint / Mgmt
- −$216
- Net cashflow
- $272
Break-even live
Sensitivity live
| Price | -10% $323 | -5% $297 | +0% $272 | +5% $246 | +10% $221 |
|---|---|---|---|---|---|
| Rent | -10% $191 | -5% $231 | +0% $272 | +5% $312 | +10% $353 |
| Rate | -1.0pp $317 | -0.5pp $295 | base $272 | +0.5pp $248 | +1.0pp $225 |
UW: 25.0% down · 7.5% · 30yr · 1.5% tax · 5.0% vac · 8.0% maint · 8.0% mgmt
Financing live
Cash to close
- Down payment
- $22,500
- Closing costs
- $2,700
- Reserves months
- —
- Total cash needed
- —
Loan-product check · same deal, 3 products live
Conventional
25% down · 7.5% · 30yr
- Down + closing
- —
- Monthly P&I
- —
- Monthly cashflow
- —
- DSCR
- —
- Eligible?
- —
Personal DTI + credit; lowest rate.
DSCR
20% down · 8.5% · 30yr
- Down + closing
- —
- Monthly P&I
- —
- Monthly cashflow
- —
- DSCR
- —
- Eligible?
- —
No personal income docs; deal must DSCR.
Hard money
10% down · 12.0% · 12mo
- Down + closing
- —
- Monthly P&I
- —
- Monthly cashflow
- —
- DSCR
- —
- Eligible?
- —
Short-term bridge; refi at stabilization.
Listing history 11 events
-
2026-06-21days on market $90,000 Active 17 DOM
-
2026-06-19days on market $90,000 Active 15 DOM
-
2026-06-18days on market $90,000 Active 14 DOM
-
2026-06-17days on market $90,000 Active 13 DOM
-
2026-06-16days on market $90,000 Active 12 DOM
-
2026-06-15days on market $90,000 Active 11 DOM
-
2026-06-14days on market $90,000 Active 9 DOM
-
2026-06-12days on market $90,000 Active 8 DOM
-
2026-06-09days on market $90,000 Active 5 DOM
-
2026-06-08days on market $90,000 Active 4 DOM
-
2026-06-07$90,000 Active 3 DOM
ⓘ Source: listings_history table (triggers on properties + properties_extension) + one-shot
backfill from property_details.listing_events for pre-trigger history.
Tax reassessment forecast VA · Resets to sale price
- Current annual tax
- $364 · $30/mo
- Projected year-2 tax
- $738 · $62/mo
- Expected delta
- +$374/yr (+$31/mo · 102.9%)
ⓘ Screening estimate from a state-policy table — verify with the county assessor before closing.
Climate risk First Street
- Flood 1/10 Low FEMA zone X (unshaded) · 0% chance over 30 yrs
- Wildfire 3/10 Moderate
- Heat 3/10 Moderate 9 d/yr ≥90°F today · 26 d/yr by 30 yrs out
- Wind 2/10 Low 0% chance of damaging wind over 30 yrs
- Air quality 1/10 Low 0 unhealthy d/yr today · 0 by 30 yrs out
Nearby sold comps map
Loading sold comps map…
Walkable amenities ~0.75 mi
Loading nearby amenities…
Taxation est. · year 1
- Rental income
- $12,327
- − Mortgage interest
- −$5,041
- − Property taxes
- −$364
- − Insurance
- −$450
- − Repairs & maintenance
- −$986
- − Management
- −$986
- − Depreciation
- −$2,618
- Taxable income
- $1,881
- Est. tax owed @ 24.0%
- −$451
- After-tax cash flow
- $2,809/yr
For passive investors: Depreciation is non-cash, so a rental often shows a tax loss while cash-flowing — sheltering income. Rental losses are passive: they offset passive income freely, and up to $25,000/yr can offset ordinary (W-2) income if you actively participate and your MAGI is under $100k (phasing out to $0 by $150k); unused losses carry forward. On sale, claimed depreciation is recaptured at up to 25%, and gains may owe capital-gains tax (a 1031 exchange can defer both). Figures are a year-1 estimate at your 24.0% rate — not tax advice; consult a CPA.
Schools (NCES district)
- District
- Tazewell County Public School District
- NCES district ID
- 5103810
- Math proficiency
- 67% ▼ -23.00%
- Reading proficiency
- 78% ▼ -6.00%
- Median HH income
- $37,003
- Composite
- 60.16/100
- National rank
- #865
- State rank
- #21 of 131 in VA
Livability — Bluefield
- Score
- 62/100
- State rank
- #408
- US rank
- #17014
Category grades
Schools grade is shown separately in the Schools card above.
Census & demographics
- Census place
- Bluefield, VA
- Population (ZIP)
- 8,839
Population outlook (Tazewell County) Hauer SSP2
- Today (2025)
- 38,275 people
- By 2030
- 35,719 · -6.7%
- By 2040
- 30,875 · -19.3%
- By 2050
- 26,798 · -30.0%
- By 2075
- 19,286 · -49.6%
- By 2100
- 13,631 · -64.4%
Race, ethnicity, and origin ACS 2023
- Neighborhood character
- Predominantly White (87%)
- Race & ethnicity
- White 87% Black 7% Hispanic / Latino 3% Two or more races 2%
- Common ancestry
- Hispanic 3% Iranian 2% Slovak 1%
- Foreign-born
- 3% · Canada
- Languages at home
- 97% English-only · Spanish 1% Other Indo-European 1%
Political lean MEDSL · Tazewell
- 2024 margin
- Solid R (+68.9) · D 15.3% · R 84.2%
- 2008→2024 swing
- -36.0pp toward R · 2008: -32.9pp · 2024: -68.9pp
- All cycles
- 2024: R+68.9 2020: R+67.2 2016: R+66.3 2012: R+57.5 2008: R+32.9
Not yet ingested
- Civics
- —
Market trends
- HPI YoY
- ▼ -53.91%
- Current HPI
- 140.337
- Rent YoY
- —
- Metro
- —
- State GDP YoY
- ▲ 2.40%
- F500 in state
- 50
Industry mix (Fortune 500 HQ in VA)
| Industry | F500 HQs | Revenue |
|---|---|---|
| Aerospace / Defense | 4 | $236B |
|
||
| Technology / Defense | 3 | $32B |
|
||
| Financial Services | 2 | $176B |
|
||
| Utilities | 2 | $27B |
|
||
| Insurance | 2 | $25B |
|
||
| Technology | 2 | $15B |
|
||
Price history
+80.4% since first listed6 events — show timeline
- 2026-06-04 Listed $90,000 ForSaleByOwner.com
- 2024-08-07 Rental Removed $855 BUILDIUM
- 2024-08-03 Price Changed $855 BUILDIUM
- 2024-08-01 Listed for Rent $900 BUILDIUM
- 2012-05-23 Sold (MLS) $40,000 MTCBOR
- 2011-09-13 Listed $49,900 MTCBOR
Property tax history
+3.1%/yrLatest (2025): $364 · +0.0% YoY. Source: county tax records.
Cash-flow waterfall
monthlySold comps — $/sqft
last 12 mo · ≤1 miLoading sold comps…