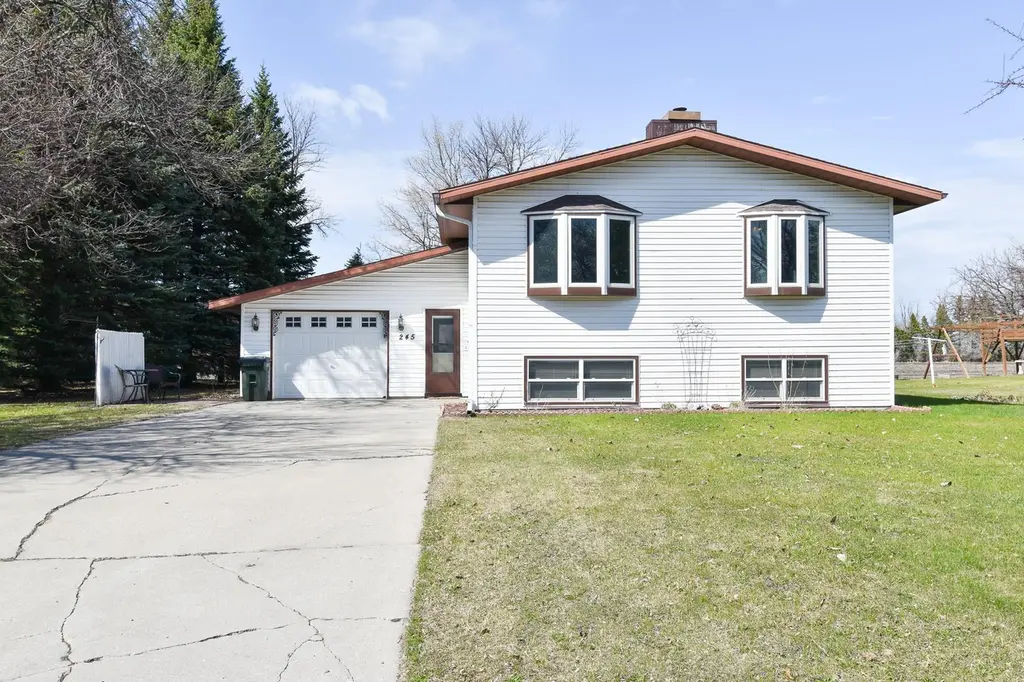
245 E Pleasant Ave · Warren, MN
Flood risk 2/10 · Minimal
- FEMA flood zone
- X (shaded)
- Chance of flooding over 30 yrs
- 0.06%
- Est. flood insurance / yr
- $473 – $860
Fire risk 3/10 · Minor
- Est. fire insurance / yr
- $888 – $1,650
Heat risk 1/10 · Minimal
- Hot days now (above 96°F)
- 7 days/yr
- Hot days in 30 yrs
- 12 days/yr
Wind risk 1/10 · Minimal
- Chance of severe wind over 30 yrs
- —
Air-quality risk 3/10 · Minor
- Unhealthy air days now
- 3 days/yr
- Unhealthy air days in 30 yrs
- 3 days/yr
Risk factors via First Street. Map © Google.
Why this score? — see what drove the F grade
The composite is a weighted blend of 9 inputs, each scored 0–100. Each bar is that input's sub-score; the figure is the points it added to the 100-point composite (weight × sub-score).
- ARV discount +13.9/15.0
- Cash flow +5.7/30.0
- Schools +4.3/10.0
- Livability +3.9/5.0
- Rent growth +2.5/5.0
- Condition / age +2.5/5.0
- 1% rule +0.6/10.0
- DSCR +0.1/10.0
- Appreciation +0.0/10.0
$201,000
🖨 Deal sheet 📄 Offer letter ✓ Due diligence
Listing remarks
Beautiful one owner split level home sitting on an adorable lot in Warren. This home is ready to move right in. Homeowners have taken great care in this home and it is waiting for it's new owners. Vinyl planking in kitchen and dining along with newer carpet in the family room. Call today for your private showing.
Key facts
- 0.3 acre lot
- Garage
- Built 1977
Property features AI
Exterior
- Parking: Attached garage (1 car) — approximately 24 x 18
- Utilities: City water connected; City sewer connected; Electric and natural gas service
- Home design: Residential split-entry (bi-level) home; Public maintained paved city street access; Lot approximately 0.298 acres (100 x 130)
- Construction: Foundation: other (foundation area ~936; foundation dimensions 26 x 36)
- Exterior features: Vinyl exterior; Asphalt roof
Interior
- Kitchen: Range; Refrigerator
- Bedrooms: 4 bedrooms (combination of upper and lower levels)
- Bathrooms: One full bathroom on the main floor; One three-quarter bathroom in the basement
- Heating & cooling: Forced air heating; Ductless mini-split heating and cooling
- Interior features: Finished full basement with sump pump; Informal dining room; Free-standing gas fireplace
- Laundry & utility: Lower-level laundry room
Neighborhood map
What this means for you Summary
Snapshot
- This is a 4-bed/2.0-bath single-family listed at $201k.
Deal economics
- At list price, monthly cash flow is $-415 ($-5k/yr) — negative.
- To cash-flow at today's rent, offer at most $128k (36.5% below list).
- To meet the 1% rule (rent ≥ 1% of price), the offer needs to be $114k (43.5% below list).
- Recommended offer: $114k (43.5% below list) — sets the bar for 1% rule.
Location & tenants
- Location reads 77/100 on livability (#129 in MN, #2,905 nationally) — a middle-class / working-renter tenant base. Strengths: crime A+, cost of living A+, housing A+; Watch: amenities F, commute F.
- Warren-Alvarado-Oslo School District (rural): math 47% / reading 53% proficiency, ranked #118 of 301 in MN (top 39%) — acceptable for families but not a draw, mixed tenant base, ~2y average lease.
- Market conditions: 10 active listings in the ZIP; 9 units permitted in Marshall County in 2024 (0 in 5+ unit buildings).
Forward outlook
- Local home prices are declining (-3.0%/yr); year-one equity from $1k of loan paydown is wiped out by about $6k of value loss. Plan a longer hold.
- Marshall County population projected to shrink 8% by 2050 — rents likely to lag national; underwrite the cash flow, not the appreciation.
Negotiation context
- It's been on market 39 days — a 3% lower offer ($195k) is reasonable based on typical stale-listing flexibility.
- 2 sale attempts since 4y ago with the ask held roughly flat each time — persistent listings suggest the price (not the market) is what's stuck; bring a comps-based counter.
Questions for the listing agent
- What do current leases actually rent for vs. the listed asking? Can we see a recent rent roll and the last 12 months of T-12 income?
- It's been on market 39 days. Have you received any prior offers? Is the seller open to a 44% concession, seller financing, or rate buy-down credit?
- Built in 1977 — when were the roof, HVAC, electrical panel, plumbing, and water heater last replaced?
- Is there a deadline driving the sale (1031 exchange, divorce, estate, relocation)? That informs how much negotiation room exists.
- Schools are B-rated — typically a magnet for longer-tenancy family renters. What's the average tenant stay here, and is there a school-zone premium baked into asking?
- The area grade is low — what's the realistic commute time and amenity access for the typical tenant pool here? Any planned neighborhood developments (good or bad) we should know about?
- What's the average days-on-market for RENTAL listings here right now (not sales)? A rising rental-DOM trend means longer vacancies and softer asking-rent achievability than the comps imply.
- What's the recent tenant-quality profile in this submarket — average credit score on applications, eviction rate, late-payment / NSF rate, and stable-employment percentage? A property-management company in the area should have these aggregated.
- How much new for-sale + rental construction is in the pipeline within 1–3 miles? Heavy new supply typically softens prices + rents 12–24 months out; constrained supply supports both.
Investment metrics
- 1% rule
- 0.56% ✗
- Cap rate
- 3.82%
- Cash-on-cash
- -8.84%
- DSCR
- 0.61
- GRM
- 14.8
CMA / ARV
- ARV (median comp)
- $234,485
- List price
- $201,000
- Delta
- -14.28%
- Verdict
- UNDERPRICED
- Comps
- 7 within 1.0 mi
Show comp detail 1 sale within ~0.75 mi
| Address | Dist | Beds/Ba | Sqft | Sold | Price | $/sf | Match |
|---|---|---|---|---|---|---|---|
| 312 3rd St N | 0.43mi | 3/1.0 (-1) | 1,047 (+12%) | 20mo | $149,000 | $142 | 35 |
Match score weights: distance 35% · size 25% · config 20% · recency 20%. Top-matched comps best support the ARV.
Projected returns pro-forma
-3.0% appreciation · 3.0% rent growth · sell at horizon
- IRR
- -32.0%
- Equity multiple
- -0.05×
- Total profit
- $-59,018
- Equity at exit
- $29,970
- IRR
- -36.9%
- Equity multiple
- -0.52×
- Total profit
- $-85,532
- Equity at exit
- $17,379
Cash invested: $56,280 (down + closing). Projections, not guarantees.
Landlord ↔ Tenant lean methodology
- Overall (STATE)
- 46 Balanced
- State Minnesota
- 46 Balanced · D+2
- County
- — inherits STATE
- City
- — inherits STATE
ZIP-level market 56762
- Home prices YoY
- -14.8%
- Active inventory
- 10
- Price-to-rent
- 14.8×
Monthly cashflow live
- Estimated rent
- $1,135 medium interval (Pro) →
- Mortgage (P&I)
- −$1,054
- Tax from tax record
- −$174 /mo · $2,088/yr
- Insurance
- −$84
- HOA
- −$0
- Vacancy / Maint / Mgmt
- −$238
- Net cashflow
- $-415
Break-even live
UW: 25.0% down · 7.5% · 30yr · 1.5% tax · 5.0% vac · 8.0% maint · 8.0% mgmt
Financing live
Cash to close
- Down payment
- $50,250
- Closing costs
- $6,030
- Reserves months
- —
- Total cash needed
- —
Loan-product check · same deal, 3 products live
Conventional
25% down · 7.5% · 30yr
- Down + closing
- —
- Monthly P&I
- —
- Monthly cashflow
- —
- DSCR
- —
- Eligible?
- —
Personal DTI + credit; lowest rate.
DSCR
20% down · 8.5% · 30yr
- Down + closing
- —
- Monthly P&I
- —
- Monthly cashflow
- —
- DSCR
- —
- Eligible?
- —
No personal income docs; deal must DSCR.
Hard money
10% down · 12.0% · 12mo
- Down + closing
- —
- Monthly P&I
- —
- Monthly cashflow
- —
- DSCR
- —
- Eligible?
- —
Short-term bridge; refi at stabilization.
Listing history 14 events
-
2026-06-13status $201,000 Pending 39 DOM
-
2026-06-10days on market $201,000 Contingent - Inspection 39 DOM
-
2026-06-09days on market $201,000 Contingent - Inspection 38 DOM
-
2026-06-08days on market $201,000 Contingent - Inspection 37 DOM
-
2026-06-07statusdays on market $201,000 Contingent - Inspection 36 DOM
-
2026-06-05days on market $201,000 Active 33 DOM
-
2026-06-03days on market $201,000 Active 32 DOM
-
2026-06-02days on market $201,000 Active 31 DOM
-
2026-06-01days on market $201,000 Active 30 DOM
-
2026-05-31days on market $201,000 Active 29 DOM
-
2026-05-30days on market $201,000 Active 28 DOM
-
2026-05-02$201,000 Active 317-char remark
-
2022-08-18historical
-
2022-07-05$201,000 Active
ⓘ Source: listings_history table (triggers on properties + properties_extension) + one-shot
backfill from property_details.listing_events for pre-trigger history.
Tax reassessment forecast MN · Partial reset (capped growth)
- Current annual tax
- $2,088 · $174/mo
- Projected year-2 tax
- $2,170 · $181/mo
- Expected delta
- +$82/yr (+$7/mo · 3.9%)
ⓘ Screening estimate from a state-policy table — verify with the county assessor before closing.
Climate risk First Street
- Flood 2/10 Low FEMA zone X (shaded) · 6% chance over 30 yrs
- Wildfire 3/10 Moderate
- Heat 1/10 Low 7 d/yr ≥96°F today · 12 d/yr by 30 yrs out
- Wind 1/10 Low
- Air quality 3/10 Moderate 3 unhealthy d/yr today · 3 by 30 yrs out
Nearby sold comps map
Loading sold comps map…
Walkable amenities ~0.75 mi
Loading nearby amenities…
Taxation est. · year 1
- Rental income
- $13,626
- − Mortgage interest
- −$11,259
- − Property taxes
- −$2,088
- − Insurance
- −$1,005
- − Repairs & maintenance
- −$1,090
- − Management
- −$1,090
- − Depreciation
- −$5,847
- Taxable loss
- −$8,754
- Est. tax savings @ 24.0%
- +$2,101
- After-tax cash flow
- $-2,876/yr
For passive investors: Depreciation is non-cash, so a rental often shows a tax loss while cash-flowing — sheltering income. Rental losses are passive: they offset passive income freely, and up to $25,000/yr can offset ordinary (W-2) income if you actively participate and your MAGI is under $100k (phasing out to $0 by $150k); unused losses carry forward. On sale, claimed depreciation is recaptured at up to 25%, and gains may owe capital-gains tax (a 1031 exchange can defer both). Figures are a year-1 estimate at your 24.0% rate — not tax advice; consult a CPA.
Schools (NCES district)
- District
- Warren-Alvarado-Oslo School District
- NCES district ID
- 2700024
- Math proficiency
- 47% ▼ -10.00%
- Reading proficiency
- 53% ▬ 0.00%
- Median HH income
- $54,189
- Composite
- 43.17/100
- National rank
- #3069
- State rank
- #118 of 301 in MN
Livability — Warren
- Score
- 77/100
- State rank
- #129
- US rank
- #2905
Category grades
Schools grade is shown separately in the Schools card above.
Census & demographics
- Census place
- Warren, MN
- Population (ZIP)
- 2,337
Population outlook (Marshall County) Hauer SSP2
- Today (2025)
- 9,191 people
- By 2030
- 9,078 · -1.2%
- By 2040
- 8,815 · -4.1%
- By 2050
- 8,464 · -7.9%
- By 2075
- 8,156 · -11.3%
- By 2100
- 7,171 · -22.0%
Race, ethnicity, and origin ACS 2023
- Neighborhood character
- Predominantly White (93%)
- Race & ethnicity
- White 93% Two or more races 5% Hispanic / Latino 3%
- Common ancestry
- Portuguese 30% Romanian 10% Lithuanian 8%
- Foreign-born
- 1%
- Languages at home
- 98% English-only · Spanish 1%
Political lean MEDSL · Marshall
- 2024 margin
- Solid R (+51.7) · D 23.4% · R 75.1% · Other 1.4%
- 2008→2024 swing
- -52.2pp toward R · 2008: 0.6pp · 2024: -51.7pp
- All cycles
- 2024: R+51.7 2020: R+47.5 2016: R+41.4 2012: R+12.1 2008: D+0.6
Not yet ingested
- Civics
- —
Market trends
- HPI YoY
- ▼ -30.63%
- Current HPI
- 175.639
- Rent YoY
- —
- Metro
- —
- State GDP YoY
- ▲ 2.41%
- F500 in state
- 34
Industry mix (Fortune 500 HQ in MN)
| Industry | F500 HQs | Revenue |
|---|---|---|
| Healthcare | 2 | $407B |
|
||
| Retail | 2 | $150B |
|
||
| Consumer Goods | 2 | $32B |
|
||
| Industrial Machinery | 2 | $6B |
|
||
| Agriculture | 1 | $40B |
|
||
| Healthcare / Medical Devices | 1 | $32B |
|
||
Price history
+0.0% since first listed5 events — show timeline
- 2026-06-10 Pending — NORTHSTARMLS as Distributed by MLS Grid
- 2026-06-06 Contingent — NORTHSTARMLS as Distributed by MLS Grid
- 2026-05-02 Listed $201,000 NORTHSTARMLS as Distributed by MLS Grid
- 2022-08-18 Listing Removed — NORTHSTARMLS as Distributed by MLS Grid
- 2022-07-05 Listed $201,000 NORTHSTARMLS as Distributed by MLS Grid
Property tax history
+4.6%/yrLatest (2026): $2,088 · +0.5% YoY. Source: county tax records.
Cash-flow waterfall
monthlySold comps — $/sqft
last 12 mo · ≤1 miLoading sold comps…