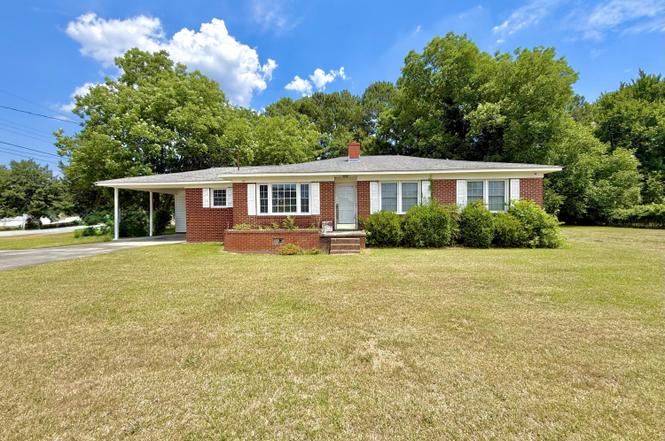
355 Camellia St · Jackson Heights, NC
Flood risk 1/10 · Minimal
- FEMA flood zone
- X (unshaded)
- Chance of flooding over 30 yrs
- 0.0%
- Est. flood insurance / yr
- $507 – $1,088
Fire risk 4/10 · Minor
- Est. fire insurance / yr
- $906 – $1,684
Heat risk 8/10 · Major
- Hot days now (above 106°F)
- 7 days/yr
- Hot days in 30 yrs
- 18 days/yr
Wind risk 8/10 · Major
- Chance of severe wind over 30 yrs
- 80.0%
Air-quality risk 2/10 · Minimal
- Unhealthy air days now
- 1 days/yr
- Unhealthy air days in 30 yrs
- 2 days/yr
Risk factors via First Street. Map © Google.
Why this score? — see what drove the C+ grade
The composite is a weighted blend of 9 inputs, each scored 0–100. Each bar is that input's sub-score; the figure is the points it added to the 100-point composite (weight × sub-score).
- Cash flow +24.8/30.0
- ARV discount +15.0/15.0
- DSCR +8.0/10.0
- 1% rule +6.2/10.0
- Rent growth +2.5/5.0
- Schools +2.5/10.0
- Livability +2.5/5.0
- Condition / age +2.5/5.0
- Appreciation +0.0/10.0
$119,000
🖨 Deal sheet 📄 Offer letter ✓ Due diligence
Listing remarks
Opportunity awaits with this spacious 3-bedroom, 2 bath home situated on a desirable corner lot. Offering approximately +/- 1670 Square feet of living space, this property features an additional office that could serve as a workspace, playroom or flex space to fit your needs. The home's solid brick exterior provides timeless curb appeal, while the generous floor plan offers plenty of potential for customization and updates. Although the property does need repairs, it presents an excellent opportunity for investors, flippers or buyers looking to add their personal touch and build equity. Conveniently located on a corner lot with ample outdoor space, this home is ready for its next chapter. B
Key facts
- Ample outdoor space
- Solid brick exterior
- Additional office
Tags
Property features AI
Exterior
- Parking: Carport (1 space); Concrete parking surface
- Utilities: Public water; Water connected; Septic tank sewer
- Home design: Single-family residence; One story; Entry level: 1
- Construction: Brick and frame construction; Composition roof; Brick/mortar foundation; Built on a crawl space (no basement)
- Exterior features: Deck; Shed(s); Property has a view; No additional exterior features listed
Interior
- Kitchen: Refrigerator; Electric range
- Bedrooms: Total of 10 rooms (bedrooms and living spaces combined)
- Flooring: Carpet; Vinyl; Hardwood
- Bathrooms: Two full bathrooms; One half bathroom
- Heating & cooling: Central air; Ceiling fans; Electric heating; Forced air; Heat pump
- Interior features: Ceiling fans; Window coverings
- Laundry & utility: Washer hookup; Laundry closet; Electric water heater
Neighborhood map
What this means for you Summary
Snapshot
- This is a 3-bed/0.5-bath single-family listed at $119k.
Deal economics
- At list price, monthly cash flow is $253 ($3k/yr) — positive.
- The deal already cash-flows at list — no discount required.
- Meets the 1% rule at list price ($1k rent vs $119k).
Location & tenants
- Location reads 50/100 on livability (#704 in NC) — a working-class tenant base; expect higher turnover. Strengths: cost of living A+, crime A; Watch: amenities F, commute F, employment D-.
- Lenoir County Public Schools (rural): math 29% / reading 32% proficiency, ranked #147 of 178 in NC (top 83%) — families likely to look elsewhere, expect single-tenant / working-renter base with shorter leases; 65% free/reduced lunch — lower-income household profile, screen leases tightly.
- Zoned schools: Moss Hill Elementary (math 40% / reading 43%, grade F, #673 of 1,410 statewide, top 48%, 389 students, 99% FRL); Woodington Middle (math 31% / reading 43%, grade F, #262 of 475 statewide, top 57%, 577 students, 100% FRL); South Lenoir High (math 52% / reading 42%, grade D-, #334 of 535 statewide, top 64%, 771 students, 99% FRL) — zoned schools average 99% FRL vs 65% district-wide (35 pts higher); higher-poverty schools than district average — tighter screening recommended.
- Market conditions: 127 active listings in the ZIP; 148 units permitted in Lenoir County in 2024 (0 in 5+ unit buildings).
Forward outlook
- Local home prices are declining (-3.0%/yr); year-one equity from $823 of loan paydown is wiped out by about $4k of value loss. Plan a longer hold.
- Lenoir County population projected at -18% by 2050 — secular population decline; favor cash flow + early exit over multi-decade hold.
Negotiation context
- Only 2 days on market — expect competitive offers; lowballing is unlikely to land.
Risks & watch-outs
- Watch-outs: built in 1959 — expect roof / HVAC / electrical / plumbing capex.
- Climate carrying-cost: severe wind risk, 80% chance of damaging wind over 30y; extreme-heat days projected 7→18/yr by 2055 (HVAC capex compounding) — expect insurance premiums to compound above CPI over the hold.
Questions for the listing agent
- Built in 1959 — when were the roof, HVAC, electrical panel, plumbing, and water heater last replaced?
- Is there a deadline driving the sale (1031 exchange, divorce, estate, relocation)? That informs how much negotiation room exists.
- Schools are F-rated, which usually means shorter tenancies and higher turnover. Who's the typical renter profile here, and what's been the actual vacancy rate?
- What's the average days-on-market for RENTAL listings here right now (not sales)? A rising rental-DOM trend means longer vacancies and softer asking-rent achievability than the comps imply.
- What's the recent tenant-quality profile in this submarket — average credit score on applications, eviction rate, late-payment / NSF rate, and stable-employment percentage? A property-management company in the area should have these aggregated.
- How much new for-sale + rental construction is in the pipeline within 1–3 miles? Heavy new supply typically softens prices + rents 12–24 months out; constrained supply supports both.
Investment metrics
- 1% rule
- 1.12% ✓
- Cap rate
- 8.84%
- Cash-on-cash
- 9.10%
- DSCR
- 1.40
- GRM
- 7.5
CMA / ARV
- ARV (on-the-fly)
- $156,980
- Comps found
- 7
Show comp detail 7 sales within ~0.75 mi
| Address | Dist | Beds/Ba | Sqft | Sold | Price | $/sf | Match |
|---|---|---|---|---|---|---|---|
| 563 Tyree Rd | 0.12mi | 3/1.5 | 1,602 (-4%) | 3mo | $150,000 | $94 | 82 |
| 222 Orange St | 0.44mi | 3/1.5 | 1,692 (+1%) | 1mo | $242,000 | $143 | 73 |
| 453 Pear St | 0.30mi | 2/2.0 (-1) | 1,654 (-1%) | 16mo | $98,000 | $59 | 60 |
| 203 Camellia St | 0.32mi | 3/1.5 | 1,758 (+5%) | 17mo | $230,000 | $131 | 58 |
| 751 Tyree Rd | 0.31mi | 3/1.5 | 1,883 (+13%) | 8mo | $153,000 | $81 | 53 |
| 2612 Hwy 11 55 | 0.52mi | 3/2.0 | 1,681 (+1%) | 23mo | $326,000 | $194 | 49 |
| 414 Wheat St | 0.47mi | 3/1.5 | 1,438 (-14%) | 5mo | $105,000 | $73 | 47 |
Match score weights: distance 35% · size 25% · config 20% · recency 20%. Top-matched comps best support the ARV.
Projected returns pro-forma
-3.0% appreciation · 3.0% rent growth · sell at horizon
- IRR
- -2.5%
- Equity multiple
- 0.90×
- Total profit
- $-3,183
- Equity at exit
- $17,743
- IRR
- 7.2%
- Equity multiple
- 1.54×
- Total profit
- $17,975
- Equity at exit
- $10,289
Cash invested: $33,320 (down + closing). Projections, not guarantees.
Landlord ↔ Tenant lean methodology
- Overall (STATE)
- 85 Strongly Landlord-Friendly
- State North Carolina
- 85 Strongly Landlord-Friendly · R+3
- County
- — inherits STATE
- City
- — inherits STATE
ZIP-level market 28504
- Home prices YoY
- -12.7%
- Active inventory
- 127
- Price-to-rent
- 7.5×
Monthly cashflow live
- Estimated rent
- $1,330 medium interval (Pro) →
- Mortgage (P&I)
- −$624
- Tax from tax record
- −$125 /mo · $1,496/yr
- Insurance
- −$50
- HOA
- −$0
- Vacancy / Maint / Mgmt
- −$279
- Net cashflow
- $253
Break-even live
UW: 25.0% down · 7.5% · 30yr · 1.5% tax · 5.0% vac · 8.0% maint · 8.0% mgmt
Financing live
Cash to close
- Down payment
- $29,750
- Closing costs
- $3,570
- Reserves months
- —
- Total cash needed
- —
Loan-product check · same deal, 3 products live
Conventional
25% down · 7.5% · 30yr
- Down + closing
- —
- Monthly P&I
- —
- Monthly cashflow
- —
- DSCR
- —
- Eligible?
- —
Personal DTI + credit; lowest rate.
DSCR
20% down · 8.5% · 30yr
- Down + closing
- —
- Monthly P&I
- —
- Monthly cashflow
- —
- DSCR
- —
- Eligible?
- —
No personal income docs; deal must DSCR.
Hard money
10% down · 12.0% · 12mo
- Down + closing
- —
- Monthly P&I
- —
- Monthly cashflow
- —
- DSCR
- —
- Eligible?
- —
Short-term bridge; refi at stabilization.
Listing history 3 events
-
2026-06-19days on market $119,000 Active 2 DOM
-
2026-06-17remarks 699-char remark
-
2026-06-17$119,000 Active 1 DOM
ⓘ Source: listings_history table (triggers on properties + properties_extension) + one-shot
backfill from property_details.listing_events for pre-trigger history.
Tax reassessment forecast NC · Resets to sale price
- Current annual tax
- $1,496 · $125/mo
- Projected year-2 tax
- $1,496 · $125/mo
- Expected delta
- $0/yr ($0/mo · 0.0%)
ⓘ Screening estimate from a state-policy table — verify with the county assessor before closing.
Climate risk First Street
- Flood 1/10 Low FEMA zone X (unshaded) · 0% chance over 30 yrs
- Wildfire 4/10 Moderate
- Heat 8/10 Severe 7 d/yr ≥106°F today · 18 d/yr by 30 yrs out
- Wind 8/10 Severe 80% chance of damaging wind over 30 yrs
- Air quality 2/10 Low 1 unhealthy d/yr today · 2 by 30 yrs out
Nearby sold comps map
Loading sold comps map…
Walkable amenities ~0.75 mi
Loading nearby amenities…
Taxation est. · year 1
- Rental income
- $15,964
- − Mortgage interest
- −$6,666
- − Property taxes
- −$1,496
- − Insurance
- −$595
- − Repairs & maintenance
- −$1,277
- − Management
- −$1,277
- − Depreciation
- −$3,462
- Taxable income
- $1,192
- Est. tax owed @ 24.0%
- −$286
- After-tax cash flow
- $2,747/yr
For passive investors: Depreciation is non-cash, so a rental often shows a tax loss while cash-flowing — sheltering income. Rental losses are passive: they offset passive income freely, and up to $25,000/yr can offset ordinary (W-2) income if you actively participate and your MAGI is under $100k (phasing out to $0 by $150k); unused losses carry forward. On sale, claimed depreciation is recaptured at up to 25%, and gains may owe capital-gains tax (a 1031 exchange can defer both). Figures are a year-1 estimate at your 24.0% rate — not tax advice; consult a CPA.
Schools (NCES district)
- District
- Lenoir County Public Schools
- NCES district ID
- 3702610
- Math proficiency
- 29% ▲ 1.00%
- Reading proficiency
- 32% ▼ -4.00%
- Median HH income
- $34,958
- Composite
- 25.17/100
- National rank
- #7515
- State rank
- #147 of 178 in NC
Livability — Jackson Heights
- Score
- 50/100
- State rank
- #704
- US rank
- #25591
Category grades
Schools grade is shown separately in the Schools card above.
Census & demographics
- Census place
- Jackson Heights, NC
- County
- Lenoir County · 20,407 people
- City population
- 20,325
- Metro
- Kinston, NC
- Population (ZIP)
- 20,407
- Household income
- $53,583
- Rent vs Own
- Severe rent burden
- 575.0
Population outlook (Lenoir County) Hauer SSP2
- Today (2025)
- 55,002 people
- By 2030
- 53,048 · -3.6%
- By 2040
- 49,041 · -10.8%
- By 2050
- 45,136 · -17.9%
- By 2075
- 36,547 · -33.6%
- By 2100
- 27,731 · -49.6%
Race, ethnicity, and origin ACS 2023
- Neighborhood character
- Majority White (59%)
- Race & ethnicity
- White 59% Black 33% Hispanic / Latino 5% Two or more races 4%
- Hispanic origin (detail)
- Mexican 2%
- Common ancestry
- Serbian 1% Lithuanian 1% Italian 1%
- Foreign-born
- 5% · Canada
- Languages at home
- 94% English-only · Spanish 5% Other Asian/Pacific 1% Russian/Polish/Slavic 1%
Political lean MEDSL · Lenoir
- 2024 margin
- Lean R (+6.8) · D 46.2% · R 53.0%
- 2008→2024 swing
- -6.7pp toward R · 2008: -0.1pp · 2024: -6.8pp
- All cycles
- 2024: R+6.8 2020: R+3.5 2016: R+6.3 2012: R+1.5 2008: R+0.1
Not yet ingested
- Civics
- —
Market trends
- HPI YoY
- ▼ -29.45%
- Current HPI
- 201.8226
- Rent YoY
- —
- Metro
- Kinston, NC
- State GDP YoY
- ▲ 3.28%
- F500 in state
- 26
Industry mix (Fortune 500 HQ in NC)
| Industry | F500 HQs | Revenue |
|---|---|---|
| Financial Services | 2 | $213B |
|
||
| Retail | 2 | $95B |
|
||
| Industrial Conglomerate | 1 | $38B |
|
||
| Metals / Steel | 1 | $35B |
|
||
| Utilities | 1 | $30B |
|
||
| Industrial Machinery | 1 | $19B |
|
||
Price history
+900.0% since first listed2 events — show timeline
- 2026-06-17 Price Changed $119,000 Hive MLS
- 2026-06-17 Listed $11,900 Hive MLS
Property tax history
+4.6%/yrLatest (2025): $1,496 · +119.2% YoY. Source: county tax records.
Cash-flow waterfall
monthlySold comps — $/sqft
last 12 mo · ≤1 miLoading sold comps…