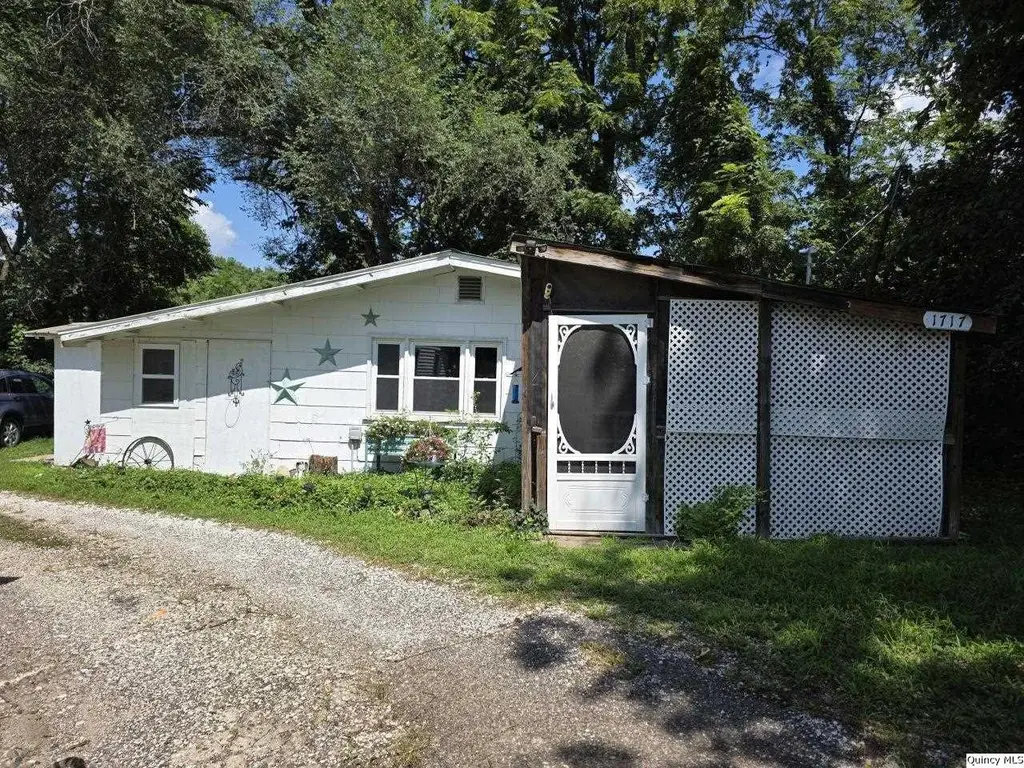
1717 N 4th St · Quincy, IL
Flood risk No data
- FEMA flood zone
- —
- Chance of flooding over 30 yrs
- —
- Est. flood insurance / yr
- —
Fire risk No data
- Est. fire insurance / yr
- —
Heat risk No data
- Hot days now (above threshold)
- —
- Hot days in 30 yrs
- —
Wind risk No data
- Chance of severe wind over 30 yrs
- —
Air-quality risk No data
- Unhealthy air days now
- —
- Unhealthy air days in 30 yrs
- —
Risk factors via First Street. Map © Google.
Why this score? — see what drove the B grade
The composite is a weighted blend of 9 inputs, each scored 0–100. Each bar is that input's sub-score; the figure is the points it added to the 100-point composite (weight × sub-score).
- Cash flow +30.0/30.0
- 1% rule +10.0/10.0
- DSCR +10.0/10.0
- ARV discount +7.5/15.0
- Rent growth +5.0/5.0
- Livability +3.4/5.0
- Condition / age +2.5/5.0
- Schools +2.2/10.0
- Appreciation +0.0/10.0
$32,500
🖨 Deal sheet 📄 Offer letter ✓ Due diligence
Listing remarks MLS
Awesome home located on dead end street. Sits off street and nestled in among the trees. This home has 12x12 Screened patio. Outside storage and 1 car carport, Attached to neighboring garage. Shared city waster with neighboring property. Can also be purchased with 1715 N 4th.
Key facts
- Screened patio
- Outside storage
- Carport
Tags
Neighborhood map
What this means for you Summary
Snapshot
- This is a 2-bed/1.0-bath single-family listed at $32k.
Deal economics
- At list price, monthly cash flow is $728 ($9k/yr) — positive.
- The deal already cash-flows at list — no discount required.
- Meets the 1% rule at list price ($1k rent vs $32k).
- Recommended offer: $29k (12.0% below list) — sets the bar for market timing.
- Cap rate 33.2% vs local median 4.3% in Quincy — top-decile yield for the area; either an underpriced asset or a hidden risk that comps aren't pricing in. Stress-test before assuming the spread holds.
Location & tenants
- Location reads 67/100 on livability (#506 in IL) — a middle-class / working-renter tenant base. Strengths: cost of living A+, housing A+; Watch: schools D+, crime D, employment D.
- Quincy SD 172 (town): math 24% / reading 27% proficiency, ranked #328 of 620 in IL (top 53%) — low school quality limits family demand, transient renter base, plan for 1-2y turnover.
- Market conditions: Rents rising fast (+10.8%/yr); 180 active listings in the ZIP; 3 comparable units currently listed for rent nearby; rentals lingering (median 44d on market — plan ~5-8 weeks vacancy on turnover, expect pricing pressure); 100% of comp listings sitting > 30 days — soft ceiling on asking rent; 68 units permitted in Adams County in 2024 (0 in 5+ unit buildings).
Forward outlook
- Local home prices are declining (-3.0%/yr); year-one equity from $225 of loan paydown is wiped out by about $975 of value loss. Plan a longer hold.
- Adams County population projected at -14% by 2050 — secular population decline; favor cash flow + early exit over multi-decade hold.
- At projected returns (-3.0% appreciation + 8.0% rent growth), your $9k cash investment doubles in ~2 years — after that, you're playing with house money.
Negotiation context
- It's been on market 304 days — a 12% lower offer ($29k) is reasonable based on typical stale-listing flexibility.
- 4 sale attempts with the ask held roughly flat each time — persistent listings suggest the price (not the market) is what's stuck; bring a comps-based counter.
Questions for the listing agent
- It's been on market 304 days. Have you received any prior offers? Is the seller open to a 12% concession, seller financing, or rate buy-down credit?
- Why hasn't it sold? Are there any deal-killer items the seller is aware of (foundation, flood, title, zoning, code violations)?
- Is there a deadline driving the sale (1031 exchange, divorce, estate, relocation)? That informs how much negotiation room exists.
- Schools are D-rated, which usually means shorter tenancies and higher turnover. Who's the typical renter profile here, and what's been the actual vacancy rate?
- Crime grade is D in this area — have there been break-ins, vandalism, or insurance claims at this property in the last 3 years? What carrier currently insures it and at what premium?
- What's the average days-on-market for RENTAL listings here right now (not sales)? A rising rental-DOM trend means longer vacancies and softer asking-rent achievability than the comps imply.
- What's the recent tenant-quality profile in this submarket — average credit score on applications, eviction rate, late-payment / NSF rate, and stable-employment percentage? A property-management company in the area should have these aggregated.
- How much new for-sale + rental construction is in the pipeline within 1–3 miles? Heavy new supply typically softens prices + rents 12–24 months out; constrained supply supports both.
Investment metrics
- 1% rule
- 3.65% ✓
- Cap rate
- 33.17%
- Cash-on-cash
- 95.98%
- DSCR
- 5.27
- GRM
- 2.3
CMA / ARV
- ARV (median comp)
- $76,782
- List price
- $32,500
- Delta
- -60.93%
- Verdict
- UNDERPRICED
- Comps
- 20 within 1.0 mi
Show comp detail 12 sales within ~0.75 mi
| Address | Dist | Beds/Ba | Sqft | Sold | Price | $/sf | Match |
|---|---|---|---|---|---|---|---|
| 1525 N 7th St | 0.30mi | 2/1.0 | 1,160 (+9%) | 3mo | $136,000 | $117 | 68 |
| 218 Sycamore St | 0.32mi | 2/1.0 | 1,108 (+4%) | 13mo | $29,999 | $27 | 68 |
| 1512 N 7th St | 0.34mi | 3/1.0 (+1) | 1,054 (-1%) | 18mo | $80,000 | $76 | 62 |
| 1422 N 3rd | 0.26mi | 3/1.0 (+1) | 1,163 (+9%) | 10mo | $95,000 | $82 | 60 |
| 1418 N 6th | 0.32mi | 2/1.0 | 925 (-13%) | 9mo | $157,000 | $170 | 56 |
| 1014 N 6th St | 0.61mi | 2/1.0 | 1,090 (+2%) | 14mo | $93,000 | $85 | 56 |
| 629 Cherry St | 0.60mi | 2/1.0 | 1,001 (-6%) | 10mo | $48,000 | $48 | 54 |
| 1335 N 10th St | 0.60mi | 2/1.0 | 1,075 (+1%) | 22mo | $85,000 | $79 | 52 |
| 304 Chestnut St | 0.65mi | 2/1.5 | 984 (-7%) | 6mo | $45,000 | $46 | 50 |
| 1318 N 10th St | 0.63mi | 2/2.5 | 1,180 (+11%) | 6mo | $92,500 | $78 | 41 |
| 1220 N 7th St | 0.51mi | 3/1.0 (+1) | 912 (-14%) | 16mo | $80,000 | $88 | 34 |
| 1121 N 10th St | 0.72mi | 3/1.5 (+1) | 1,164 (+10%) | 17mo | $106,000 | $91 | 29 |
Match score weights: distance 35% · size 25% · config 20% · recency 20%. Top-matched comps best support the ARV.
Projected returns pro-forma
-3.0% appreciation · 8.0% rent growth · sell at horizon
- IRR
- —
- Equity multiple
- 6.20×
- Total profit
- $47,362
- Equity at exit
- $4,846
- IRR
- —
- Equity multiple
- 15.23×
- Total profit
- $129,469
- Equity at exit
- $2,810
Cash invested: $9,100 (down + closing). Projections, not guarantees.
Landlord ↔ Tenant lean methodology
- Overall (STATE)
- 43 Moderately Tenant-Leaning
- State Illinois
- 43 Moderately Tenant-Leaning · D+7
- County
- — inherits STATE
- City
- — inherits STATE
ZIP-level market 62301
- Rents YoY
- 10.8%
- Active inventory
- 180
- Price-to-rent
- 2.3×
Monthly cashflow live
- Estimated rent
- $1,185 medium interval (Pro) →
- Mortgage (P&I)
- −$170
- Tax from tax record
- −$24 /mo · $291/yr
- Insurance
- −$14
- HOA
- −$0
- Vacancy / Maint / Mgmt
- −$249
- Net cashflow
- $728
Break-even live
UW: 25.0% down · 7.5% · 30yr · 1.5% tax · 5.0% vac · 8.0% maint · 8.0% mgmt
Financing live
Cash to close
- Down payment
- $8,125
- Closing costs
- $975
- Reserves months
- —
- Total cash needed
- —
Loan-product check · same deal, 3 products live
Conventional
25% down · 7.5% · 30yr
- Down + closing
- —
- Monthly P&I
- —
- Monthly cashflow
- —
- DSCR
- —
- Eligible?
- —
Personal DTI + credit; lowest rate.
DSCR
20% down · 8.5% · 30yr
- Down + closing
- —
- Monthly P&I
- —
- Monthly cashflow
- —
- DSCR
- —
- Eligible?
- —
No personal income docs; deal must DSCR.
Hard money
10% down · 12.0% · 12mo
- Down + closing
- —
- Monthly P&I
- —
- Monthly cashflow
- —
- DSCR
- —
- Eligible?
- —
Short-term bridge; refi at stabilization.
Rent comps 3 comps
| Address | Beds | Baths | Sqft | Rent | $/sqft | DOM | Units | Dist |
|---|---|---|---|---|---|---|---|---|
| 116 N 3rd St Quincy, IL | 1.0–4.0 | 1.0–2.0 | 1950 | $3,067 | $1.57 | 43d | 12 | 1.35mi |
| 115 N 8th St Unit 1/2-5 Quincy, IL | 2.0 | 1.0 | 750 | $475 | $0.63 | 43d | 1 | 1.40mi |
| 500 Maine St Quincy, IL | 1.0 | 1.0 | 937 | $700 | $0.75 | 43d | 1 | 1.41mi |
Listing history 22 events
-
2026-06-19days on market $32,500 Active 304 DOM
-
2026-06-18days on market $32,500 Active 303 DOM
-
2026-06-17days on market $32,500 Active 302 DOM
-
2026-06-16days on market $32,500 Active 301 DOM
-
2026-06-15days on market $32,500 Active 300 DOM
-
2026-06-14days on market $32,500 Active 298 DOM
-
2026-06-12pricedays on market $32,500 Active 297 DOM
-
2026-06-09days on market $30,000 Active 294 DOM
-
2026-06-08days on market $30,000 Active 293 DOM
-
2026-06-07days on market $30,000 Active 292 DOM
-
2026-06-03days on market $30,000 Active 288 DOM
-
2026-06-02days on market $30,000 Active 287 DOM
-
2026-06-01days on market $30,000 Active 286 DOM
-
2026-05-31days on market $30,000 Active 285 DOM
-
2026-05-30days on market $30,000 Active 284 DOM
-
2026-01-08historical
-
2026-01-08status Active
-
2026-01-06historical
-
2026-01-05historical
-
2025-08-19$32,500 Active 276-char remark
Show marketing remark (276 chars)
Awesome home located on dead end street. Sits off street and nestled in among the trees. This home has 12x12 Screened patio. Outside storage and 1 car carport, Attached to neighboring garage. Shared city waster with neighboring property. Can also be purchased with 1715 N 4th.
-
2025-08-17Active
-
2025-08-17$32,500 Active
ⓘ Source: listings_history table (triggers on properties + properties_extension) + one-shot
backfill from property_details.listing_events for pre-trigger history.
Tax reassessment forecast IL · Partial reset (capped growth)
- Current annual tax
- $291 · $24/mo
- Projected year-2 tax
- $514 · $43/mo
- Expected delta
- +$223/yr (+$19/mo · 76.8%)
ⓘ Screening estimate from a state-policy table — verify with the county assessor before closing.
Nearby sold comps map
Loading sold comps map…
Walkable amenities ~0.75 mi
Loading nearby amenities…
Taxation est. · year 1
- Rental income
- $14,219
- − Mortgage interest
- −$1,821
- − Property taxes
- −$291
- − Insurance
- −$162
- − Repairs & maintenance
- −$1,138
- − Management
- −$1,138
- − Depreciation
- −$945
- Taxable income
- $8,725
- Est. tax owed @ 24.0%
- −$2,094
- After-tax cash flow
- $6,641/yr
For passive investors: Depreciation is non-cash, so a rental often shows a tax loss while cash-flowing — sheltering income. Rental losses are passive: they offset passive income freely, and up to $25,000/yr can offset ordinary (W-2) income if you actively participate and your MAGI is under $100k (phasing out to $0 by $150k); unused losses carry forward. On sale, claimed depreciation is recaptured at up to 25%, and gains may owe capital-gains tax (a 1031 exchange can defer both). Figures are a year-1 estimate at your 24.0% rate — not tax advice; consult a CPA.
Schools (NCES district)
- District
- Quincy SD 172
- NCES district ID
- 1733000
- Math proficiency
- 24% ▬ 0.00%
- Reading proficiency
- 27% ▬ 0.00%
- Median HH income
- $44,132
- Composite
- 21.91/100
- National rank
- #8229
- State rank
- #328 of 620 in IL
Livability — Quincy
- Score
- 67/100
- State rank
- #506
- US rank
- #10458
Category grades
Schools grade is shown separately in the Schools card above.
Census & demographics
- Census place
- Quincy, IL
- County
- Adams County · 30,746 people
- City population
- 30,746
- Metro
- Quincy, IL-MO
- Population (ZIP)
- 30,746
- Household income
- $52,055
- Rent vs Own
- Severe rent burden
- 1238.0
Population outlook (Adams County) Hauer SSP2
- Today (2025)
- 65,795 people
- By 2030
- 64,436 · -2.1%
- By 2040
- 61,007 · -7.3%
- By 2050
- 56,851 · -13.6%
- By 2075
- 46,424 · -29.4%
- By 2100
- 34,305 · -47.9%
Race, ethnicity, and origin ACS 2023
- Neighborhood character
- Predominantly White (84%)
- Race & ethnicity
- White 84% Two or more races 7% Black 6% Hispanic / Latino 3% Asian 1%
- Common ancestry
- Slovak 2% Iranian 1% Lithuanian 1%
- Foreign-born
- 2% · Canada
- Languages at home
- 96% English-only · Spanish 2%
Political lean MEDSL · Adams
- 2024 margin
- Solid R (+47.4) · D 25.6% · R 73.0% · Other 1.5%
- 2008→2024 swing
- -25.0pp toward R · 2008: -22.4pp · 2024: -47.4pp
- All cycles
- 2024: R+47.4 2020: R+46.5 2016: R+47.5 2012: R+35.2 2008: R+22.4
Not yet ingested
- Civics
- —
Market trends
- HPI YoY
- ▼ -121.44%
- Current HPI
- 131.7344
- Rent YoY
- ▲ 10.78%
- Metro
- Quincy, IL-MO
- State GDP YoY
- ▲ 1.59%
- F500 in state
- 60
Industry mix (Fortune 500 HQ in IL)
| Industry | F500 HQs | Revenue |
|---|---|---|
| Insurance | 4 | $201B |
|
||
| Consumer Goods | 4 | $87B |
|
||
| Industrial Machinery | 3 | $64B |
|
||
| Healthcare | 2 | $55B |
|
||
| Retail / Pharmacy | 1 | $148B |
|
||
| Agriculture / Food | 1 | $86B |
|
||
Price history
+0.0% since first listed7 events — show timeline
- 2026-01-08 Listing Removed — MRED as Distributed by MLS Grid
- 2026-01-08 Relisted — MRED as Distributed by MLS Grid
- 2026-01-06 Listing Removed — RMLSA as Distributed by MLS Grid
- 2026-01-05 Listing Removed — MRED as Distributed by MLS Grid
- 2025-08-19 Listed $32,500 Quincy AOR
- 2025-08-17 Listed $32,500 MRED as Distributed by MLS Grid
- 2025-08-17 Listed — RMLSA as Distributed by MLS Grid
Property tax history
-8.4%/yrLatest (2017): $291 · +2.1% YoY. Source: county tax records.
Cash-flow waterfall
monthlySold comps — $/sqft
last 12 mo · ≤1 miLoading sold comps…