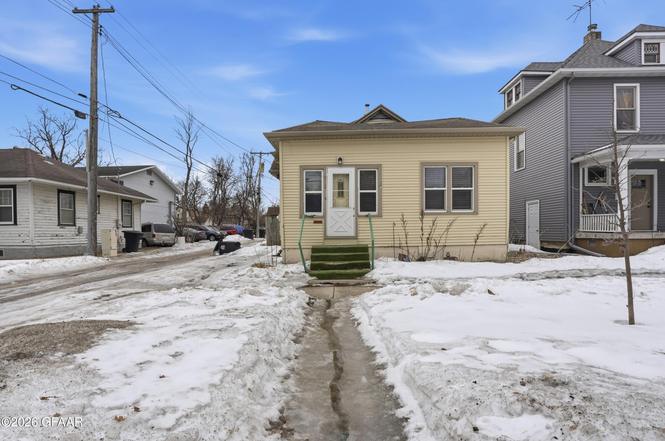
513 3rd Ave S · Grand Forks, ND
Flood risk 1/10 · Minimal
- FEMA flood zone
- X
- Chance of flooding over 30 yrs
- 0.0%
- Est. flood insurance / yr
- $473 – $860
Fire risk 1/10 · Minimal
- Est. fire insurance / yr
- $1,289 – $2,393
Heat risk 2/10 · Minimal
- Hot days now (above 96°F)
- 7 days/yr
- Hot days in 30 yrs
- 12 days/yr
Wind risk 1/10 · Minimal
- Chance of severe wind over 30 yrs
- —
Air-quality risk 4/10 · Minor
- Unhealthy air days now
- 4 days/yr
- Unhealthy air days in 30 yrs
- 4 days/yr
Risk factors via First Street. Map © Google.
Why this score? — see what drove the C- grade
The composite is a weighted blend of 9 inputs, each scored 0–100. Each bar is that input's sub-score; the figure is the points it added to the 100-point composite (weight × sub-score).
- Cash flow +15.2/30.0
- ARV discount +15.0/15.0
- Rent growth +4.8/5.0
- DSCR +4.7/10.0
- 1% rule +4.0/10.0
- Livability +3.9/5.0
- Schools +3.6/10.0
- Condition / age +2.5/5.0
- Appreciation +0.0/10.0
$119,900
🖨 Deal sheet (PDF) 📄 Offer letter ✓ Due diligence
Key facts
- Stained-glass window
- Fenced yard
- Remodeled kitchen
Tags
Property features AI
Exterior
- Utilities: Public water
- Home design: Single-family residence; One level
- Construction: Brick/mortar foundation
- Exterior features: Fenced yard
Interior
- Bedrooms: 6 total rooms (includes bedrooms and other living spaces)
- Bathrooms: 1 full bathroom
- Heating & cooling: Hot water heating
- Interior features: Full basement
Neighborhood map
What this means for you Summary
Snapshot
- This is a 1-bed/1.0-bath single-family listed at $120k.
Deal economics
- At list price, monthly cash flow is $42 ($501/yr) — positive.
- The deal already cash-flows at list — no discount required.
- To meet the 1% rule (rent ≥ 1% of price), the offer needs to be $108k (9.8% below list).
- Recommended offer: $108k (9.8% below list) — sets the bar for 1% rule.
- Cap rate 6.7% vs local median 2.2% in Grand Forks — top-decile yield for the area; either an underpriced asset or a hidden risk that comps aren't pricing in. Stress-test before assuming the spread holds.
Location & tenants
- Location reads 78/100 on livability (#8 in ND, #2,645 nationally) — a middle-class / working-renter tenant base. Strengths: cost of living A+, housing A+, health & safety A+; Watch: employment C-, crime D+.
- Grand Forks 1 (urban): math 37% / reading 49% proficiency, ranked #27 of 53 in ND (top 51%) — families likely to look elsewhere, expect single-tenant / working-renter base with shorter leases.
- Zoned schools: Phoenix Elementary School (math 37% / reading 42%, grade F, #137 of 236 statewide, top 63%, 260 students, 45% FRL); Valley Middle School (math 22% / reading 40%, grade F, #31 of 35 statewide, top 88%, 513 students, 56% FRL); Central High School (math 29% / reading 56%, grade F, #48 of 144 statewide, top 33%, 1,093 students, 32% FRL) — zoned schools average 45% FRL vs 29% district-wide (16 pts higher); higher-poverty schools than district average — tighter screening recommended.
- Market conditions: Rents rising fast (+9.3%/yr); 284 active listings in the ZIP; 2 comparable units currently listed for rent nearby; 133 units permitted in Grand Forks County in 2024 (0 in 5+ unit buildings).
Forward outlook
- Local home prices are declining (-3.0%/yr); year-one equity from $829 of loan paydown is wiped out by about $4k of value loss. Plan a longer hold.
- Grand Forks County population projected at +43% by 2050 — long-run rental-demand tailwind backs the buy-and-hold thesis.
Negotiation context
- It's been on market 101 days — a 9% lower offer ($109k) is reasonable based on typical stale-listing flexibility.
Risks & watch-outs
- Watch-outs: built in 1900 — expect roof / HVAC / electrical / plumbing capex.
Questions for the listing agent
- It's been on market 101 days. Have you received any prior offers? Is the seller open to a 10% concession, seller financing, or rate buy-down credit?
- Built in 1900 — when were the roof, HVAC, electrical panel, plumbing, and water heater last replaced?
- Why hasn't it sold? Are there any deal-killer items the seller is aware of (foundation, flood, title, zoning, code violations)?
- Is there a deadline driving the sale (1031 exchange, divorce, estate, relocation)? That informs how much negotiation room exists.
- Schools are B-rated — typically a magnet for longer-tenancy family renters. What's the average tenant stay here, and is there a school-zone premium baked into asking?
- Crime grade is D in this area — have there been break-ins, vandalism, or insurance claims at this property in the last 3 years? What carrier currently insures it and at what premium?
- What's the average days-on-market for RENTAL listings here right now (not sales)? A rising rental-DOM trend means longer vacancies and softer asking-rent achievability than the comps imply.
- What's the recent tenant-quality profile in this submarket — average credit score on applications, eviction rate, late-payment / NSF rate, and stable-employment percentage? A property-management company in the area should have these aggregated.
- How much new for-sale + rental construction is in the pipeline within 1–3 miles? Heavy new supply typically softens prices + rents 12–24 months out; constrained supply supports both.
Investment metrics
- 1% rule
- 0.90% ✗
- Cap rate
- 6.71%
- Cash-on-cash
- 1.49%
- DSCR
- 1.07
- GRM
- 9.2
CMA / ARV
- ARV (on-the-fly)
- $191,364
- Comps found
- 12
Show comp detail 12 sales within ~0.75 mi
| Address | Dist | Beds/Ba | Sqft | Sold | Price | $/sf | Match |
|---|---|---|---|---|---|---|---|
| 701 Cottonwood St | 0.29mi | 2/1.0 (+1) | 832 (-4%) | 1mo | $229,000 | $275 | 75 |
| 1007 2nd Ave N | 0.41mi | 2/1.0 (+1) | 851 (-1%) | 6mo | $100,000 | $118 | 69 |
| 1015 2nd Ave N | 0.43mi | 2/1.5 (+1) | 823 (-4%) | 8mo | $145,000 | $176 | 59 |
| 716 6th Ave N | 0.64mi | 2/1.0 (+1) | 902 (+5%) | 1mo | $189,999 | $211 | 57 |
| 1208 Walnut St | 0.65mi | 2/1.0 (+1) | 920 (+7%) | 0mo | $199,000 | $216 | 53 |
| 906 Oak St | 0.51mi | 2/1.0 (+1) | 796 (-8%) | 11mo | $234,900 | $295 | 50 |
| 1101 Cherry St | 0.59mi | 2/1.0 (+1) | 768 (-11%) | 0mo | $180,000 | $234 | 49 |
| 902 Oak St | 0.50mi | 2/1.5 (+1) | 896 (+4%) | 17mo | $193,500 | $216 | 49 |
| 1315 5th Ave N | 0.70mi | 2/1.0 (+1) | 880 (+2%) | 16mo | $195,000 | $222 | 45 |
| 621 10th Ave S | 0.53mi | 2/1.0 (+1) | 756 (-12%) | 14mo | $155,000 | $205 | 38 |
| 1002 9th St S | 0.60mi | 2/2.0 (+1) | 960 (+11%) | 11mo | $249,900 | $260 | 35 |
| 1323 1st Ave N | 0.63mi | 2/2.0 (+1) | 736 (-15%) | 14mo | $175,000 | $238 | 25 |
Match score weights: distance 35% · size 25% · config 20% · recency 20%. Top-matched comps best support the ARV.
Projected returns pro-forma
-3.0% appreciation · 8.0% rent growth · sell at horizon
- IRR
- -8.5%
- Equity multiple
- 0.67×
- Total profit
- $-11,046
- Equity at exit
- $17,877
- IRR
- 6.5%
- Equity multiple
- 1.59×
- Total profit
- $19,847
- Equity at exit
- $10,367
Cash invested: $33,572 (down + closing). Projections, not guarantees.
Landlord ↔ Tenant lean methodology
- Overall (STATE)
- 82 Strongly Landlord-Friendly
- State North Dakota
- 82 Strongly Landlord-Friendly · R+20
- County
- — inherits STATE
- City
- — inherits STATE
ZIP-level market 58201
- Rents YoY
- 9.3%
- Active inventory
- 284
- Price-to-rent
- 9.2×
Monthly cashflow live
- Estimated rent
- $1,081 medium interval (Pro) →
- Mortgage (P&I)
- −$629
- Tax from tax record
- −$134 /mo · $1,606/yr
- Insurance
- −$50
- HOA
- −$0
- Vacancy / Maint / Mgmt
- −$227
- Net cashflow
- $42
Break-even live
Sensitivity live
| Price | -10% $110 | -5% $76 | +0% $42 | +5% $8 | +10% $-26 |
|---|---|---|---|---|---|
| Rent | -10% $-44 | -5% $-1 | +0% $42 | +5% $85 | +10% $127 |
| Rate | -1.0pp $102 | -0.5pp $72 | base $42 | +0.5pp $11 | +1.0pp $-21 |
UW: 25.0% down · 7.5% · 30yr · 1.5% tax · 5.0% vac · 8.0% maint · 8.0% mgmt
Financing live
Cash to close
- Down payment
- $29,975
- Closing costs
- $3,597
- Reserves months
- —
- Total cash needed
- —
Loan-product check · same deal, 3 products live
Conventional
25% down · 7.5% · 30yr
- Down + closing
- —
- Monthly P&I
- —
- Monthly cashflow
- —
- DSCR
- —
- Eligible?
- —
Personal DTI + credit; lowest rate.
DSCR
20% down · 8.5% · 30yr
- Down + closing
- —
- Monthly P&I
- —
- Monthly cashflow
- —
- DSCR
- —
- Eligible?
- —
No personal income docs; deal must DSCR.
Hard money
10% down · 12.0% · 12mo
- Down + closing
- —
- Monthly P&I
- —
- Monthly cashflow
- —
- DSCR
- —
- Eligible?
- —
Short-term bridge; refi at stabilization.
Rent comps 2 comps
| Address | Beds | Baths | Sqft | Rent | $/sqft | DOM | Units | Dist |
|---|---|---|---|---|---|---|---|---|
| 33 S 3rd St Grand Forks, ND | 1.0 | 1.0 | 740 | $925 | $1.25 | 45d | 1 | 0.45mi |
| 214 N 4th St Grand Forks, ND | 3.0 | 1.0–2.0 | 974 | $1,448 | $1.49 | 45d | 1 | 0.52mi |
Listing history 20 events
-
2026-06-19days on market $119,900 Active 101 DOM
-
2026-06-18days on market $119,900 Active 100 DOM
-
2026-06-17days on market $119,900 Active 99 DOM
-
2026-06-16days on market $119,900 Active 98 DOM
-
2026-06-15days on market $119,900 Active 97 DOM
-
2026-06-14days on market $119,900 Active 95 DOM
-
2026-06-13days on market $119,900 Active 94 DOM
-
2026-06-10days on market $119,900 Active 92 DOM
-
2026-06-09days on market $119,900 Active 91 DOM
-
2026-06-08days on market $119,900 Active 90 DOM
-
2026-06-07days on market $119,900 Active 89 DOM
-
2026-06-05days on market $119,900 Active 86 DOM
-
2026-06-03days on market $119,900 Active 85 DOM
-
2026-06-02days on market $119,900 Active 84 DOM
-
2026-06-01days on market $119,900 Active 83 DOM
-
2026-05-31days on market $119,900 Active 82 DOM
-
2026-05-30days on market $119,900 Active 81 DOM
-
2026-03-25price $119,900
-
2026-03-10$129,900 Active
-
1998-05-20soldstatus
ⓘ Source: listings_history table (triggers on properties + properties_extension) + one-shot
backfill from property_details.listing_events for pre-trigger history.
Tax reassessment forecast ND · Resets to sale price
- Current annual tax
- $1,606 · $134/mo
- Projected year-2 tax
- $1,606 · $134/mo
- Expected delta
- $0/yr ($0/mo · 0.0%)
ⓘ Screening estimate from a state-policy table — verify with the county assessor before closing.
Climate risk First Street
- Flood 1/10 Low FEMA zone X · 0% chance over 30 yrs
- Wildfire 1/10 Low
- Heat 2/10 Low 7 d/yr ≥96°F today · 12 d/yr by 30 yrs out
- Wind 1/10 Low
- Air quality 4/10 Moderate 4 unhealthy d/yr today · 4 by 30 yrs out
Nearby sold comps map
Loading sold comps map…
Walkable amenities ~0.75 mi
Loading nearby amenities…
Taxation est. · year 1
- Rental income
- $12,977
- − Mortgage interest
- −$6,716
- − Property taxes
- −$1,606
- − Insurance
- −$600
- − Repairs & maintenance
- −$1,038
- − Management
- −$1,038
- − Depreciation
- −$3,488
- Taxable loss
- −$1,509
- Est. tax savings @ 24.0%
- +$362
- After-tax cash flow
- $864/yr
For passive investors: Depreciation is non-cash, so a rental often shows a tax loss while cash-flowing — sheltering income. Rental losses are passive: they offset passive income freely, and up to $25,000/yr can offset ordinary (W-2) income if you actively participate and your MAGI is under $100k (phasing out to $0 by $150k); unused losses carry forward. On sale, claimed depreciation is recaptured at up to 25%, and gains may owe capital-gains tax (a 1031 exchange can defer both). Figures are a year-1 estimate at your 24.0% rate — not tax advice; consult a CPA.
Schools (NCES district)
- District
- Grand Forks 1
- NCES district ID
- 3808130
- Math proficiency
- 37% ▼ -8.00%
- Reading proficiency
- 49% ▲ 1.00%
- Median HH income
- $44,234
- Composite
- 36.39/100
- National rank
- #4681
- State rank
- #27 of 53 in ND
Livability — Grand Forks
- Score
- 78/100
- State rank
- #8
- US rank
- #2645
Category grades
Schools grade is shown separately in the Schools card above.
Census & demographics
- Census place
- Grand Forks, ND
- County
- Grand Forks County · 58,851 people
- City population
- 58,851
- Metro
- Grand Forks, ND-MN
- Population (ZIP)
- 42,373
- Household income
- $68,143
- Rent vs Own
- Severe rent burden
- 2110.0
Population outlook (Grand Forks County) Hauer SSP2
- Today (2025)
- 80,606 people
- By 2030
- 86,489 · +7.3%
- By 2040
- 99,506 · +23.4%
- By 2050
- 115,269 · +43.0%
- By 2075
- 171,303 · +112.5%
- By 2100
- 238,330 · +195.7%
Race, ethnicity, and origin ACS 2023
- Neighborhood character
- Predominantly White (82%)
- Race & ethnicity
- White 82% Two or more races 7% Hispanic / Latino 5% Black 4% Asian 2% Native American 2%
- Common ancestry
- Portuguese 26% Romanian 4% Lithuanian 3%
- Foreign-born
- 5% · Canada, South Korea, China
- Languages at home
- 93% English-only · Spanish 1% Other Indo-European 1% Russian/Polish/Slavic 1%
Political lean MEDSL · Grand Forks
- 2024 margin
- R (+18.2) · D 40.1% · R 58.3% · Other 1.6%
- 2008→2024 swing
- -23.3pp toward R · 2008: 5.1pp · 2024: -18.2pp
- All cycles
- 2024: R+18.2 2020: R+13.3 2016: R+18.5 2012: R+3.5 2008: D+5.1
Not yet ingested
- Civics
- —
Market trends
- HPI YoY
- ▼ -197.56%
- Current HPI
- 183.128
- Rent YoY
- ▲ 9.31%
- Metro
- Grand Forks, ND-MN
- State GDP YoY
- ▲ 2.09%
- F500 in state
- 2
Industry mix (Fortune 500 HQ in ND)
| Industry | F500 HQs | Revenue |
|---|---|---|
| Utilities / Construction | 1 | $6B |
|
||
Price history
-7.7% since first listed3 events — show timeline
- 2026-03-25 Price Changed $119,900 GFAAR
- 2026-03-10 Listed $129,900 GFAAR
- 1998-05-20 Sold (Public Records) — Public Records
Property tax history
+5.6%/yrLatest (2025): $1,606 · +1.0% YoY. Source: county tax records.
Cash-flow waterfall
monthlySold comps — $/sqft
last 12 mo · ≤1 miLoading sold comps…