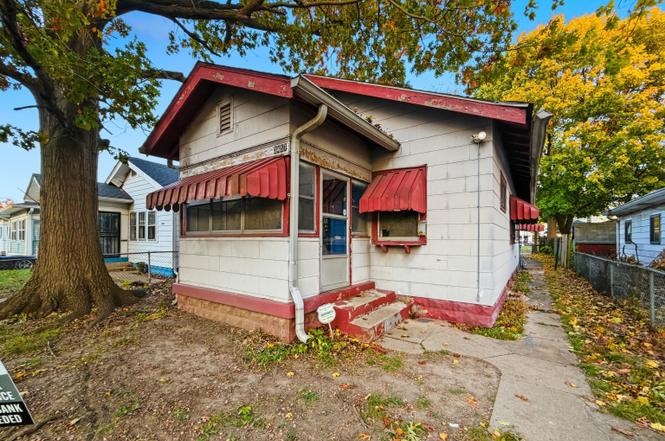
3457 Graceland Ave · Indianapolis city (balance), IN
Flood risk 7/10 · Major
- FEMA flood zone
- X (unshaded)
- Chance of flooding over 30 yrs
- 0.76%
- Est. flood insurance / yr
- $473 – $860
Fire risk 1/10 · Minimal
- Est. fire insurance / yr
- $717 – $1,331
Heat risk 4/10 · Minor
- Hot days now (above 101°F)
- 7 days/yr
- Hot days in 30 yrs
- 19 days/yr
Wind risk 2/10 · Minimal
- Chance of severe wind over 30 yrs
- 1.0%
Air-quality risk 4/10 · Minor
- Unhealthy air days now
- 5 days/yr
- Unhealthy air days in 30 yrs
- 7 days/yr
Risk factors via First Street. Map © Google.
Why this score? — see what drove the B- grade
The composite is a weighted blend of 9 inputs, each scored 0–100. Each bar is that input's sub-score; the figure is the points it added to the 100-point composite (weight × sub-score).
- Cash flow +26.5/30.0
- ARV discount +15.0/15.0
- DSCR +9.0/10.0
- 1% rule +7.7/10.0
- Rent growth +4.1/5.0
- Livability +2.5/5.0
- Condition / age +2.5/5.0
- Schools +1.4/10.0
- Appreciation +0.0/10.0
$89,500
🖨 Deal sheet (PDF) 📄 Offer letter ✓ Due diligence
Listing remarks
This 2-bedroom home in the Crown Hill neighborhood is full of character and ready for someone to bring it back to life. With 960 square feet and a traditional single-level layout, it offers a cozy feel and plenty of potential for the right buyer. Whether you're a first-time homeowner or an investor looking for a solid project, this property is worth a look. Built in 1930 with a wood exterior, the home features a functional floor plan with comfortable living space throughout. The detached 1-car garage is on the property but is in poor condition and will need attention. Located near parks, schools, and easy access to downtown, this home is a great opportunity in an established area.
Key facts
- Near schools
- Near parks
- Wood exterior
Tags
Neighborhood map
What this means for you Summary
Snapshot
- This is a 2-bed/1.0-bath single-family listed at $90k.
Deal economics
- At list price, monthly cash flow is $181 ($2k/yr) — positive.
- The deal already cash-flows at list — no discount required.
- Meets the 1% rule at list price ($1k rent vs $90k).
- Recommended offer: $79k (12.0% below list) — sets the bar for market timing.
- Cap rate 9.5% vs local median 4.4% in Indianapolis city (balance) — top-decile yield for the area; either an underpriced asset or a hidden risk that comps aren't pricing in. Stress-test before assuming the spread holds.
Location & tenants
- Location reads: area grade B — affects rentability + tenant quality, not the cash-flow math above.
- Indianapolis Public Schools (urban): math 14% / reading 20% proficiency, ranked #286 of 301 in IN (top 95%) — low school quality limits family demand, transient renter base, plan for 1-2y turnover; 77% free/reduced lunch — lower-income household profile, screen leases tightly.
- Zoned schools: Center For Inquiry School 27 (math 25% / reading 29%, grade F, #737 of 994 statewide, top 76%, 525 students, 51% FRL); H L Harshman Middle School (math 3% / reading 16%, grade F, #316 of 330 statewide, top 96%, 549 students, 84% FRL); Arsenal Technical High School (math 6% / reading 27%, grade F, #353 of 369 statewide, top 96%, 2,366 students, 74% FRL).
- Market conditions: Rents rising fast (+6.4%/yr); 283 active listings in the ZIP; 40 comparable units currently listed for rent nearby; rentals at typical pace (median 26d on market — plan ~3-4 weeks tenant-placement turnaround); 1,906 units permitted in Marion County in 2024 (621 in 5+ unit buildings).
Forward outlook
- Local home prices are declining (-3.0%/yr); year-one equity from $619 of loan paydown is wiped out by about $3k of value loss. Plan a longer hold.
- Marion County population projected at +18% by 2050 — long-run rental-demand tailwind backs the buy-and-hold thesis.
- At projected returns (-3.0% appreciation + 6.4% rent growth), your $25k cash investment doubles in ~9 years — after that, you're playing with house money.
Negotiation context
- It's been on market 129 days — a 12% lower offer ($79k) is reasonable based on typical stale-listing flexibility.
Risks & watch-outs
- Watch-outs: flood insurance adds $56/mo; built in 1930 — expect roof / HVAC / electrical / plumbing capex.
- Climate carrying-cost: major flood risk — expect insurance premiums to compound above CPI over the hold.
Questions for the listing agent
- It's been on market 129 days. Have you received any prior offers? Is the seller open to a 12% concession, seller financing, or rate buy-down credit?
- Built in 1930 — when were the roof, HVAC, electrical panel, plumbing, and water heater last replaced?
- What's the actual annual flood-insurance premium (NFIP or private), and is the property in a SFHA with mandatory coverage?
- Why hasn't it sold? Are there any deal-killer items the seller is aware of (foundation, flood, title, zoning, code violations)?
- Is there a deadline driving the sale (1031 exchange, divorce, estate, relocation)? That informs how much negotiation room exists.
- What's the average days-on-market for RENTAL listings here right now (not sales)? A rising rental-DOM trend means longer vacancies and softer asking-rent achievability than the comps imply.
- What's the recent tenant-quality profile in this submarket — average credit score on applications, eviction rate, late-payment / NSF rate, and stable-employment percentage? A property-management company in the area should have these aggregated.
- How much new for-sale + rental construction is in the pipeline within 1–3 miles? Heavy new supply typically softens prices + rents 12–24 months out; constrained supply supports both.
Investment metrics
- 1% rule
- 1.27% ✓
- Cap rate
- 9.46%
- Cash-on-cash
- 11.31%
- DSCR
- 1.50
- GRM
- 6.5
CMA / ARV
- ARV (on-the-fly)
- $134,400
- Comps found
- 4
Show comp detail 4 sales within ~0.75 mi
| Address | Dist | Beds/Ba | Sqft | Sold | Price | $/sf | Match |
|---|---|---|---|---|---|---|---|
| 3630 Graceland Ave | 0.21mi | 3/1.0 (+1) | 864 (-10%) | 21mo | $162,500 | $188 | 51 |
| 3035 Graceland Ave | 0.54mi | 3/2.0 (+1) | 1,001 (+4%) | 10mo | $140,000 | $140 | 50 |
| 2949 Shriver Ave | 0.67mi | 3/1.0 (+1) | 1,080 (+12%) | 2mo | $138,000 | $128 | 41 |
| 3017 Ethel Ave | 0.66mi | 3/1.5 (+1) | 1,079 (+12%) | 7mo | $90,000 | $83 | 36 |
Match score weights: distance 35% · size 25% · config 20% · recency 20%. Top-matched comps best support the ARV.
Projected returns pro-forma
-3.0% appreciation · 6.43% rent growth · sell at horizon
- IRR
- 1.2%
- Equity multiple
- 1.05×
- Total profit
- $1,155
- Equity at exit
- $13,345
- IRR
- 14.3%
- Equity multiple
- 2.36×
- Total profit
- $34,082
- Equity at exit
- $7,738
Cash invested: $25,060 (down + closing). Projections, not guarantees.
Landlord ↔ Tenant lean methodology
- Overall (STATE)
- 90 Strongly Landlord-Friendly
- State Indiana
- 90 Strongly Landlord-Friendly · R+11
- County
- — inherits STATE
- City
- — inherits STATE
ZIP-level market 46208
- Rents YoY
- 6.4%
- Active inventory
- 283
- Price-to-rent
- 6.5×
Monthly cashflow live
- Estimated rent
- $1,141 high interval (Pro) →
- Mortgage (P&I)
- −$469
- Tax from tax record
- −$159 /mo · $1,904/yr
- Insurance
- −$37
- Flood insurance flood zone
- −$56 /mo · $666/yr
- HOA
- −$0
- Vacancy / Maint / Mgmt
- −$240
- Net cashflow
- $181
Break-even live
Sensitivity live
| Price | -10% $231 | -5% $206 | +0% $181 | +5% $155 | +10% $130 |
|---|---|---|---|---|---|
| Rent | -10% $90 | -5% $136 | +0% $181 | +5% $226 | +10% $271 |
| Rate | -1.0pp $226 | -0.5pp $203 | base $181 | +0.5pp $157 | +1.0pp $134 |
UW: 25.0% down · 7.5% · 30yr · 1.5% tax · 5.0% vac · 8.0% maint · 8.0% mgmt
Financing live
Cash to close
- Down payment
- $22,375
- Closing costs
- $2,685
- Reserves months
- —
- Total cash needed
- —
Loan-product check · same deal, 3 products live
Conventional
25% down · 7.5% · 30yr
- Down + closing
- —
- Monthly P&I
- —
- Monthly cashflow
- —
- DSCR
- —
- Eligible?
- —
Personal DTI + credit; lowest rate.
DSCR
20% down · 8.5% · 30yr
- Down + closing
- —
- Monthly P&I
- —
- Monthly cashflow
- —
- DSCR
- —
- Eligible?
- —
No personal income docs; deal must DSCR.
Hard money
10% down · 12.0% · 12mo
- Down + closing
- —
- Monthly P&I
- —
- Monthly cashflow
- —
- DSCR
- —
- Eligible?
- —
Short-term bridge; refi at stabilization.
Rent comps 40 comps
| Address | Beds | Baths | Sqft | Rent | $/sqft | DOM | Units | Dist |
|---|---|---|---|---|---|---|---|---|
| 3469 Graceland Ave Indianapolis, IN | 2.0 | 1.0 | 1000 | $1,200 | $1.20 | 45d | 1 | 0.03mi |
| 3502 N Kenwood Ave Indianapolis, IN | 3.0 | 2.0 | 1094 | $1,220 | $1.12 | 45d | 1 | 0.08mi |
| 3413 N Capitol Ave Indianapolis, IN | 3.0 | 1.0 | 588 | $1,299 | $2.21 | 25d | 1 | 0.10mi |
| 3501 N Illinois St Unit 3 Indianapolis, IN | 2.0 | 2.0 | 1087 | $1,350 | $1.24 | 9d | 1 | 0.17mi |
| 3540 N Meridian St Indianapolis, IN | 1.0 | 1.0 | 757 | $789 | $1.04 | 6d | 3 | 0.26mi |
| 3340 N Meridian St Unit 3340-305 Indianapolis, IN | 1.0 | 1.0 | 650 | $855 | $1.32 | 25d | 1 | 0.29mi |
| 3340 N Meridian St Unit 3340-302 Indianapolis, IN | 1.0 | 1.0 | 650 | $855 | $1.32 | 22d | 1 | 0.30mi |
| 3330 N Meridian St Unit 3330-306 Indianapolis, IN | 1.0 | 1.0 | 650 | $855 | $1.32 | 22d | 1 | 0.31mi |
| 3310 N Meridian St Indianapolis, IN | 1.0–2.0 | 1.0 | 750 | $1,150 | $1.53 | 45d | 3 | 0.32mi |
| 3541 N Meridian St Indianapolis, IN | 1.0–2.0 | 1.0 | 987 | $880 | $0.89 | 45d | 1 | 0.32mi |
| 3640 N Meridian St Unit 01 Indianapolis, IN | 3.0 | 1.0 | 1000 | $999 | $1.00 | 45d | 1 | 0.33mi |
| 3640 N Meridian St Unit 13 Indianapolis, IN | 1.0 | 1.0 | 700 | $699 | $1.00 | 25d | 1 | 0.33mi |
| 3640 N Meridian St Unit 11 Indianapolis, IN | 1.0 | 1.0 | 700 | $699 | $1.00 | 45d | 1 | 0.33mi |
| 3729 N Kenwood Ave Indianapolis, IN | 2.0 | 1.0 | 1107 | $1,100 | $0.99 | 45d | 1 | 0.35mi |
| 3710 N Meridian St Indianapolis, IN | 2.0 | 1.0–2.0 | 670 | $969 | $1.45 | 0d | 33 | 0.35mi |
| 3707 N Meridian St Indianapolis, IN | 2.0 | 1.0–2.0 | 1042 | $1,199 | $1.15 | 45d | 1 | 0.38mi |
| 3524 N Pennsylvania St Indianapolis, IN | 2.0 | 1.0 | 725 | $872 | $1.20 | 5d | 4 | 0.38mi |
| 3726 N Meridian St Apt 33 Indianapolis, IN | 1.0 | 1.0 | 725 | $750 | $1.03 | 25d | 1 | 0.39mi |
| 3671 N Pennsylvania St Indianapolis, IN | 2.0 | 1.0 | 725 | $794 | $1.10 | 22d | 1 | 0.51mi |
| 3554 N Washington Blvd Apt 2 Indianapolis, IN | 1.0 | 1.0 | 800 | $750 | $0.94 | 45d | 1 | 0.52mi |
| 3558 Washington Blvd Indianapolis, IN | 3.0 | 1.0 | 975 | $1,199 | $1.23 | 9d | 1 | 0.52mi |
| 3801 N Meridian St Indianapolis, IN | 1.0–3.0 | 1.0–2.0 | 1057 | $1,474 | $1.39 | 22d | 35 | 0.53mi |
| 57 E 38th St Indianapolis, IN | 1.0 | 1.0 | 750 | $770 | $1.03 | 4d | 4 | 0.54mi |
| 3017 Ethel Ave Indianapolis, IN | 3.0 | 1.5 | 1079 | $1,400 | $1.30 | 25d | 1 | 0.68mi |
| 2937 N Kenwood Ave Unit A Indianapolis, IN | 1.0 | 1.0 | 672 | $889 | $1.32 | 24d | 1 | 0.68mi |
| 2937 Shriver Ave Indianapolis, IN | 1.0 | 1.0 | 564 | $850 | $1.51 | 45d | 1 | 0.69mi |
| 3815 Washington Blvd Indianapolis, IN | 2.0 | 1.0 | 1000 | $1,250 | $1.25 | 9d | 1 | 0.71mi |
| 4031 Boulevard Pl Indianapolis, IN | 1.0 | 1.0 | 700 | $895 | $1.28 | 22d | 1 | 0.71mi |
| 3924 Byram Ave Indianapolis, IN | 1.0 | 1.0 | 810 | $1,099 | $1.36 | 6d | 1 | 0.73mi |
| 3836 Central Ave Indianapolis, IN | 1.0 | 1.0 | 600 | $1,125 | $1.88 | 25d | 1 | 0.80mi |
| 2818 N Capitol Ave Apt 1 Indianapolis, IN | 1.0 | 1.0 | 600 | $2,000 | $3.33 | 45d | 1 | 0.82mi |
| 538 W 29th St Unit B Indianapolis, IN | 3.0 | 1.0 | 1031 | $1,349 | $1.31 | 0d | 1 | 0.83mi |
| 608 Bernard Ave Indianapolis, IN | 3.0 | 2.0 | 1056 | $1,475 | $1.40 | 5d | 1 | 0.84mi |
| 4023 Clarendon Rd Indianapolis, IN | 1.0 | 1.0 | 572 | $950 | $1.66 | 45d | 1 | 0.84mi |
| 2808 N Capitol Ave Indianapolis, IN | 2.0 | 1.0 | 900 | $975 | $1.08 | 25d | 1 | 0.84mi |
| 541 W 29th St Indianapolis, IN | 1.0 | 1.0 | 740 | $900 | $1.22 | 22d | 1 | 0.85mi |
| 926 W 32nd St Indianapolis, IN | 3.0 | 2.0 | 1050 | $1,295 | $1.23 | 9d | 1 | 0.86mi |
| 1 W 28th St Indianapolis, IN | 1.0 | 1.0 | 656 | $970 | $1.48 | 5d | 15 | 0.91mi |
| 516 W 28th St Indianapolis, IN | 2.0 | 1.0 | 1005 | $1,100 | $1.09 | 25d | 1 | 0.92mi |
| 4210 Graceland Ave Indianapolis, IN | 1.0 | 1.0 | 676 | $900 | $1.33 | 24d | 1 | 0.93mi |
Listing history 6 events
-
2026-03-16status Pending
-
2026-02-23price $89,500
-
2026-01-16price $95,500
-
2025-12-23price $100,500
-
2025-11-25price $105,500
-
2025-11-07$115,500 Active
ⓘ Source: listings_history table (triggers on properties + properties_extension) + one-shot
backfill from property_details.listing_events for pre-trigger history.
Tax reassessment forecast IN · Partial reset (capped growth)
- Current annual tax
- $1,904 · $159/mo
- Projected year-2 tax
- $1,904 · $159/mo
- Expected delta
- $0/yr ($0/mo · 0.0%)
ⓘ Screening estimate from a state-policy table — verify with the county assessor before closing.
Climate risk First Street
- Flood 7/10 Severe FEMA zone X (unshaded) · 76% chance over 30 yrs
- Wildfire 1/10 Low
- Heat 4/10 Moderate 7 d/yr ≥101°F today · 19 d/yr by 30 yrs out
- Wind 2/10 Low 100% chance of damaging wind over 30 yrs
- Air quality 4/10 Moderate 5 unhealthy d/yr today · 7 by 30 yrs out
Nearby sold comps map
Loading sold comps map…
Walkable amenities ~0.75 mi
Loading nearby amenities…
Taxation est. · year 1
- Rental income
- $13,693
- − Mortgage interest
- −$5,013
- − Property taxes
- −$1,904
- − Insurance
- −$1,114
- − Repairs & maintenance
- −$1,095
- − Management
- −$1,095
- − Depreciation
- −$2,604
- Taxable income
- $867
- Est. tax owed @ 24.0%
- −$208
- After-tax cash flow
- $1,959/yr
For passive investors: Depreciation is non-cash, so a rental often shows a tax loss while cash-flowing — sheltering income. Rental losses are passive: they offset passive income freely, and up to $25,000/yr can offset ordinary (W-2) income if you actively participate and your MAGI is under $100k (phasing out to $0 by $150k); unused losses carry forward. On sale, claimed depreciation is recaptured at up to 25%, and gains may owe capital-gains tax (a 1031 exchange can defer both). Figures are a year-1 estimate at your 24.0% rate — not tax advice; consult a CPA.
Schools (NCES district)
- District
- Indianapolis Public Schools
- NCES district ID
- 1804770
- Math proficiency
- 14% ▼ -7.00%
- Reading proficiency
- 20% ▼ -3.00%
- Median HH income
- $32,034
- Composite
- 13.69/100
- National rank
- #9499
- State rank
- #286 of 301 in IN
Livability — Indianapolis city (balance)
No livability data for this city. (Only ~50 U.S. cities are tracked.)
Census & demographics
- Census place
- Indianapolis city (balance), IN
- County
- Marion County · 998,460 people
- City population
- 881,119
- Metro
- Indianapolis-Carmel-Anderson, IN
- Population (ZIP)
- 22,379
- Household income
- $60,062
- Rent vs Own
- Severe rent burden
- 978.0
Population outlook (Marion County) Hauer SSP2
- Today (2025)
- 1,025,572 people
- By 2030
- 1,065,727 · +3.9%
- By 2040
- 1,141,577 · +11.3%
- By 2050
- 1,208,920 · +17.9%
- By 2075
- 1,367,288 · +33.3%
- By 2100
- 1,438,201 · +40.2%
Race, ethnicity, and origin ACS 2023
- Neighborhood character
- Diverse neighborhood (Simpson 0.62)
- Race & ethnicity
- White 46% Black 40% Hispanic / Latino 8% Two or more races 6% Asian 2%
- Hispanic origin (detail)
- Mexican 4%
- Common ancestry
- Romanian 2% Slovak 2% Italian 1%
- Foreign-born
- 4% · Canada
- Languages at home
- 93% English-only · Spanish 5% French/Haitian/Cajun 1% Other Indo-European 1%
Political lean MEDSL · Marion
- 2024 margin
- Strong D (+27.7) · D 63.0% · R 35.3% · Other 1.7%
- 2008→2024 swing
- -0.7pp no change · 2008: 28.4pp · 2024: 27.7pp
- All cycles
- 2024: D+27.7 2020: D+29.1 2016: D+22.8 2012: D+22.2 2008: D+28.4
Not yet ingested
- Civics
- —
Market trends
- HPI YoY
- ▼ -324.63%
- Current HPI
- 319.7725
- Rent YoY
- ▲ 6.43%
- Metro
- Indianapolis-Carmel-Anderson, IN
- State GDP YoY
- ▲ 2.90%
- F500 in state
- 18
Industry mix (Fortune 500 HQ in IN)
| Industry | F500 HQs | Revenue |
|---|---|---|
| Industrial Machinery | 2 | $37B |
|
||
| Healthcare | 1 | $177B |
|
||
| Pharmaceuticals | 1 | $45B |
|
||
| Metals / Steel | 1 | $18B |
|
||
| Agriculture | 1 | $17B |
|
||
| Packaging | 1 | $12B |
|
||
Price history
-22.5% since first listed6 events — show timeline
- 2026-03-16 Pending — MIBOR as Distributed by MLS Grid
- 2026-02-23 Price Changed $89,500 MIBOR as Distributed by MLS Grid
- 2026-01-16 Price Changed $95,500 MIBOR as Distributed by MLS Grid
- 2025-12-23 Price Changed $100,500 MIBOR as Distributed by MLS Grid
- 2025-11-25 Price Changed $105,500 MIBOR as Distributed by MLS Grid
- 2025-11-07 Listed $115,500 MIBOR as Distributed by MLS Grid
Property tax history
+8.3%/yrLatest (2025): $1,904 · +6.2% YoY. Source: county tax records.
Cash-flow waterfall
monthlySold comps — $/sqft
last 12 mo · ≤1 miLoading sold comps…