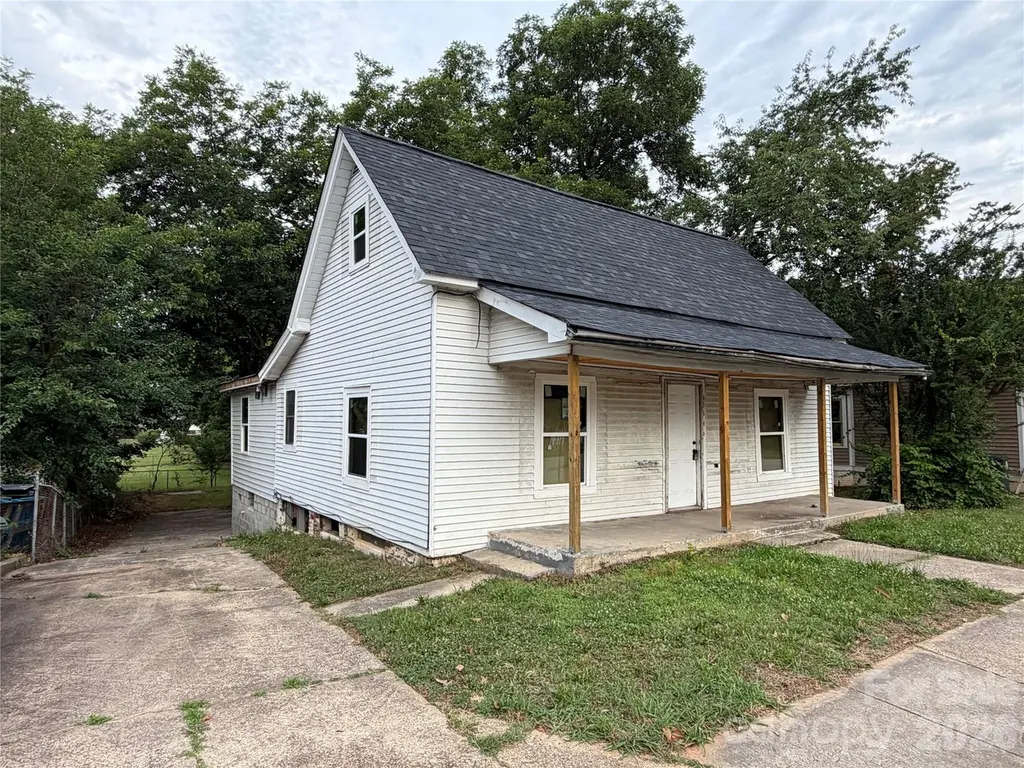
305 W Harrison St · Salisbury, NC
Flood risk 1/10 · Minimal
- FEMA flood zone
- X (unshaded)
- Chance of flooding over 30 yrs
- 0.0%
- Est. flood insurance / yr
- $507 – $1,088
Fire risk 1/10 · Minimal
- Est. fire insurance / yr
- $906 – $1,684
Heat risk 6/10 · Moderate
- Hot days now (above 104°F)
- 7 days/yr
- Hot days in 30 yrs
- 17 days/yr
Wind risk 4/10 · Minor
- Chance of severe wind over 30 yrs
- 13.0%
Air-quality risk 3/10 · Minor
- Unhealthy air days now
- 2 days/yr
- Unhealthy air days in 30 yrs
- 3 days/yr
Risk factors via First Street. Map © Google.
Why this score? — see what drove the B grade
The composite is a weighted blend of 9 inputs, each scored 0–100. Each bar is that input's sub-score; the figure is the points it added to the 100-point composite (weight × sub-score).
- Cash flow +30.0/30.0
- ARV discount +15.0/15.0
- DSCR +10.0/10.0
- 1% rule +7.9/10.0
- Livability +3.2/5.0
- Schools +2.6/10.0
- Rent growth +2.5/5.0
- Condition / age +2.5/5.0
- Appreciation +0.0/10.0
$135,000
🖨 Deal sheet (PDF) 📄 Offer letter ✓ Due diligence
Listing remarks MLS
Investors take a look. 2 BD 1 BA home in need of rehab. Property in an estate and sold as is where is. Seller will make NO repairs. Clean this one up and make it shine. Could be converted to 3 BD 2 BA. Urban living with convenience to downtown, shopping, hospitals and I-85 Ramp. Cleaned up, this property would make a great rental or flip it for a new homebuyer to enjoy urban living in Salisbury.
Key facts
- 8,058 sq ft lot
- Built 1925
- Listed 5 days
Tags
Property features AI
Finance
- Other: Salisbury zoning
- HOA & community: No HOA; Sidewalks and street lights in the community
Exterior
- Parking: Driveway
- Utilities: City water; Public sewer; Cable available; Electricity connected
- Home design: Single-family residence; Residential property; One and one-half stories; Accessibility features including no interior steps, 32"+ door widths, 36"+ hall widths, 60" kitchen turning radius, and mobility-friendly flooring
- Construction: Site-built construction; Aluminum and vinyl exterior materials; Basement and crawl space foundation
- Exterior features: Covered patio/deck and front porch; Deck; Back yard chain-link fencing; Cleared, level lot; Concrete and paved road access; Publicly maintained road
Interior
- Bedrooms: Three main-level bedrooms; One upper-level bedroom
- Flooring: Laminate; Vinyl; Wood
- Heating & cooling: Central heating (electric); Central air with heat pump
- Interior features: Nine rooms; Insulated windows; Insulated doors; Unfinished basement
- Laundry & utility: Laundry closet
Neighborhood map
What this means for you Summary
Snapshot
- This is a 4-bed/1.0-bath single-family listed at $135k.
Deal economics
- At list price, monthly cash flow is $503 ($6k/yr) — positive.
- The deal already cash-flows at list — no discount required.
- Meets the 1% rule at list price ($2k rent vs $135k).
- Cap rate 10.8% vs local median 3.3% in Salisbury — top-decile yield for the area; either an underpriced asset or a hidden risk that comps aren't pricing in. Stress-test before assuming the spread holds.
Location & tenants
- Location reads 64/100 on livability (#365 in NC) — a middle-class / working-renter tenant base. Strengths: cost of living A+, housing A+, health & safety A+; Watch: schools F, crime F, amenities D-.
- Rowan-Salisbury Schools (rural): math 26% / reading 35% proficiency, ranked #142 of 178 in NC (top 80%) — families likely to look elsewhere, expect single-tenant / working-renter base with shorter leases.
- Market conditions: 291 active listings in the ZIP; 8 comparable units currently listed for rent nearby; rentals at typical pace (median 19d on market — plan ~3-4 weeks tenant-placement turnaround); 592 units permitted in Rowan County in 2024 (5 in 5+ unit buildings).
- This rent runs 40% of the median local income ($53k/yr) — at the standard rent-burdened threshold; future hikes will face affordability resistance.
Forward outlook
- Local home prices are declining (-3.0%/yr); year-one equity from $933 of loan paydown is wiped out by about $4k of value loss. Plan a longer hold.
- Rowan County population projected to shrink 6% by 2050 — rents likely to lag national; underwrite the cash flow, not the appreciation.
- At projected returns (-3.0% appreciation + 3.0% rent growth), your $38k cash investment doubles in ~8 years — after that, you're playing with house money.
Negotiation context
- Only 5 days on market — expect competitive offers; lowballing is unlikely to land.
- 4 sale attempts since 3y ago with the ask held roughly flat each time — persistent listings suggest the price (not the market) is what's stuck; bring a comps-based counter.
- Current owner paid $70k; list at $135k implies a 93% gain — meaningful room to come down on a strong offer.
Risks & watch-outs
- Watch-outs: built in 1925 — expect roof / HVAC / electrical / plumbing capex.
- Climate carrying-cost: extreme-heat days projected 7→17/yr by 2055 (HVAC capex compounding) — expect insurance premiums to compound above CPI over the hold.
Questions for the listing agent
- Built in 1925 — when were the roof, HVAC, electrical panel, plumbing, and water heater last replaced?
- Is there a deadline driving the sale (1031 exchange, divorce, estate, relocation)? That informs how much negotiation room exists.
- Schools are F-rated, which usually means shorter tenancies and higher turnover. Who's the typical renter profile here, and what's been the actual vacancy rate?
- Crime grade is F in this area — have there been break-ins, vandalism, or insurance claims at this property in the last 3 years? What carrier currently insures it and at what premium?
- What's the average days-on-market for RENTAL listings here right now (not sales)? A rising rental-DOM trend means longer vacancies and softer asking-rent achievability than the comps imply.
- What's the recent tenant-quality profile in this submarket — average credit score on applications, eviction rate, late-payment / NSF rate, and stable-employment percentage? A property-management company in the area should have these aggregated.
- How much new for-sale + rental construction is in the pipeline within 1–3 miles? Heavy new supply typically softens prices + rents 12–24 months out; constrained supply supports both.
Investment metrics
- 1% rule
- 1.29% ✓
- Cap rate
- 10.77%
- Cash-on-cash
- 15.98%
- DSCR
- 1.71
- GRM
- 6.5
CMA / ARV
- ARV (on-the-fly)
- $240,800
- Comps found
- 12
Show comp detail 12 sales within ~0.75 mi
| Address | Dist | Beds/Ba | Sqft | Sold | Price | $/sf | Match |
|---|---|---|---|---|---|---|---|
| 119 Wiley Ave | 0.24mi | 3/1.5 (-1) | 1,613 (+7%) | 6mo | $275,000 | $170 | 65 |
| 222 W Mccubbins St | 0.20mi | 3/1.5 (-1) | 1,377 (-8%) | 7mo | $195,000 | $142 | 64 |
| 719 S Jackson St | 0.23mi | 3/2.0 (-1) | 1,386 (-8%) | 6mo | $276,500 | $199 | 62 |
| 1618 4th St | 0.63mi | 3/2.0 (-1) | 1,514 (+1%) | 7mo | $220,000 | $145 | 55 |
| 835 Maple Ave | 0.52mi | 3/2.0 (-1) | 1,610 (+7%) | 1mo | $225,000 | $140 | 54 |
| 9 Cooper St | 0.43mi | 3/2.5 (-1) | 1,399 (-7%) | 4mo | $260,000 | $186 | 54 |
| 102 Crawford St | 0.28mi | 3/2.0 (-1) | 1,304 (-13%) | 4mo | $245,000 | $188 | 52 |
| 81 Kirk St | 0.32mi | 4/3.0 | 1,660 (+10%) | 9mo | $254,000 | $153 | 52 |
| 218 Queen Anne Rd | 0.72mi | 3/1.0 (-1) | 1,593 (+6%) | 2mo | $250,000 | $157 | 50 |
| 1013 Locke St | 0.44mi | 3/2.0 (-1) | 1,326 (-12%) | 3mo | $242,500 | $183 | 48 |
| 5 Cooper St | 0.45mi | 3/2.0 (-1) | 1,342 (-11%) | 7mo | $215,000 | $160 | 47 |
| 406 S Shaver St | 0.74mi | 3/1.5 (-1) | 1,282 (-15%) | 3mo | $137,050 | $107 | 31 |
Match score weights: distance 35% · size 25% · config 20% · recency 20%. Top-matched comps best support the ARV.
Projected returns pro-forma
-3.0% appreciation · 3.0% rent growth · sell at horizon
- IRR
- 6.9%
- Equity multiple
- 1.27×
- Total profit
- $10,165
- Equity at exit
- $20,129
- IRR
- 16.2%
- Equity multiple
- 2.32×
- Total profit
- $50,074
- Equity at exit
- $11,672
Cash invested: $37,800 (down + closing). Projections, not guarantees.
Landlord ↔ Tenant lean methodology
- Overall (STATE)
- 85 Strongly Landlord-Friendly
- State North Carolina
- 85 Strongly Landlord-Friendly · R+3
- County
- — inherits STATE
- City
- — inherits STATE
ZIP-level market 28144
- Active inventory
- 291
- Price-to-rent
- 6.5×
Monthly cashflow live
- Estimated rent
- $1,737 high interval (Pro) →
- Mortgage (P&I)
- −$708
- Tax from tax record
- −$105 /mo · $1,262/yr
- Insurance
- −$56
- HOA
- −$0
- Vacancy / Maint / Mgmt
- −$365
- Net cashflow
- $503
Break-even live
Sensitivity live
| Price | -10% $580 | -5% $541 | +0% $503 | +5% $465 | +10% $427 |
|---|---|---|---|---|---|
| Rent | -10% $366 | -5% $435 | +0% $503 | +5% $572 | +10% $641 |
| Rate | -1.0pp $571 | -0.5pp $538 | base $503 | +0.5pp $468 | +1.0pp $433 |
UW: 25.0% down · 7.5% · 30yr · 1.5% tax · 5.0% vac · 8.0% maint · 8.0% mgmt
Financing live
Cash to close
- Down payment
- $33,750
- Closing costs
- $4,050
- Reserves months
- —
- Total cash needed
- —
Loan-product check · same deal, 3 products live
Conventional
25% down · 7.5% · 30yr
- Down + closing
- —
- Monthly P&I
- —
- Monthly cashflow
- —
- DSCR
- —
- Eligible?
- —
Personal DTI + credit; lowest rate.
DSCR
20% down · 8.5% · 30yr
- Down + closing
- —
- Monthly P&I
- —
- Monthly cashflow
- —
- DSCR
- —
- Eligible?
- —
No personal income docs; deal must DSCR.
Hard money
10% down · 12.0% · 12mo
- Down + closing
- —
- Monthly P&I
- —
- Monthly cashflow
- —
- DSCR
- —
- Eligible?
- —
Short-term bridge; refi at stabilization.
Rent comps 8 comps
| Address | Beds | Baths | Sqft | Rent | $/sqft | DOM | Units | Dist |
|---|---|---|---|---|---|---|---|---|
| 839 Carpenters Cir Salisbury, NC | 3.0 | 2.0 | 1188 | $1,560 | $1.31 | 25d | 1 | 0.88mi |
| 100 Emerson Ln Salisbury, NC | 2.0–3.0 | 2.0 | 1101 | $1,242 | $1.13 | 25d | 1 | 1.08mi |
| 200 Hamilton Dr Salisbury, NC | 3.0 | 1.0–2.0 | 750 | $1,510 | $2.01 | 0d | 15 | 1.18mi |
| 321 Woodson St Salisbury, NC | 1.0–3.0 | 1.0–2.5 | 1091 | $1,625 | $1.49 | 14d | 13 | 1.19mi |
| 237 Century Dr Salisbury, NC | 3.0 | 2.5 | 1500 | $1,475 | $0.98 | 5d | 1 | 1.28mi |
| 706 N Main St Salisbury, NC | 3.0 | 2.0 | 1176 | $1,700 | $1.45 | 19d | 1 | 1.33mi |
| 718 Park Ave Salisbury, NC | 3.0 | 2.0 | 1199 | $1,700 | $1.42 | 19d | 1 | 1.34mi |
| 202 N Merritt Ave Salisbury, NC | 3.0 | 1.5 | 1591 | $1,495 | $0.94 | 21d | 1 | 1.42mi |
Listing history 4 events
-
2026-06-21days on market $135,000 Active 5 DOM
-
2026-06-18days on market $135,000 Active 2 DOM
-
2026-06-17remarks 699-char remark
-
2026-06-17$135,000 Active 1 DOM
ⓘ Source: listings_history table (triggers on properties + properties_extension) + one-shot
backfill from property_details.listing_events for pre-trigger history.
Tax reassessment forecast NC · Resets to sale price
- Current annual tax
- $1,262 · $105/mo
- Projected year-2 tax
- $1,262 · $105/mo
- Expected delta
- $0/yr ($0/mo · 0.0%)
ⓘ Screening estimate from a state-policy table — verify with the county assessor before closing.
Climate risk First Street
- Flood 1/10 Low FEMA zone X (unshaded) · 0% chance over 30 yrs
- Wildfire 1/10 Low
- Heat 6/10 Major 7 d/yr ≥104°F today · 17 d/yr by 30 yrs out
- Wind 4/10 Moderate 13% chance of damaging wind over 30 yrs
- Air quality 3/10 Moderate 2 unhealthy d/yr today · 3 by 30 yrs out
Nearby sold comps map
Loading sold comps map…
Walkable amenities ~0.75 mi
Loading nearby amenities…
Taxation est. · year 1
- Rental income
- $20,850
- − Mortgage interest
- −$7,562
- − Property taxes
- −$1,262
- − Insurance
- −$675
- − Repairs & maintenance
- −$1,668
- − Management
- −$1,668
- − Depreciation
- −$3,927
- Taxable income
- $4,088
- Est. tax owed @ 24.0%
- −$981
- After-tax cash flow
- $5,058/yr
For passive investors: Depreciation is non-cash, so a rental often shows a tax loss while cash-flowing — sheltering income. Rental losses are passive: they offset passive income freely, and up to $25,000/yr can offset ordinary (W-2) income if you actively participate and your MAGI is under $100k (phasing out to $0 by $150k); unused losses carry forward. On sale, claimed depreciation is recaptured at up to 25%, and gains may owe capital-gains tax (a 1031 exchange can defer both). Figures are a year-1 estimate at your 24.0% rate — not tax advice; consult a CPA.
Schools (NCES district)
- District
- Rowan-Salisbury Schools
- NCES district ID
- 3704050
- Math proficiency
- 26% ▲ 2.00%
- Reading proficiency
- 35% ▲ 1.00%
- Median HH income
- $43,953
- Composite
- 26.01/100
- National rank
- #7317
- State rank
- #142 of 178 in NC
Livability — Salisbury
- Score
- 64/100
- State rank
- #365
- US rank
- #14533
Category grades
Schools grade is shown separately in the Schools card above.
Census & demographics
- Census place
- Salisbury, NC
- County
- Rowan County · 103,630 people
- City population
- 85,081
- Metro
- Charlotte-Concord-Gastonia, NC-SC
- Population (ZIP)
- 27,977
- Household income
- $52,568
- Rent vs Own
- Severe rent burden
- 1438.0
Population outlook (Rowan County) Hauer SSP2
- Today (2025)
- 140,430 people
- By 2030
- 140,193 · -0.2%
- By 2040
- 137,617 · -2.0%
- By 2050
- 131,826 · -6.1%
- By 2075
- 115,123 · -18.0%
- By 2100
- 92,774 · -33.9%
Race, ethnicity, and origin ACS 2023
- Neighborhood character
- Diverse neighborhood (Simpson 0.63)
- Race & ethnicity
- White 49% Black 35% Hispanic / Latino 12% Two or more races 7%
- Hispanic origin (detail)
- Mexican 4% Puerto Rican 2%
- Common ancestry
- Serbian 3% Slovak 2% Lithuanian 1%
- Foreign-born
- 5% · Canada
- Languages at home
- 91% English-only · Spanish 7% Other Indo-European 1%
Political lean MEDSL · Rowan
- 2024 margin
- Solid R (+35.9) · D 31.6% · R 67.5%
- 2008→2024 swing
- -13.1pp toward R · 2008: -22.8pp · 2024: -35.9pp
- All cycles
- 2024: R+35.9 2020: R+35.7 2016: R+36.8 2012: R+26.0 2008: R+22.8
Not yet ingested
- Civics
- —
Market trends
- HPI YoY
- ▼ -217.00%
- Current HPI
- 276.1097
- Rent YoY
- —
- Metro
- Charlotte-Concord-Gastonia, NC-SC
- State GDP YoY
- ▲ 3.28%
- F500 in state
- 26
Industry mix (Fortune 500 HQ in NC)
| Industry | F500 HQs | Revenue |
|---|---|---|
| Financial Services | 2 | $213B |
|
||
| Retail | 2 | $95B |
|
||
| Industrial Conglomerate | 1 | $38B |
|
||
| Metals / Steel | 1 | $35B |
|
||
| Utilities | 1 | $30B |
|
||
| Industrial Machinery | 1 | $19B |
|
||
Price history
+42.1% since first listed9 events — show timeline
- 2026-06-16 Listed $135,000 CANOPYMLS as Distributed by MLS Grid
- 2023-11-20 Sold (Public Records) $70,000 Public Records
- 2023-11-17 Sold (MLS) $70,000 CANOPYMLS as Distributed by MLS Grid
- 2023-10-16 Contingent — CANOPYMLS as Distributed by MLS Grid
- 2023-10-16 Relisted — CANOPYMLS as Distributed by MLS Grid
- 2023-09-12 Contingent — CANOPYMLS as Distributed by MLS Grid
- 2023-07-27 Listed $90,000 CANOPYMLS as Distributed by MLS Grid
- 2023-07-16 Price Changed $90,000 CANOPYMLS as Distributed by MLS Grid
- 2023-07-09 Listed $95,000 CANOPYMLS as Distributed by MLS Grid
Property tax history
+4.7%/yrLatest (2025): $1,262 · +0.0% YoY. Source: county tax records.
Cash-flow waterfall
monthlySold comps — $/sqft
last 12 mo · ≤1 miLoading sold comps…