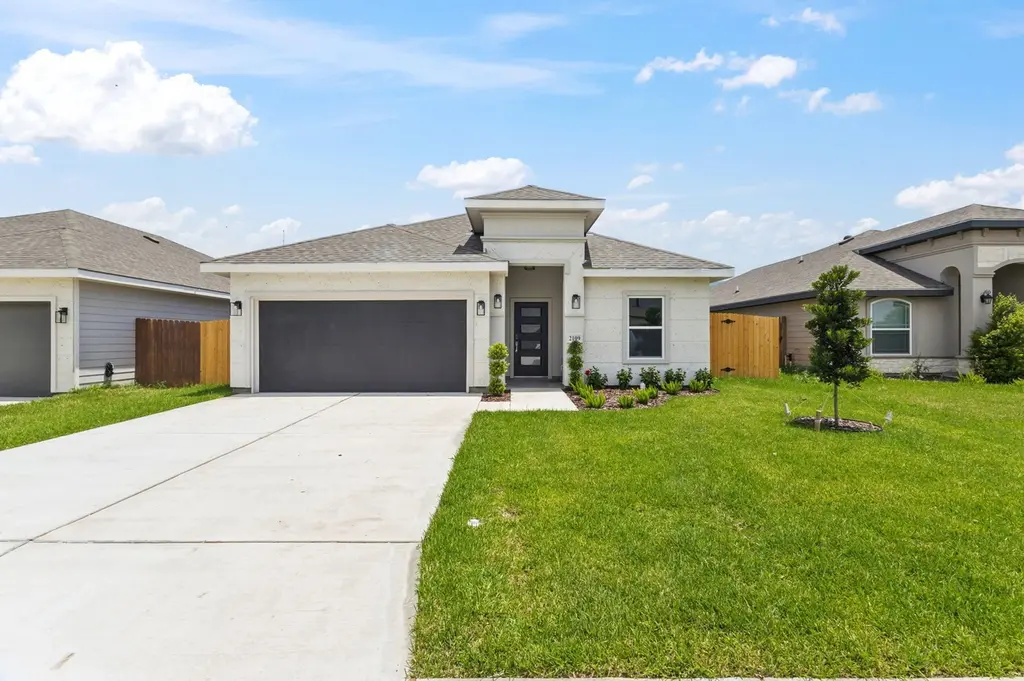
2109 N 25th 1/2 St · Hidalgo, TX
Flood risk 1/10 · Minimal
- FEMA flood zone
- —
- Chance of flooding over 30 yrs
- 0.0%
- Est. flood insurance / yr
- —
Fire risk 5/10 · Moderate
- Est. fire insurance / yr
- $1,222 – $2,270
Heat risk 9/10 · Severe
- Hot days now (above 111°F)
- 7 days/yr
- Hot days in 30 yrs
- 22 days/yr
Wind risk 8/10 · Major
- Chance of severe wind over 30 yrs
- 97.0%
Air-quality risk 1/10 · Minimal
- Unhealthy air days now
- 0 days/yr
- Unhealthy air days in 30 yrs
- 0 days/yr
Risk factors via First Street. Map © Google.
Why this score? — see what drove the D- grade
The composite is a weighted blend of 9 inputs, each scored 0–100. Each bar is that input's sub-score; the figure is the points it added to the 100-point composite (weight × sub-score).
- Appreciation +10.0/10.0
- Cash flow +6.5/30.0
- Schools +5.0/10.0
- ARV discount +4.5/15.0
- Livability +3.4/5.0
- Rent growth +2.5/5.0
- Condition / age +2.5/5.0
- 1% rule +1.8/10.0
- DSCR +0.8/10.0
$274,020
🖨 Deal sheet (PDF) 📄 Offer letter ✓ Due diligence
Listing remarks
The San Pedro II Floor Plan is a thoughtfully designed single-story home that offers a perfect balance of comfort and efficiency. This layout features three spacious bedrooms, including a master bedroom that serves as a peaceful retreat with a large walk-in closet and an elegant master bathroom. Bedrooms 2 and 3 are located on the opposite side of the home for added privacy and share access to bathroom #2, making it ideal for families or guests. At the heart of the home, the open-concept family room, kitchen, and dining room create a welcoming space for gathering and entertaining. The kitchen boasts a convenient pantry and ample countertop space, anchored by a large island that is perfect f
Key facts
- Master bedroom
- Convenient pantry
- Large walk-in closet
Tags
Property features AI
Finance
- Other: Address: 2109 N 25th 1/2 St, Hidalgo TX 78557; List price available
- HOA & community: Association fee of 33.33
Exterior
- Parking: 2 parking spaces
- Utilities: Has heating; Has cooling
- Home design: Spec inventory; Plan name: San Pedro; Active listing
Interior
- Bedrooms: 3 bedrooms
- Bathrooms: 2 full bathrooms
- Heating & cooling: Other heating; Central air conditioning
- Interior features: Living area of 1502
Neighborhood map
What this means for you Summary
Snapshot
- This is a 3-bed/2.0-bath single-family listed at $274k.
Deal economics
- At list price, monthly cash flow is $-458 ($-5k/yr) — negative.
- To cash-flow at today's rent, offer at most $208k (24.2% below list).
- To meet the 1% rule (rent ≥ 1% of price), the offer needs to be $186k (32.2% below list).
- Recommended offer: $186k (32.2% below list) — sets the bar for 1% rule.
Location & tenants
- Location reads 68/100 on livability (#488 in TX) — a middle-class / working-renter tenant base. Strengths: cost of living A+, housing A+, crime A-; Watch: amenities F, commute F, employment F.
- Zoned schools: Valley View J H (math 23% / reading 35%, grade F, #1,103 of 1,662 statewide, top 67%, 483 students, 95% FRL); Valley View H S (math 12% / reading 47%, grade F, #1,112 of 1,632 statewide, top 70%, 1,170 students, 96% FRL).
- Market conditions: 102 active listings in the ZIP; 3 comparable units currently listed for rent nearby; rentals at typical pace (median 26d on market — plan ~3-4 weeks tenant-placement turnaround); 7,378 units permitted in Hidalgo County in 2024 (641 in 5+ unit buildings).
Forward outlook
- In year one you build about $29k of equity ($2k loan paydown + $27k appreciation (10.0% local appreciation)).
- Hidalgo County population projected at +28% by 2050 — long-run rental-demand tailwind backs the buy-and-hold thesis.
- By year 2, paydown + projected appreciation supports a ~$47k cash-out refi (75% LTV) — recoverable capital for the next deal without selling this one.
Negotiation context
- It's been on market 38 days — a 3% lower offer ($266k) is reasonable based on typical stale-listing flexibility.
Risks & watch-outs
- Climate carrying-cost: severe wind risk, 97% chance of damaging wind over 30y; moderate wildfire risk; extreme-heat days projected 7→22/yr by 2055 (HVAC capex compounding) — expect insurance premiums to compound above CPI over the hold.
Questions for the listing agent
- What do current leases actually rent for vs. the listed asking? Can we see a recent rent roll and the last 12 months of T-12 income?
- It's been on market 38 days. Have you received any prior offers? Is the seller open to a 32% concession, seller financing, or rate buy-down credit?
- What does the HOA fee cover, when was the last increase, and are there any pending special assessments or reserve-fund shortfalls?
- Is there a deadline driving the sale (1031 exchange, divorce, estate, relocation)? That informs how much negotiation room exists.
- Schools are D-rated, which usually means shorter tenancies and higher turnover. Who's the typical renter profile here, and what's been the actual vacancy rate?
- The area grade is low — what's the realistic commute time and amenity access for the typical tenant pool here? Any planned neighborhood developments (good or bad) we should know about?
- What's the average days-on-market for RENTAL listings here right now (not sales)? A rising rental-DOM trend means longer vacancies and softer asking-rent achievability than the comps imply.
- What's the recent tenant-quality profile in this submarket — average credit score on applications, eviction rate, late-payment / NSF rate, and stable-employment percentage? A property-management company in the area should have these aggregated.
- How much new for-sale + rental construction is in the pipeline within 1–3 miles? Heavy new supply typically softens prices + rents 12–24 months out; constrained supply supports both.
Investment metrics
- 1% rule
- 0.68% ✗
- Cap rate
- 4.29%
- Cash-on-cash
- -7.16%
- DSCR
- 0.68
- GRM
- 12.3
CMA / ARV
- ARV (on-the-fly)
- $256,842
- Comps found
- 12
Show comp detail 12 sales within ~0.75 mi
| Address | Dist | Beds/Ba | Sqft | Sold | Price | $/sf | Match |
|---|---|---|---|---|---|---|---|
| 2409 E Tamarindo Ave | 0.14mi | 3/2.0 | 1,474 (-2%) | 1mo | $255,000 | $173 | 90 |
| 3107 Sabinal St | 0.16mi | 3/2.0 | 1,544 (+3%) | 3mo | $259,900 | $168 | 85 |
| 3003 E Q St | 0.42mi | 3/2.0 | 1,498 (-0%) | 0mo | $269,000 | $180 | 80 |
| 2412 Sabinal Ave | 0.18mi | 3/2.0 | 1,405 (-6%) | 1mo | $229,000 | $163 | 80 |
| 2304 E Tamarindo Ave | 0.24mi | 3/2.0 | 1,442 (-4%) | 4mo | $248,000 | $172 | 78 |
| 1808 N 22nd St | 0.27mi | 3/2.0 | 1,452 (-3%) | 5mo | $95,000 | $65 | 78 |
| 2310 E Sabinal Ave | 0.25mi | 3/2.5 | 1,414 (-6%) | 2mo | $249,500 | $176 | 75 |
| 2805 Q St | 0.40mi | 3/2.0 | 1,544 (+3%) | 3mo | $249,900 | $162 | 74 |
| 1607 Las Palmas Ave | 0.34mi | 3/2.0 | 1,585 (+6%) | 2mo | $224,000 | $141 | 73 |
| 3009 E Tamarindo Ave | 0.38mi | 3/3.0 | 1,654 (+10%) | 4mo | $295,000 | $178 | 58 |
| 1305 N Sabinas St | 0.61mi | 3/2.0 | 1,403 (-7%) | 3mo | $185,000 | $132 | 58 |
| 3104 E Uva Ave E | 0.42mi | 3/3.5 | 1,726 (+15%) | 2mo | $294,900 | $171 | 48 |
Match score weights: distance 35% · size 25% · config 20% · recency 20%. Top-matched comps best support the ARV.
Projected returns pro-forma
10.0% appreciation · 3.0% rent growth · sell at horizon
- IRR
- 19.2%
- Equity multiple
- 2.57×
- Total profit
- $120,113
- Equity at exit
- $246,859
- IRR
- 17.7%
- Equity multiple
- 5.91×
- Total profit
- $376,751
- Equity at exit
- $532,361
Cash invested: $76,726 (down + closing). Projections, not guarantees.
Landlord ↔ Tenant lean methodology
- Overall (STATE)
- 87 Strongly Landlord-Friendly
- State Texas
- 87 Strongly Landlord-Friendly · R+5
- County
- — inherits STATE
- City
- — inherits STATE
ZIP-level market 78557
- Home prices YoY
- 17.9%
- Active inventory
- 102
- Price-to-rent
- 12.3×
Monthly cashflow live
- Estimated rent
- $1,859 medium interval (Pro) →
- Mortgage (P&I)
- −$1,437
- Tax est. 1.5%
- −$343 /mo · $4,110/yr
- Insurance
- −$114
- HOA
- −$33
- Vacancy / Maint / Mgmt
- −$390
- Net cashflow
- $-458
Break-even live
Sensitivity live
| Price | -10% $-269 | -5% $-363 | +0% $-458 | +5% $-553 | +10% $-647 |
|---|---|---|---|---|---|
| Rent | -10% $-605 | -5% $-531 | +0% $-458 | +5% $-385 | +10% $-311 |
| Rate | -1.0pp $-320 | -0.5pp $-388 | base $-458 | +0.5pp $-529 | +1.0pp $-601 |
UW: 25.0% down · 7.5% · 30yr · 1.5% tax · 5.0% vac · 8.0% maint · 8.0% mgmt
Financing live
Cash to close
- Down payment
- $68,505
- Closing costs
- $8,221
- Reserves months
- —
- Total cash needed
- —
Loan-product check · same deal, 3 products live
Conventional
25% down · 7.5% · 30yr
- Down + closing
- —
- Monthly P&I
- —
- Monthly cashflow
- —
- DSCR
- —
- Eligible?
- —
Personal DTI + credit; lowest rate.
DSCR
20% down · 8.5% · 30yr
- Down + closing
- —
- Monthly P&I
- —
- Monthly cashflow
- —
- DSCR
- —
- Eligible?
- —
No personal income docs; deal must DSCR.
Hard money
10% down · 12.0% · 12mo
- Down + closing
- —
- Monthly P&I
- —
- Monthly cashflow
- —
- DSCR
- —
- Eligible?
- —
Short-term bridge; refi at stabilization.
Rent comps 3 comps
| Address | Beds | Baths | Sqft | Rent | $/sqft | DOM | Units | Dist |
|---|---|---|---|---|---|---|---|---|
| 2304 E Tamarindo Ave Hidalgo, TX | 3.0 | 2.0 | 1442 | $1,950 | $1.35 | 25d | 1 | 0.25mi |
| 2509 Coma St Hidalgo, TX | 4.0 | 2.5 | 1804 | $1,750 | $0.97 | 25d | 1 | 1.19mi |
| 719 Sherryl Ave Pharr, TX | 3.0 | 2.0 | 1524 | $1,500 | $0.98 | 16d | 1 | 1.27mi |
HOA detail
- Monthly dues
- $33 · $396/yr
Listing history 10 events
-
2026-06-12days on market $274,020 Active 38 DOM
-
2026-06-09days on market $274,020 Active 35 DOM
-
2026-06-08days on market $274,020 Active 34 DOM
-
2026-06-07days on market $274,020 Active 33 DOM
-
2026-06-05days on market $274,020 Active 30 DOM
-
2026-06-03days on market $274,020 Active 29 DOM
-
2026-06-02days on market $274,020 Active 28 DOM
-
2026-06-01days on market $274,020 Active 27 DOM
-
2026-05-31days on market $274,020 Active 26 DOM
-
2026-05-30days on market $274,020 Active 25 DOM
ⓘ Source: listings_history table (triggers on properties + properties_extension) + one-shot
backfill from property_details.listing_events for pre-trigger history.
Climate risk First Street
- Flood 1/10 Low 0% chance over 30 yrs
- Wildfire 5/10 Major
- Heat 9/10 Extreme 7 d/yr ≥111°F today · 22 d/yr by 30 yrs out
- Wind 8/10 Severe 97% chance of damaging wind over 30 yrs
- Air quality 1/10 Low 0 unhealthy d/yr today · 0 by 30 yrs out
Nearby sold comps map
Loading sold comps map…
Walkable amenities ~0.75 mi
Loading nearby amenities…
Taxation est. · year 1
- Rental income
- $22,308
- − Mortgage interest
- −$15,349
- − Property taxes
- −$4,110
- − Insurance
- −$1,370
- − Repairs & maintenance
- −$1,785
- − Management
- −$1,785
- − HOA
- −$396
- − Depreciation
- −$7,971
- Taxable loss
- −$10,458
- Est. tax savings @ 24.0%
- +$2,510
- After-tax cash flow
- $-2,987/yr
For passive investors: Depreciation is non-cash, so a rental often shows a tax loss while cash-flowing — sheltering income. Rental losses are passive: they offset passive income freely, and up to $25,000/yr can offset ordinary (W-2) income if you actively participate and your MAGI is under $100k (phasing out to $0 by $150k); unused losses carry forward. On sale, claimed depreciation is recaptured at up to 25%, and gains may owe capital-gains tax (a 1031 exchange can defer both). Figures are a year-1 estimate at your 24.0% rate — not tax advice; consult a CPA.
Schools (NCES district)
No district data.
Livability — Hidalgo
- Score
- 68/100
- State rank
- #488
- US rank
- #9681
Category grades
Schools grade is shown separately in the Schools card above.
Census & demographics
- Census place
- Hidalgo, TX
- City population
- 14,250
- Population (ZIP)
- 14,250
Population outlook (Hidalgo County) Hauer SSP2
- Today (2025)
- 955,232 people
- By 2030
- 1,009,774 · +5.7%
- By 2040
- 1,120,332 · +17.3%
- By 2050
- 1,225,036 · +28.2%
- By 2075
- 1,439,189 · +50.7%
- By 2100
- 1,533,429 · +60.5%
Race, ethnicity, and origin ACS 2023
- Neighborhood character
- Predominantly Hispanic (99%)
- Race & ethnicity
- Hispanic / Latino 99% Two or more races 47%
- Hispanic origin (detail)
- Mexican 93%
- Foreign-born
- 39% · Canada
- Languages at home
- 6% English-only · Spanish 94%
Political lean MEDSL · Hidalgo
- 2024 margin
- Toss-up / Even · D 48.1% · R 51.0%
- 2008→2024 swing
- -41.6pp toward R · 2008: 38.7pp · 2024: -2.9pp
- All cycles
- 2024: R+2.9 2020: D+17.1 2016: D+40.5 2012: D+41.8 2008: D+38.7
Not yet ingested
- Civics
- —
Market trends
- HPI YoY
- ▲ 34.26%
- Current HPI
- 225.701
- Rent YoY
- —
- Metro
- —
- State GDP YoY
- ▲ 3.95%
- F500 in state
- 110
Industry mix (Fortune 500 HQ in TX)
| Industry | F500 HQs | Revenue |
|---|---|---|
| Energy | 16 | $1,198B |
|
||
| Technology | 5 | $198B |
|
||
| Engineering / Construction | 4 | $72B |
|
||
| Energy Services | 3 | $60B |
|
||
| Utilities | 3 | $41B |
|
||
| Healthcare | 2 | $330B |
|
||
Cash-flow waterfall
monthlySold comps — $/sqft
last 12 mo · ≤1 miLoading sold comps…