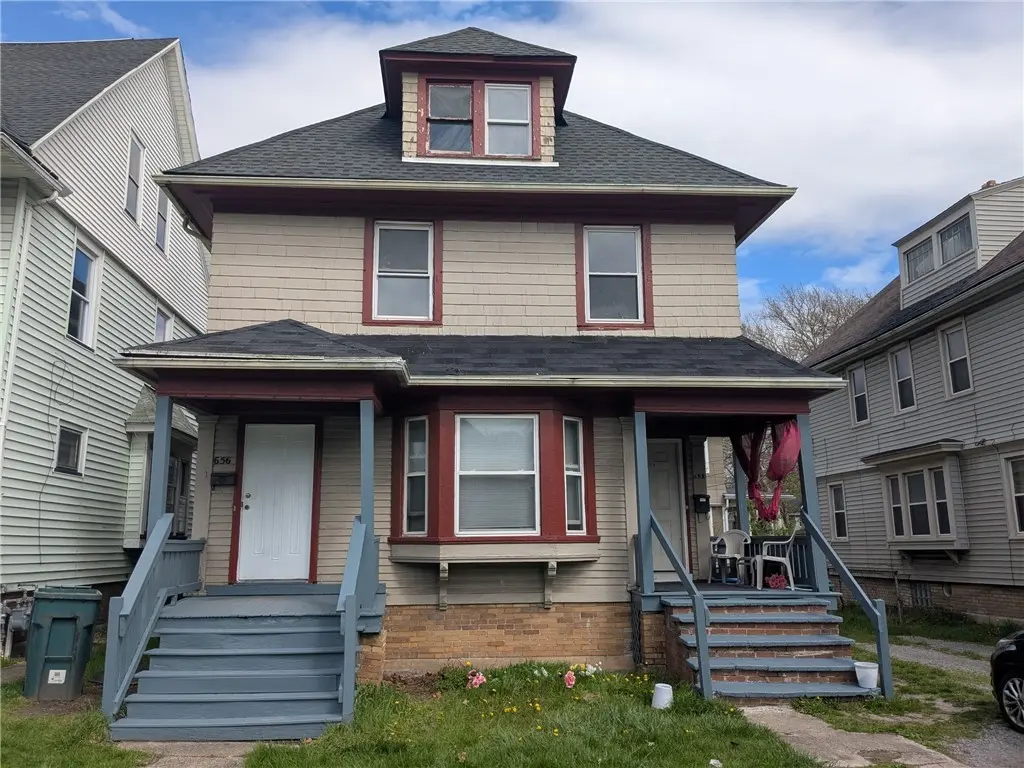
656-658 Genesee St · Rochester, NY
Flood risk 1/10 · Minimal
- FEMA flood zone
- X (unshaded)
- Chance of flooding over 30 yrs
- 0.0%
- Est. flood insurance / yr
- $473 – $860
Fire risk 1/10 · Minimal
- Est. fire insurance / yr
- $691 – $1,283
Heat risk 2/10 · Minimal
- Hot days now (above 96°F)
- 7 days/yr
- Hot days in 30 yrs
- 15 days/yr
Wind risk 1/10 · Minimal
- Chance of severe wind over 30 yrs
- —
Air-quality risk 2/10 · Minimal
- Unhealthy air days now
- 1 days/yr
- Unhealthy air days in 30 yrs
- 1 days/yr
Risk factors via First Street. Map © Google.
Why this score? — see what drove the B grade
The composite is a weighted blend of 9 inputs, each scored 0–100. Each bar is that input's sub-score; the figure is the points it added to the 100-point composite (weight × sub-score).
- Cash flow +30.0/30.0
- DSCR +10.0/10.0
- 1% rule +8.5/10.0
- ARV discount +7.5/15.0
- Rent growth +4.1/5.0
- Livability +3.8/5.0
- Appreciation +3.5/10.0
- Condition / age +2.5/5.0
- Schools +1.9/10.0
$149,900
🖨 Deal sheet 📄 Offer letter ✓ Due diligence
Listing remarks
Well-maintained up-and-down duplex located in Rochester’s desirable 19th Ward, offering a strong opportunity for both investors and owner-occupants. Each unit features 2 bedrooms and 1 full bathroom with comfortable, functional layouts, natural woodwork details, and over 2,100 square feet of total living space throughout the property. One unit is currently generating rental income, while the second offers an excellent opportunity for owner occupancy or lease-up at market rate. Ideally situated within walking distance to neighborhood shops and restaurants, the property is also just steps from the pedestrian footbridge providing direct access to the University of Rochester, making it es
Key facts
- Up and down duplex
- Off street parking
- 2 parking spots
Tags
Property features AI
Finance
- Financial info: Two total units in the building; Four units in the community; Operating expense details: see remarks; Owner pays: other (see remarks); Rent includes: see remarks; One unit reported with actual rent of $1,200 (other unit rents reported as 0 / see remarks)
Exterior
- Parking: Paved parking with two or more spaces
- Utilities: Public water connected; Sewer connected; Cable available; Circuit breaker electrical system
- Home design: Two-story building; Residential 2-unit zoning; Resale property
- Construction: Wood siding exterior; Copper plumbing; Asphalt roof; Block foundation; Existing (previously built)
- Exterior features: Rectangular residential lot; Near public transit; City street frontage
Interior
- Kitchen: Gas water heater
- Bedrooms: Two 2-bedroom units (each unit listed as 2 bedrooms)
- Flooring: Carpet; Hardwood; Linoleum; Vinyl; Varies
- Bathrooms: Two full bathrooms (total reported: 2 full bathrooms); Each of the two primary units includes 1 full bathroom
- Heating & cooling: Gas heating; Forced air heating
- Interior features: Leaded glass windows; Ceiling fan(s); Natural woodwork; Other interior features (see remarks)
- Laundry & utility: Separate gas meters for units (2); Separate electric meters for units (2)
Neighborhood map
What this means for you Summary
Snapshot
- This is a 4-bed/2.0-bath townhouse listed at $150k.
Deal economics
- At list price, monthly cash flow is $661 ($8k/yr) — positive.
- The deal already cash-flows at list — no discount required.
- Meets the 1% rule at list price ($2k rent vs $150k).
- Recommended offer: $148k (1.5% below list) — sets the bar for market timing.
- Cap rate 11.6% vs local median 9.3% in Rochester — meaningfully above typical; check what's discounted (condition, days-on-market, listing class) to confirm the premium yield is real.
Location & tenants
- Location reads 76/100 on livability (#222 in NY, #3,482 nationally) — a middle-class / working-renter tenant base. Strengths: commute A+, cost of living A+, housing A+; Watch: schools D+, crime F, employment F.
- Rochester City School District (urban): math 21% / reading 26% proficiency, ranked #589 of 590 in NY (top 100%) — low school quality limits family demand, transient renter base, plan for 1-2y turnover; 82% free/reduced lunch — lower-income household profile, screen leases tightly.
- Market conditions: Rents rising fast (+6.4%/yr); 78 active listings in the ZIP; 13 comparable units currently listed for rent nearby; rentals at typical pace (median 15d on market — plan ~3-4 weeks tenant-placement turnaround); lower-income renter base — watch delinquency; 1,169 units permitted in Monroe County in 2024 (591 in 5+ unit buildings).
- At $2,018/mo this rent would consume 77% of the median local household income ($31k/yr) (locally 2168% of renters already pay >50% of income on rent) — very limited rent-growth headroom before tenants either downsize or default.
Forward outlook
- Local home prices are declining (-2.9%/yr); year-one equity from $1k of loan paydown is wiped out by about $4k of value loss. Plan a longer hold.
- Monroe County population projected to shrink 6% by 2050 — rents likely to lag national; underwrite the cash flow, not the appreciation.
- At projected returns (-2.9% appreciation + 6.4% rent growth), your $42k cash investment doubles in ~6 years — after that, you're playing with house money.
Negotiation context
- It's been on market 28 days — a 2% lower offer ($148k) is reasonable based on typical stale-listing flexibility.
Risks & watch-outs
- Watch-outs: built in 1920 — expect roof / HVAC / electrical / plumbing capex.
Questions for the listing agent
- Built in 1920 — when were the roof, HVAC, electrical panel, plumbing, and water heater last replaced?
- Is there a deadline driving the sale (1031 exchange, divorce, estate, relocation)? That informs how much negotiation room exists.
- Schools are D-rated, which usually means shorter tenancies and higher turnover. Who's the typical renter profile here, and what's been the actual vacancy rate?
- Crime grade is F in this area — have there been break-ins, vandalism, or insurance claims at this property in the last 3 years? What carrier currently insures it and at what premium?
- What's the average days-on-market for RENTAL listings here right now (not sales)? A rising rental-DOM trend means longer vacancies and softer asking-rent achievability than the comps imply.
- What's the recent tenant-quality profile in this submarket — average credit score on applications, eviction rate, late-payment / NSF rate, and stable-employment percentage? A property-management company in the area should have these aggregated.
- How much new for-sale + rental construction is in the pipeline within 1–3 miles? Heavy new supply typically softens prices + rents 12–24 months out; constrained supply supports both.
Investment metrics
- 1% rule
- 1.35% ✓
- Cap rate
- 11.58%
- Cash-on-cash
- 18.90%
- DSCR
- 1.84
- GRM
- 6.2
CMA / ARV
- ARV (median comp)
- $149,772
- List price
- $149,900
- Delta
- 0.09%
- Verdict
- FAIR
- Comps
- 20 within 1.0 mi
Show comp detail 12 sales within ~0.75 mi
| Address | Dist | Beds/Ba | Sqft | Sold | Price | $/sf | Match |
|---|---|---|---|---|---|---|---|
| 315 Kenwood Ave | 0.43mi | 4/2.0 | 2,256 (+6%) | 8mo | $91,000 | $40 | 64 |
| 406 Champlain St | 0.58mi | 5/2.0 (+1) | 2,162 (+1%) | 15mo | $103,000 | $48 | 53 |
| 101 Superior St | 0.52mi | 5/2.0 (+1) | 2,032 (-5%) | 12mo | $85,000 | $42 | 52 |
| 121 Elba St | 0.44mi | 5/2.0 (+1) | 2,378 (+11%) | 6mo | $140,000 | $59 | 51 |
| 374 Genesee St | 0.39mi | 4/2.0 | 2,350 (+10%) | 18mo | $80,000 | $34 | 50 |
| 68 Warwick Ave | 0.74mi | 4/2.0 | 2,036 (-5%) | 13mo | $169,000 | $83 | 46 |
| 1154 Plymouth Ave S | 0.40mi | 4/2.0 | 1,823 (-15%) | 13mo | $226,000 | $124 | 46 |
| 132 Wellington Ave | 0.66mi | 4/2.0 | 1,862 (-13%) | 10mo | $150,000 | $81 | 39 |
| 27 Stanfield | 0.75mi | 4/2.0 | 1,920 (-10%) | 11mo | $194,000 | $101 | 39 |
| 288 Reynolds St | 0.57mi | 5/2.0 (+1) | 1,975 (-8%) | 22mo | $72,000 | $36 | 37 |
| 66-68 Pioneer St | 0.63mi | 4/2.0 | 2,352 (+10%) | 21mo | $220,000 | $94 | 37 |
| 7 Fenwick St St | 0.74mi | 4/2.0 | 1,890 (-12%) | 14mo | $155,000 | $82 | 35 |
Match score weights: distance 35% · size 25% · config 20% · recency 20%. Top-matched comps best support the ARV.
Projected returns pro-forma
-2.93% appreciation · 6.37% rent growth · sell at horizon
- IRR
- 14.4%
- Equity multiple
- 1.60×
- Total profit
- $25,285
- Equity at exit
- $22,809
- IRR
- 25.4%
- Equity multiple
- 3.56×
- Total profit
- $107,580
- Equity at exit
- $13,749
Cash invested: $41,972 (down + closing). Projections, not guarantees.
Landlord ↔ Tenant lean methodology
- Overall (STATE)
- 15 Strongly Tenant-Friendly
- State New York
- 15 Strongly Tenant-Friendly · D+10
- County
- — inherits STATE
- City
- — inherits STATE
ZIP-level market 14611
- Home prices YoY
- -1.1%
- Rents YoY
- 6.4%
- Active inventory
- 78
- Price-to-rent
- 6.2×
Monthly cashflow live
- Estimated rent
- $2,018 high interval (Pro) →
- Mortgage (P&I)
- −$786
- Tax from tax record
- −$85 /mo · $1,017/yr
- Insurance
- −$62
- HOA
- −$0
- Vacancy / Maint / Mgmt
- −$424
- Net cashflow
- $661
Break-even live
UW: 25.0% down · 7.5% · 30yr · 1.5% tax · 5.0% vac · 8.0% maint · 8.0% mgmt
Financing live
Cash to close
- Down payment
- $37,475
- Closing costs
- $4,497
- Reserves months
- —
- Total cash needed
- —
Loan-product check · same deal, 3 products live
Conventional
25% down · 7.5% · 30yr
- Down + closing
- —
- Monthly P&I
- —
- Monthly cashflow
- —
- DSCR
- —
- Eligible?
- —
Personal DTI + credit; lowest rate.
DSCR
20% down · 8.5% · 30yr
- Down + closing
- —
- Monthly P&I
- —
- Monthly cashflow
- —
- DSCR
- —
- Eligible?
- —
No personal income docs; deal must DSCR.
Hard money
10% down · 12.0% · 12mo
- Down + closing
- —
- Monthly P&I
- —
- Monthly cashflow
- —
- DSCR
- —
- Eligible?
- —
Short-term bridge; refi at stabilization.
Rent comps 13 comps
| Address | Beds | Baths | Sqft | Rent | $/sqft | DOM | Units | Dist |
|---|---|---|---|---|---|---|---|---|
| 79 Evangeline St Rochester, NY | 3.0 | 2.0 | 1876 | $2,500 | $1.33 | 2d | 1 | 0.48mi |
| 249 1/2 Columbia Ave #249 Rochester, NY | 3.0 | 1.0 | 1600 | $1,300 | $0.81 | 14d | 1 | 0.54mi |
| 485 Sawyer St Unit 1 Rochester, NY | 3.0 | 1.0 | 1400 | $1,900 | $1.36 | 43d | 1 | 0.54mi |
| 485 Sawyer St Rochester, NY | 3.0 | 1.0 | 1400 | $1,900 | $1.36 | 2d | 1 | 0.54mi |
| 793 Woodbine Ave Rochester, NY | 4.0 | 1.0 | 1700 | $2,200 | $1.29 | 2d | 1 | 0.65mi |
| 102 Virginia Ave Rochester, NY | 4.0 | 1.5 | 1453 | $2,150 | $1.48 | 2d | 1 | 0.76mi |
| 478 Tremont St Rochester, NY | 3.0 | 2.0 | 1424 | $1,500 | $1.05 | 43d | 1 | 0.85mi |
| 1317 Genesee St Rochester, NY | 3.0 | 2.0 | 1720 | $2,550 | $1.48 | 2d | 1 | 0.87mi |
| 48 Thorndale Ter Rochester, NY | 4.0 | 1.5 | 1700 | $1,400 | $0.82 | 14d | 1 | 0.97mi |
| 161 Fillmore St Rochester, NY | 4.0 | 2.0 | 1612 | $1,400 | $0.87 | 14d | 1 | 0.97mi |
| 839 Elmwood Ave Rochester, NY | 3.0 | 1.0 | 1500 | $2,600 | $1.73 | 23d | 1 | 1.34mi |
| 106 Gregory St Rochester, NY | 3.0 | 1.5 | 1680 | $1,995 | $1.19 | 23d | 1 | 1.37mi |
| 175 Lattimore Rd Rochester, NY | 3.0 | 1.0 | 1480 | $2,265 | $1.53 | 14d | 1 | 1.40mi |
Listing history 1 events
-
2026-04-30$149,900 Active 1104-char remark
ⓘ Source: listings_history table (triggers on properties + properties_extension) + one-shot
backfill from property_details.listing_events for pre-trigger history.
Tax reassessment forecast NY · Partial reset (capped growth)
- Current annual tax
- $1,017 · $85/mo
- Projected year-2 tax
- $1,775 · $148/mo
- Expected delta
- +$758/yr (+$63/mo · 74.6%)
ⓘ Screening estimate from a state-policy table — verify with the county assessor before closing.
Climate risk First Street
- Flood 1/10 Low FEMA zone X (unshaded) · 0% chance over 30 yrs
- Wildfire 1/10 Low
- Heat 2/10 Low 7 d/yr ≥96°F today · 15 d/yr by 30 yrs out
- Wind 1/10 Low
- Air quality 2/10 Low 1 unhealthy d/yr today · 1 by 30 yrs out
Nearby sold comps map
Loading sold comps map…
Walkable amenities ~0.75 mi
Loading nearby amenities…
Taxation est. · year 1
- Rental income
- $24,218
- − Mortgage interest
- −$8,397
- − Property taxes
- −$1,017
- − Insurance
- −$750
- − Repairs & maintenance
- −$1,937
- − Management
- −$1,937
- − Depreciation
- −$4,361
- Taxable income
- $5,819
- Est. tax owed @ 24.0%
- −$1,397
- After-tax cash flow
- $6,536/yr
For passive investors: Depreciation is non-cash, so a rental often shows a tax loss while cash-flowing — sheltering income. Rental losses are passive: they offset passive income freely, and up to $25,000/yr can offset ordinary (W-2) income if you actively participate and your MAGI is under $100k (phasing out to $0 by $150k); unused losses carry forward. On sale, claimed depreciation is recaptured at up to 25%, and gains may owe capital-gains tax (a 1031 exchange can defer both). Figures are a year-1 estimate at your 24.0% rate — not tax advice; consult a CPA.
Schools (NCES district)
- District
- Rochester City School District
- NCES district ID
- 3624750
- Math proficiency
- 21% ▬ 0.00%
- Reading proficiency
- 26% ▲ 4.00%
- Median HH income
- $30,923
- Composite
- 18.98/100
- National rank
- #8850
- State rank
- #589 of 590 in NY
Livability — Rochester
- Score
- 76/100
- State rank
- #222
- US rank
- #3482
Category grades
Schools grade is shown separately in the Schools card above.
Census & demographics
- Census place
- Rochester, NY
- County
- Monroe County · 674,131 people
- City population
- 432,803
- Metro
- Rochester, NY
- Population (ZIP)
- 17,145
- Household income
- $31,376
- Rent vs Own
- Severe rent burden
- 2168.0
Population outlook (Monroe County) Hauer SSP2
- Today (2025)
- 759,460 people
- By 2030
- 757,154 · -0.3%
- By 2040
- 740,644 · -2.5%
- By 2050
- 714,443 · -5.9%
- By 2075
- 645,883 · -15.0%
- By 2100
- 547,084 · -28.0%
Race, ethnicity, and origin ACS 2023
- Neighborhood character
- Diverse neighborhood (Simpson 0.61)
- Race & ethnicity
- Black 55% White 22% Hispanic / Latino 18% Two or more races 13% Asian 1%
- Hispanic origin (detail)
- Puerto Rican 14% Dominican 2%
- Common ancestry
- Romanian 1% Lithuanian 1% Slovak 1%
- Foreign-born
- 3% · Canada
- Languages at home
- 85% English-only · Spanish 12% French/Haitian/Cajun 1% Other Indo-European 1%
Political lean MEDSL · Monroe
- 2024 margin
- D (+19.1) · D 59.5% · R 40.5%
- 2008→2024 swing
- +1.4pp toward D · 2008: 17.7pp · 2024: 19.1pp
- All cycles
- 2024: D+19.1 2020: D+21.0 2016: D+14.1 2012: D+17.4 2008: D+17.7
Not yet ingested
- Civics
- —
Market trends
- HPI YoY
- ▼ -2.93%
- Current HPI
- 262.1549
- Rent YoY
- ▲ 6.37%
- Metro
- Rochester, NY
- State GDP YoY
- ▲ 2.60%
- F500 in state
- 92
Industry mix (Fortune 500 HQ in NY)
| Industry | F500 HQs | Revenue |
|---|---|---|
| Financial Services | 10 | $950B |
|
||
| Consumer Goods | 9 | $162B |
|
||
| Insurance | 4 | $225B |
|
||
| Telecommunications | 2 | $144B |
|
||
| Pharmaceuticals | 2 | $112B |
|
||
| Media / Entertainment | 2 | $69B |
|
||
Price history
3 events — show timeline
- 2026-05-28 Pending — UNYREIS
- 2026-05-21 Contingent — UNYREIS
- 2026-04-30 Listed $149,900 UNYREIS
Property tax history
+2.6%/yrLatest (2025): $1,017 · -4.3% YoY. Source: county tax records.
Cash-flow waterfall
monthlySold comps — $/sqft
last 12 mo · ≤1 miLoading sold comps…