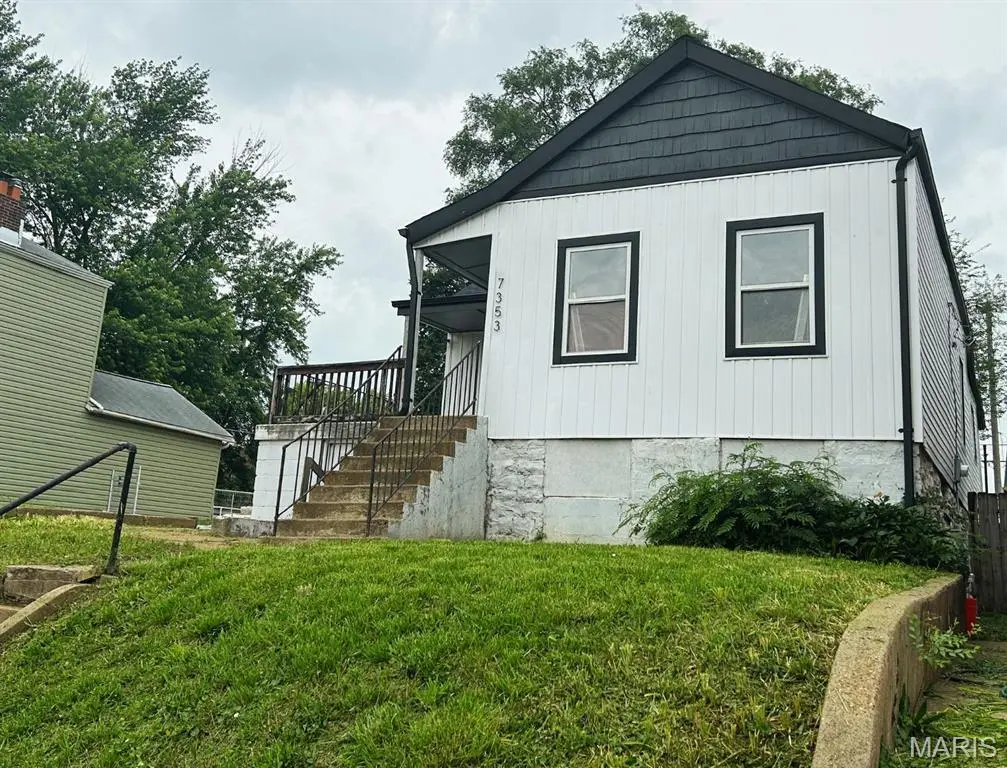
7353 Virginia Ave · St. Louis, MO
Flood risk 1/10 · Minimal
- FEMA flood zone
- X (unshaded)
- Chance of flooding over 30 yrs
- 0.0%
- Est. flood insurance / yr
- $473 – $860
Fire risk 1/10 · Minimal
- Est. fire insurance / yr
- $1,054 – $1,958
Heat risk 6/10 · Moderate
- Hot days now (above 109°F)
- 7 days/yr
- Hot days in 30 yrs
- 21 days/yr
Wind risk 2/10 · Minimal
- Chance of severe wind over 30 yrs
- 1.0%
Air-quality risk 3/10 · Minor
- Unhealthy air days now
- 3 days/yr
- Unhealthy air days in 30 yrs
- 4 days/yr
Risk factors via First Street. Map © Google.
Why this score? — see what drove the B grade
The composite is a weighted blend of 9 inputs, each scored 0–100. Each bar is that input's sub-score; the figure is the points it added to the 100-point composite (weight × sub-score).
- Cash flow +30.0/30.0
- ARV discount +15.0/15.0
- DSCR +10.0/10.0
- 1% rule +9.0/10.0
- Rent growth +3.3/5.0
- Livability +2.5/5.0
- Condition / age +2.5/5.0
- Schools +1.2/10.0
- Appreciation +0.0/10.0
$89,999
🖨 Deal sheet 📄 Offer letter ✓ Due diligence
Listing remarks
Great value-add opportunity in South St. Louis! This home underwent a full renovation and offers updated finishes and strong potential. It offers a great layout with additional storage in the basement. The property has some damages that will need to be repaired in order for it to be move-in ready again. This is an excellent opportunity for investors, rehabbers, or buyers looking to build equity - Don't miss it! Being sold in AS IS condition. Seller will not make nor pay for repairs.
Key facts
- 4,486 sq ft lot
- Built 1893
- Listed 30 days
Property features AI
Exterior
- Utilities: Public water; Public sewer; Electric service by Ameren; Electricity connected; Water available
- Home design: Single-family residential; One level; Vertical siding
- Construction: Vertical siding exterior; Basement constructed of block and concrete; Unfinished basement; Walk-out basement
- Exterior features: Front porch; Back yard; Few trees; Gentle sloping lot; Near public transit; Rectangular lot
Interior
- Kitchen: Dishwasher; Microwave; Electric oven; Refrigerator
- Bedrooms: Three bedrooms on the main level
- Bathrooms: One full bathroom on the main level
- Heating & cooling: Forced air heating; Central air conditioning
- Interior features: Basement (unfinished) with block and concrete construction and walk-out access; Dishwasher; Microwave; Electric oven; Refrigerator; Water heater
- Laundry & utility: Water heater
Neighborhood map
What this means for you Summary
Snapshot
- This is a 3-bed/1.0-bath single-family listed at $90k.
Deal economics
- At list price, monthly cash flow is $464 ($6k/yr) — positive.
- The deal already cash-flows at list — no discount required.
- Meets the 1% rule at list price ($1k rent vs $90k).
- Recommended offer: $87k (3.0% below list) — sets the bar for market timing.
- Cap rate 12.5% vs local median 5.0% in St. Louis — top-decile yield for the area; either an underpriced asset or a hidden risk that comps aren't pricing in. Stress-test before assuming the spread holds.
Location & tenants
- Location reads: area grade B — affects rentability + tenant quality, not the cash-flow math above.
- St. Louis City (urban): math 10% / reading 18% proficiency, ranked #312 of 324 in MO (top 96%) — low school quality limits family demand, transient renter base, plan for 1-2y turnover; 80% free/reduced lunch — lower-income household profile, screen leases tightly.
- Zoned schools: Ashland Elem. And Br. (math 2% / reading 2%, grade F, #1,099 of 1,115 statewide, top 100%, 226 students, 99% FRL); Beaumont Cte High School (math 5% / reading 5%, grade F, #517 of 521 statewide, top 100%, 236 students, 99% FRL) — zoned schools average 99% FRL vs 80% district-wide (18 pts higher); higher-poverty schools than district average — tighter screening recommended.
- Market conditions: Rents rising (+3.3%/yr); 125 active listings in the ZIP; 40 comparable units currently listed for rent nearby; rentals at typical pace (median 24d on market — plan ~3-4 weeks tenant-placement turnaround); 48% of comp listings sitting > 30 days — soft ceiling on asking rent; 294 units permitted in St. Louis city in 2024 (227 in 5+ unit buildings).
- This rent runs 32% of the median local income ($47k/yr) — at the standard rent-burdened threshold; future hikes will face affordability resistance.
Forward outlook
- Local home prices are declining (-3.0%/yr); year-one equity from $622 of loan paydown is wiped out by about $3k of value loss. Plan a longer hold.
- St. Louis County population projected to shrink 6% by 2050 — rents likely to lag national; underwrite the cash flow, not the appreciation.
- At projected returns (-3.0% appreciation + 3.3% rent growth), your $25k cash investment doubles in ~6 years — after that, you're playing with house money.
Negotiation context
- It's been on market 31 days — a 3% lower offer ($87k) is reasonable based on typical stale-listing flexibility.
- 7 sale attempts since 14y ago with the ask held roughly flat each time — persistent listings suggest the price (not the market) is what's stuck; bring a comps-based counter.
Risks & watch-outs
- Watch-outs: built in 1893 — expect roof / HVAC / electrical / plumbing capex.
- Climate carrying-cost: extreme-heat days projected 7→21/yr by 2055 (HVAC capex compounding) — expect insurance premiums to compound above CPI over the hold.
Questions for the listing agent
- It's been on market 31 days. Have you received any prior offers? Is the seller open to a 3% concession, seller financing, or rate buy-down credit?
- Built in 1893 — when were the roof, HVAC, electrical panel, plumbing, and water heater last replaced?
- Is there a deadline driving the sale (1031 exchange, divorce, estate, relocation)? That informs how much negotiation room exists.
- What's the average days-on-market for RENTAL listings here right now (not sales)? A rising rental-DOM trend means longer vacancies and softer asking-rent achievability than the comps imply.
- What's the recent tenant-quality profile in this submarket — average credit score on applications, eviction rate, late-payment / NSF rate, and stable-employment percentage? A property-management company in the area should have these aggregated.
- How much new for-sale + rental construction is in the pipeline within 1–3 miles? Heavy new supply typically softens prices + rents 12–24 months out; constrained supply supports both.
Investment metrics
- 1% rule
- 1.40% ✓
- Cap rate
- 12.48%
- Cash-on-cash
- 22.09%
- DSCR
- 1.98
- GRM
- 6.0
CMA / ARV
- ARV (on-the-fly)
- $170,903
- Comps found
- 12
Show comp detail 12 sales within ~0.75 mi
| Address | Dist | Beds/Ba | Sqft | Sold | Price | $/sf | Match |
|---|---|---|---|---|---|---|---|
| 7342 Alabama Ave | 0.10mi | 3/1.0 | 1,116 (-3%) | 10mo | $94,900 | $85 | 82 |
| 7205 Pennsylvania Ave | 0.25mi | 2/2.0 (-1) | 1,101 (-4%) | 1mo | $160,000 | $145 | 72 |
| 7725 Ivory Ave | 0.24mi | 3/1.5 | 1,275 (+11%) | 2mo | $150,000 | $118 | 67 |
| 7300 Vermont Ave | 0.10mi | 2/1.5 (-1) | 992 (-14%) | 0mo | $199,900 | $202 | 65 |
| 6610 Alabama Ave | 0.54mi | 2/1.0 (-1) | 1,172 (+2%) | 3mo | $145,000 | $124 | 64 |
| 324 Hurck St | 0.60mi | 3/2.5 | 1,157 (+1%) | 5mo | $165,900 | $143 | 60 |
| 3729 Upton St | 0.60mi | 3/1.0 | 1,050 (-8%) | 1mo | $181,500 | $173 | 57 |
| 7111 S Grand Ave | 0.43mi | 2/2.0 (-1) | 1,248 (+9%) | 6mo | $225,000 | $180 | 52 |
| 7105 S Grand Blvd | 0.43mi | 2/1.0 (-1) | 976 (-15%) | 8mo | $219,000 | $224 | 43 |
| 510 Holly Hills Ave | 0.65mi | 3/1.5 | 1,304 (+14%) | 3mo | $194,500 | $149 | 42 |
| 3629 Blow St | 0.49mi | 2/2.5 (-1) | 1,260 (+10%) | 9mo | $235,000 | $187 | 42 |
| 8309 Minnesota Ave | 0.62mi | 2/1.0 (-1) | 1,292 (+13%) | 8mo | $140,000 | $108 | 39 |
Match score weights: distance 35% · size 25% · config 20% · recency 20%. Top-matched comps best support the ARV.
Projected returns pro-forma
-3.0% appreciation · 3.27% rent growth · sell at horizon
- IRR
- 15.1%
- Equity multiple
- 1.61×
- Total profit
- $15,260
- Equity at exit
- $13,419
- IRR
- 23.9%
- Equity multiple
- 3.09×
- Total profit
- $52,583
- Equity at exit
- $7,781
Cash invested: $25,200 (down + closing). Projections, not guarantees.
Landlord ↔ Tenant lean methodology
- Overall (STATE)
- 81 Strongly Landlord-Friendly
- State Missouri
- 81 Strongly Landlord-Friendly · R+10
- County
- — inherits STATE
- City
- — inherits STATE
ZIP-level market 63111
- Rents YoY
- 3.3%
- Active inventory
- 125
- Price-to-rent
- 6.0×
Monthly cashflow live
- Estimated rent
- $1,257 high interval (Pro) →
- Mortgage (P&I)
- −$472
- Tax from tax record
- −$20 /mo · $238/yr
- Insurance
- −$37
- HOA
- −$0
- Vacancy / Maint / Mgmt
- −$264
- Net cashflow
- $464
Break-even live
UW: 25.0% down · 7.5% · 30yr · 1.5% tax · 5.0% vac · 8.0% maint · 8.0% mgmt
Financing live
Cash to close
- Down payment
- $22,500
- Closing costs
- $2,700
- Reserves months
- —
- Total cash needed
- —
Loan-product check · same deal, 3 products live
Conventional
25% down · 7.5% · 30yr
- Down + closing
- —
- Monthly P&I
- —
- Monthly cashflow
- —
- DSCR
- —
- Eligible?
- —
Personal DTI + credit; lowest rate.
DSCR
20% down · 8.5% · 30yr
- Down + closing
- —
- Monthly P&I
- —
- Monthly cashflow
- —
- DSCR
- —
- Eligible?
- —
No personal income docs; deal must DSCR.
Hard money
10% down · 12.0% · 12mo
- Down + closing
- —
- Monthly P&I
- —
- Monthly cashflow
- —
- DSCR
- —
- Eligible?
- —
Short-term bridge; refi at stabilization.
Rent comps 40 comps
| Address | Beds | Baths | Sqft | Rent | $/sqft | DOM | Units | Dist |
|---|---|---|---|---|---|---|---|---|
| 7417 Vermont Ave St. Louis, MO | 1.0–2.0 | 1.0–2.0 | 1144 | $1,600 | $1.40 | 1d | 8 | 0.11mi |
| 7417 Vermont Ave Unit 103 St. Louis, MO | 2.0 | 2.0 | 1069 | $1,500 | $1.40 | 14d | 1 | 0.12mi |
| 7614 Virginia Ave Unit 7614 St. Louis, MO | 2.0 | 1.0 | 750 | $750 | $1.00 | 23d | 1 | 0.16mi |
| 125 Koeln Ave Saint Louis, MO | 2.0 | 1.0 | 833 | $1,499 | $1.80 | 43d | 1 | 0.20mi |
| 807 W Courtois St Apt D St. Louis, MO | 2.0 | 1.0 | 900 | $925 | $1.03 | 43d | 1 | 0.25mi |
| 813 W Courtois St Apt C St. Louis, MO | 2.0 | 1.0 | 1000 | $895 | $0.90 | 43d | 1 | 0.25mi |
| 7024 Pennsylvania Ave Unit F St. Louis, MO | 2.0 | 1.0 | 1081 | $930 | $0.86 | 16d | 1 | 0.31mi |
| 6915 Alabama Ave Unit 1st Floor St. Louis, MO | 2.0 | 1.0 | 1248 | $1,200 | $0.96 | 43d | 1 | 0.34mi |
| 7924 Michigan Ave Unit 2F St. Louis, MO | 3.0 | 2.0 | 1250 | $1,195 | $0.96 | 3d | 1 | 0.37mi |
| 6800 Virginia Ave Unit 1 St. Louis, MO | 3.0 | 1.0 | 1500 | $1,475 | $0.98 | 17d | 1 | 0.41mi |
| 8125 Michigan Ave St. Louis, MO | 1.0–2.0 | 1.0–2.0 | 797 | $1,150 | $1.44 | 14d | 1 | 0.48mi |
| 7851 Bandero Dr Saint Louis, MO | 1.0–2.0 | 1.0 | 800 | $1,100 | $1.38 | 12d | 1 | 0.50mi |
| 128 Haven St Unit 2F St. Louis, MO | 2.0 | 1.0 | 900 | $950 | $1.06 | 10d | 1 | 0.52mi |
| 6436 Idaho Ave Saint Louis, MO | 2.0 | 1.0 | 1050 | $995 | $0.95 | 43d | 1 | 0.61mi |
| 7109 Eugene Ave Saint Louis, MO | 3.0 | 2.0 | 1029 | $1,495 | $1.45 | 2d | 1 | 0.62mi |
| 3601 Holly Hills Blvd Apt 19 St. Louis, MO | 2.0 | 1.0 | 700 | $875 | $1.25 | 3d | 1 | 0.82mi |
| 711 Wilmington Ave Unit NA St. Louis, MO | 2.0 | 1.0 | 1051 | $1,300 | $1.24 | 43d | 1 | 0.98mi |
| 712 Dover Pl Unit 1FL St. Louis, MO | 2.0 | 1.0 | 1100 | $1,000 | $0.91 | 43d | 1 | 1.01mi |
| 712 Dover Pl Saint Louis, MO | 2.0 | 1.0 | 1100 | $900 | $0.82 | 43d | 1 | 1.01mi |
| 736 Dover Pl Unit 1F St. Louis, MO | 2.0 | 1.0 | 1200 | $1,395 | $1.16 | 43d | 1 | 1.02mi |
| 3945 Crosby Dr Saint Louis, MO | 2.0 | 1.0 | 1100 | $2,083 | $1.89 | 1d | 1 | 1.04mi |
| 3668 Wilmington Ave Saint Louis, MO | 2.0 | 1.0 | 1214 | $1,350 | $1.11 | 43d | 1 | 1.09mi |
| 3641 Wilmington Ave Saint Louis, MO | 2.0 | 1.0 | 1175 | $1,050 | $0.89 | 43d | 1 | 1.10mi |
| 3668a Wilmington Ave St. Louis, MO | 2.0 | 1.0 | 1212 | $1,295 | $1.07 | 14d | 1 | 1.10mi |
| 207 Waller Ave Saint Louis, MO | 2.0 | 1.0 | 900 | $1,075 | $1.19 | 23d | 1 | 1.11mi |
| 7113 Leona St Saint Louis, MO | 3.0 | 1.0 | 864 | $1,765 | $2.04 | 43d | 1 | 1.14mi |
| 3815 Wilmington Ave Apt 2N St. Louis, MO | 2.0 | 1.0 | 800 | $1,095 | $1.37 | 43d | 1 | 1.22mi |
| 304 Bayless Ave Saint Louis, MO | 3.0 | 1.0 | 1104 | $1,950 | $1.77 | 1d | 1 | 1.22mi |
| 229 Horn Ave Saint Louis, MO | 2.0 | 1.5 | 1301 | $1,871 | $1.44 | 1d | 1 | 1.24mi |
| 5707 Dewey Ave Unit 1F St. Louis, MO | 2.0 | 1.0 | 1000 | $1,050 | $1.05 | 14d | 1 | 1.25mi |
| 709 Dammert Ave Unit Labs St. Louis, MO | 2.0 | 1.5 | 800 | $1,100 | $1.38 | 43d | 1 | 1.30mi |
| 7428 Morganford Rd Saint Louis, MO | 2.0 | 1.0 | 969 | $1,500 | $1.55 | 43d | 1 | 1.35mi |
| 4114 Alma Ave Saint Louis, MO | 3.0 | 1.5 | 1269 | $2,065 | $1.63 | 1d | 1 | 1.35mi |
| 440 Eichelberger St Saint Louis, MO | 2.0 | 1.0 | 750 | $850 | $1.13 | 3d | 1 | 1.36mi |
| 5305 S Compton Ave St. Louis, MO | 2.0 | 1.0 | 750 | $825 | $1.10 | 43d | 1 | 1.36mi |
| 349 Lagro Ave Saint Louis, MO | 3.0 | 1.0 | 1184 | $1,500 | $1.27 | 43d | 1 | 1.39mi |
| 336 Lagro Ave Saint Louis, MO | 2.0 | 2.0 | 1340 | $1,250 | $0.93 | 43d | 1 | 1.41mi |
| 4075 Bowen St Saint Louis, MO | 2.0 | 1.0 | 1200 | $1,200 | $1.00 | 43d | 1 | 1.41mi |
| 5217 S Grand Blvd Saint Louis, MO | 2.0 | 1.0 | 870 | $1,125 | $1.29 | 14d | 1 | 1.45mi |
| 6135 Newport Ave Saint Louis, MO | 2.0 | 1.0 | 960 | $1,976 | $2.06 | 1d | 1 | 1.47mi |
Listing history 35 events
-
2026-06-18days on market $89,999 Active 31 DOM
-
2026-06-17days on market $89,999 Active 30 DOM
-
2026-06-16days on market $89,999 Active 29 DOM
-
2026-06-15days on market $89,999 Active 28 DOM
-
2026-06-13days on market $89,999 Active 26 DOM
-
2026-06-09days on market $89,999 Active 22 DOM
-
2026-06-08days on market $89,999 Active 21 DOM
-
2026-06-07days on market $89,999 Active 20 DOM
-
2026-06-05days on market $89,999 Active 17 DOM
-
2026-06-03days on market $89,999 Active 16 DOM
-
2026-06-02days on market $89,999 Active 15 DOM
-
2026-06-01days on market $89,999 Active 14 DOM
-
2026-05-31days on market $89,999 Active 13 DOM
-
2026-05-19$89,999 Active
-
2026-05-18historical $89,999
-
2026-05-17$89,999 Active
-
2026-05-17historical $89,999
-
2025-08-04status Active
-
2025-07-17status Pending
-
2025-07-14price $99,900
-
2025-07-01$109,900 Active
-
2025-04-25historical
-
2025-02-07status Active
-
2025-01-13status Pending
-
2024-09-23price $99,900
-
2024-09-02price $114,000
-
2024-04-08price $119,900
-
2024-01-11price $129,900
-
2023-12-25$159,900 Active
-
2020-11-23soldstatus $128,000
-
2019-03-19soldstatus $150,000
-
2013-08-01soldstatus
-
2013-07-30soldstatus
-
2012-12-23$13,000
-
1999-05-27soldstatus $37,700
ⓘ Source: listings_history table (triggers on properties + properties_extension) + one-shot
backfill from property_details.listing_events for pre-trigger history.
Tax reassessment forecast MO · Resets to sale price
- Current annual tax
- $238 · $20/mo
- Projected year-2 tax
- $873 · $73/mo
- Expected delta
- +$635/yr (+$53/mo · 266.6%)
ⓘ Screening estimate from a state-policy table — verify with the county assessor before closing.
Climate risk First Street
- Flood 1/10 Low FEMA zone X (unshaded) · 0% chance over 30 yrs
- Wildfire 1/10 Low
- Heat 6/10 Major 7 d/yr ≥109°F today · 21 d/yr by 30 yrs out
- Wind 2/10 Low 100% chance of damaging wind over 30 yrs
- Air quality 3/10 Moderate 3 unhealthy d/yr today · 4 by 30 yrs out
Nearby sold comps map
Loading sold comps map…
Walkable amenities ~0.75 mi
Loading nearby amenities…
Taxation est. · year 1
- Rental income
- $15,085
- − Mortgage interest
- −$5,041
- − Property taxes
- −$238
- − Insurance
- −$450
- − Repairs & maintenance
- −$1,207
- − Management
- −$1,207
- − Depreciation
- −$2,618
- Taxable income
- $4,324
- Est. tax owed @ 24.0%
- −$1,038
- After-tax cash flow
- $4,528/yr
For passive investors: Depreciation is non-cash, so a rental often shows a tax loss while cash-flowing — sheltering income. Rental losses are passive: they offset passive income freely, and up to $25,000/yr can offset ordinary (W-2) income if you actively participate and your MAGI is under $100k (phasing out to $0 by $150k); unused losses carry forward. On sale, claimed depreciation is recaptured at up to 25%, and gains may owe capital-gains tax (a 1031 exchange can defer both). Figures are a year-1 estimate at your 24.0% rate — not tax advice; consult a CPA.
Schools (NCES district)
- District
- St. Louis City
- NCES district ID
- 2929280
- Math proficiency
- 10% ▼ -6.00%
- Reading proficiency
- 18% ▼ -3.00%
- Median HH income
- $35,685
- Composite
- 11.54/100
- National rank
- #9699
- State rank
- #312 of 324 in MO
Livability — St. Louis
No livability data for this city. (Only ~50 U.S. cities are tracked.)
Census & demographics
- Census place
- St. Louis, MO
- County
- Saint Louis City · 254,015 people
- City population
- 283,259
- Metro
- St. Louis, MO-IL
- Population (ZIP)
- 18,851
- Household income
- $47,039
- Rent vs Own
- Severe rent burden
- 1364.0
Population outlook (St. Louis County) Hauer SSP2
- Today (2025)
- 315,737 people
- By 2030
- 313,865 · -0.6%
- By 2040
- 305,439 · -3.3%
- By 2050
- 296,529 · -6.1%
- By 2075
- 271,028 · -14.2%
- By 2100
- 255,359 · -19.1%
Race, ethnicity, and origin ACS 2023
- Neighborhood character
- Diverse neighborhood (Simpson 0.65)
- Race & ethnicity
- Black 42% White 41% Two or more races 11% Hispanic / Latino 9% Asian 1%
- Hispanic origin (detail)
- Mexican 6%
- Common ancestry
- Lithuanian 3% Slovak 1% Romanian 1%
- Foreign-born
- 7% · Canada, India
- Languages at home
- 90% English-only · Spanish 7% Other Indo-European 1%
Political lean MEDSL · St. Louis
- 2024 margin
- Solid D (+64.7) · D 81.4% · R 16.7% · Other 2.0%
- 2008→2024 swing
- -3.5pp toward R · 2008: 68.2pp · 2024: 64.7pp
- All cycles
- 2024: D+64.7 2020: D+66.2 2016: D+63.7 2012: D+66.6 2008: D+68.2
Not yet ingested
- Civics
- —
Market trends
- HPI YoY
- ▼ -92.80%
- Current HPI
- 169.4644
- Rent YoY
- ▲ 3.27%
- Metro
- St. Louis, MO-IL
- State GDP YoY
- ▲ 1.84%
- F500 in state
- 20
Industry mix (Fortune 500 HQ in MO)
| Industry | F500 HQs | Revenue |
|---|---|---|
| Healthcare | 1 | $163B |
|
||
| Insurance | 1 | $21B |
|
||
| Industrial Technology | 1 | $17B |
|
||
| Retail | 1 | $16B |
|
||
| Industrial Distribution | 1 | $10B |
|
||
| Utilities | 1 | $9B |
|
||
Price history
+138.7% since first listed22 events — show timeline
- 2026-05-19 Listed $89,999 MARIS as Distributed by MLS Grid
- 2026-05-18 Coming Soon $89,999 MARIS as Distributed by MLS Grid
- 2026-05-17 Listed $89,999 MARIS as Distributed by MLS Grid
- 2026-05-17 Coming Soon $89,999 MARIS as Distributed by MLS Grid
- 2025-08-04 Relisted — MARIS as Distributed by MLS Grid
- 2025-07-17 Pending — MARIS as Distributed by MLS Grid
- 2025-07-14 Price Changed $99,900 MARIS as Distributed by MLS Grid
- 2025-07-01 Listed $109,900 MARIS as Distributed by MLS Grid
- 2025-04-25 Delisted — MARIS as Distributed by MLS Grid
- 2025-02-07 Relisted — MARIS as Distributed by MLS Grid
- 2025-01-13 Pending — MARIS as Distributed by MLS Grid
- 2024-09-23 Price Changed $99,900 MARIS as Distributed by MLS Grid
- 2024-09-02 Price Changed $114,000 MARIS as Distributed by MLS Grid
- 2024-04-08 Price Changed $119,900 MARIS as Distributed by MLS Grid
- 2024-01-11 Price Changed $129,900 MARIS as Distributed by MLS Grid
- 2023-12-25 Listed $159,900 MARIS as Distributed by MLS Grid
- 2020-11-23 Sold (Public Records) $128,000 Public Records
- 2019-03-19 Sold (Public Records) $150,000 Public Records
- 2013-08-01 Sold (Public Records) — Public Records
- 2013-07-30 Sold (MLS) — MARIS as Distributed by MLS Grid
- 2012-12-23 Listed $13,000 MARIS as Distributed by MLS Grid
- 1999-05-27 Sold (Public Records) $37,700 Public Records
Property tax history
+1.8%/yrLatest (2024): $238 · +4.5% YoY. Source: county tax records.
Cash-flow waterfall
monthlySold comps — $/sqft
last 12 mo · ≤1 miLoading sold comps…