37311 E 47th St #161 · Palmdale, CA
Flood risk 1/10 · Minimal
- FEMA flood zone
- X (shaded)
- Chance of flooding over 30 yrs
- 0.0%
- Est. flood insurance / yr
- $507 – $1,088
Fire risk 7/10 · Major
- Est. fire insurance / yr
- $659 – $1,223
Heat risk 6/10 · Moderate
- Hot days now (above 99°F)
- 4 days/yr
- Hot days in 30 yrs
- 9 days/yr
Wind risk 1/10 · Minimal
- Chance of severe wind over 30 yrs
- —
Air-quality risk 10/10 · Severe
- Unhealthy air days now
- 27 days/yr
- Unhealthy air days in 30 yrs
- 34 days/yr
Risk factors via First Street. Map © Google.
Why this score? — see what drove the B+ grade
The composite is a weighted blend of 9 inputs, each scored 0–100. Each bar is that input's sub-score; the figure is the points it added to the 100-point composite (weight × sub-score).
- Cash flow +30.0/30.0
- ARV discount +15.0/15.0
- 1% rule +10.0/10.0
- DSCR +10.0/10.0
- Livability +2.8/5.0
- Rent growth +2.5/5.0
- Schools +2.5/10.0
- Condition / age +2.5/5.0
- Appreciation +0.0/10.0
$139,000
🖨 Deal sheet (PDF) 📄 Offer letter ✓ Due diligence
Listing remarks
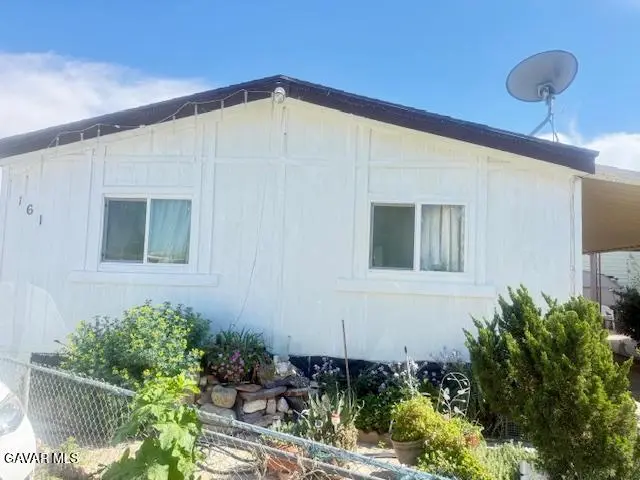
Motivated seller! All offers will be considered Double wide home, well-maintained 3-bedroom, 2-bathroom mobile home. In a Senior Park Community, for seniors 55 and over! Offering 1,536 sq ft of comfortable living lifestyle, The open floor plan allows for plenty of natural light, Community Amenities: swimming pool, on-site laundry facility, country clubhouse/recreational center. Ample RV, boat, and guest parking Prime Location: Just a short walk from shopping-Walmart & Stater Brothers and Walgreens. Just walking distance from restaurants and IN SHAPE gym. Schedule your showing today!
Key facts
- Community pool
- Built 1981
- Listed 87 days
Property features AI
Finance
- Other: Manager: James Musica (661-285-4555); APN: 8950-102-161; Unit has awning
- HOA & community: Park features include recreation area, clubhouse/rec room, and pool; New space rent $700; park deposit $1,000; deposit $3,000
Exterior
- Utilities: Natural gas
- Home design: Mobile/manufactured home; Manufactured in 1980; Length 64 ft, Width 24 ft; Senior park (Seniors only); Located in Thousand Elms park, space #161
- Construction: Composition shingle roof; Manufactured by Kauman Broad (model: Kauman Broad); Trade name: Cayon Crest; Serial/Label: KBCASNA115230; CAL207221/CAL20722
- Exterior features: Recreation area; Clubhouse/rec room; Pool; Skirted mobile home
Interior
- Kitchen: Dishwasher; Gas Range
- Bathrooms: 2 full bathrooms
- Heating & cooling: Central heating (gas); Central air
- Interior features: Dishwasher; Gas Range; Awning
Neighborhood map
What this means for you Summary
Snapshot
- This is a 3-bed/2.0-bath manufactured listed at $139k.
Deal economics
- At list price, monthly cash flow is $2k ($19k/yr) — positive.
- The deal already cash-flows at list — no discount required.
- Meets the 1% rule at list price ($3k rent vs $139k).
- Recommended offer: $131k (6.0% below list) — sets the bar for market timing.
- Cap rate 19.7% vs local median 4.5% in Palmdale — top-decile yield for the area; either an underpriced asset or a hidden risk that comps aren't pricing in. Stress-test before assuming the spread holds.
Location & tenants
- Location reads 55/100 on livability (#861 in CA) — a working-class tenant base; expect higher turnover. Strengths: housing A+; Watch: crime F, amenities F, cost of living F.
- Palmdale Elementary (suburban): math 20% / reading 31% proficiency, ranked #1,147 of 1,400 in CA (top 82%) — low school quality limits family demand, transient renter base, plan for 1-2y turnover; 69% free/reduced lunch — lower-income household profile, screen leases tightly.
- Zoned schools: Palmdale Learning Plaza (783 students, 80% FRL); Cactus Medical Health And Technology Magnet Academy (865 students, 92% FRL); William J. (Pete) Knight High (2,793 students, 55% FRL).
- Market conditions: 129 active listings in the ZIP; 19 comparable units currently listed for rent nearby; rentals leasing fast (median 0d on market — plan ~1-2 weeks tenant-placement turnaround); solid renter incomes; 19,697 units permitted in Los Angeles County in 2024 (9,426 in 5+ unit buildings).
- This rent runs 44% of the median local income ($86k/yr) — at the standard rent-burdened threshold; future hikes will face affordability resistance.
Forward outlook
- Local home prices are declining (-3.0%/yr); year-one equity from $961 of loan paydown is wiped out by about $4k of value loss. Plan a longer hold.
- Los Angeles County population projected at +9% by 2050 — modest demand growth; plan on rents tracking national, not racing it.
- At projected returns (-3.0% appreciation + 3.0% rent growth), your $39k cash investment doubles in ~3 years — after that, you're playing with house money.
Negotiation context
- It's been on market 87 days — a 6% lower offer ($131k) is reasonable based on typical stale-listing flexibility.
- 4 sale attempts since 8y ago; this cycle's ask has dropped $11k (7%) from the opening price — seller is motivated, your offer sets the floor, not the list.
- Current owner paid $57k; list at $139k implies a 144% gain — meaningful room to come down on a strong offer.
Risks & watch-outs
- Climate carrying-cost: major wildfire risk; extreme-heat days projected 4→9/yr by 2055 (HVAC capex compounding) — expect insurance premiums to compound above CPI over the hold.
Questions for the listing agent
- It's been on market 87 days. Have you received any prior offers? Is the seller open to a 6% concession, seller financing, or rate buy-down credit?
- Why hasn't it sold? Are there any deal-killer items the seller is aware of (foundation, flood, title, zoning, code violations)?
- Is there a deadline driving the sale (1031 exchange, divorce, estate, relocation)? That informs how much negotiation room exists.
- Schools are F-rated, which usually means shorter tenancies and higher turnover. Who's the typical renter profile here, and what's been the actual vacancy rate?
- Crime grade is F in this area — have there been break-ins, vandalism, or insurance claims at this property in the last 3 years? What carrier currently insures it and at what premium?
- What's the average days-on-market for RENTAL listings here right now (not sales)? A rising rental-DOM trend means longer vacancies and softer asking-rent achievability than the comps imply.
- What's the recent tenant-quality profile in this submarket — average credit score on applications, eviction rate, late-payment / NSF rate, and stable-employment percentage? A property-management company in the area should have these aggregated.
- How much new for-sale + rental construction is in the pipeline within 1–3 miles? Heavy new supply typically softens prices + rents 12–24 months out; constrained supply supports both.
Investment metrics
- 1% rule
- 2.29% ✓
- Cap rate
- 19.73%
- Cash-on-cash
- 47.98%
- DSCR
- 3.13
- GRM
- 3.6
CMA / ARV
- ARV (on-the-fly)
- $179,712
- Comps found
- 4
Show comp detail 4 sales within ~0.75 mi
| Address | Dist | Beds/Ba | Sqft | Sold | Price | $/sf | Match |
|---|---|---|---|---|---|---|---|
| 37311 E 47th St #124 | 0.10mi | 3/2.0 | 1,440 (-6%) | 16mo | $155,000 | $108 | 71 |
| 4444 E Avenue R #152 | 0.73mi | 2/2.0 (-1) | 1,440 (-6%) | 6mo | $110,000 | $76 | 46 |
| 4444 E Avenue R #122 | 0.70mi | 3/2.0 | 1,392 (-9%) | 20mo | $240,000 | $172 | 35 |
| 4444 E Avenue R Spc 120 | 0.70mi | 3/2.0 | 1,344 (-12%) | 20mo | $157,000 | $117 | 30 |
Match score weights: distance 35% · size 25% · config 20% · recency 20%. Top-matched comps best support the ARV.
Projected returns pro-forma
-3.0% appreciation · 3.0% rent growth · sell at horizon
- IRR
- 45.4%
- Equity multiple
- 2.97×
- Total profit
- $76,629
- Equity at exit
- $20,725
- IRR
- 51.3%
- Equity multiple
- 6.00×
- Total profit
- $194,536
- Equity at exit
- $12,018
Cash invested: $38,920 (down + closing). Projections, not guarantees.
Landlord ↔ Tenant lean methodology
- Overall (STATE)
- 18 Strongly Tenant-Friendly
- State California
- 18 Strongly Tenant-Friendly · D+13
- County
- — inherits STATE
- City
- — inherits STATE
ZIP-level market 93552
- Home prices YoY
- -6.4%
- Active inventory
- 129
- Price-to-rent
- 3.6×
Monthly cashflow live
- Estimated rent
- $3,186 high interval (Pro) →
- Mortgage (P&I)
- −$729
- Tax est. 1.5%
- −$174 /mo · $2,085/yr
- Insurance
- −$58
- HOA
- −$0
- Vacancy / Maint / Mgmt
- −$669
- Net cashflow
- $1,556
Break-even live
Sensitivity live
| Price | -10% $1,652 | -5% $1,604 | +0% $1,556 | +5% $1,508 | +10% $1,460 |
|---|---|---|---|---|---|
| Rent | -10% $1,304 | -5% $1,430 | +0% $1,556 | +5% $1,682 | +10% $1,808 |
| Rate | -1.0pp $1,626 | -0.5pp $1,591 | base $1,556 | +0.5pp $1,520 | +1.0pp $1,483 |
UW: 25.0% down · 7.5% · 30yr · 1.5% tax · 5.0% vac · 8.0% maint · 8.0% mgmt
Financing live
Cash to close
- Down payment
- $34,750
- Closing costs
- $4,170
- Reserves months
- —
- Total cash needed
- —
Loan-product check · same deal, 3 products live
Conventional
25% down · 7.5% · 30yr
- Down + closing
- —
- Monthly P&I
- —
- Monthly cashflow
- —
- DSCR
- —
- Eligible?
- —
Personal DTI + credit; lowest rate.
DSCR
20% down · 8.5% · 30yr
- Down + closing
- —
- Monthly P&I
- —
- Monthly cashflow
- —
- DSCR
- —
- Eligible?
- —
No personal income docs; deal must DSCR.
Hard money
10% down · 12.0% · 12mo
- Down + closing
- —
- Monthly P&I
- —
- Monthly cashflow
- —
- DSCR
- —
- Eligible?
- —
Short-term bridge; refi at stabilization.
Rent comps 19 comps
| Address | Beds | Baths | Sqft | Rent | $/sqft | DOM | Units | Dist |
|---|---|---|---|---|---|---|---|---|
| 37526 Rose St Palmdale, CA | 3.0 | 2.0 | 1361 | $3,150 | $2.31 | 0d | 1 | 0.25mi |
| 37333 Scranton Ct Palmdale, CA | 3.0 | 2.0 | 1756 | $2,850 | $1.62 | 26d | 1 | 0.49mi |
| 4636 Blue Ridge Ave Palmdale, CA | 3.0 | 2.0 | 1526 | $3,000 | $1.97 | 25d | 1 | 0.52mi |
| 37210 Sabal Ave Palmdale, CA | 3.0 | 2.0 | 1198 | $2,395 | $2.00 | 0d | 1 | 0.81mi |
| 5327 Meredith Ave Palmdale, CA | 4.0 | 2.0 | 1600 | $3,200 | $2.00 | 0d | 1 | 0.83mi |
| 36717 Sulphur Springs Rd Palmdale, CA | 3.0 | 2.0 | 1548 | $3,100 | $2.00 | 20d | 1 | 0.86mi |
| 37734 Tackstem St Palmdale, CA | 4.0 | 2.0 | 1488 | $2,950 | $1.98 | 0d | 1 | 0.93mi |
| 37147 Alder St Palmdale, CA | 3.0 | 2.5 | 1712 | $2,900 | $1.69 | 0d | 1 | 0.94mi |
| 4206 East Avenue Q-14 Unit Q14 Palmdale, CA | 3.0 | 2.0 | 1150 | $2,850 | $2.48 | 0d | 1 | 1.03mi |
| 3559 E Avenue R14 Palmdale, CA | 4.0 | 2.5 | 1483 | $2,895 | $1.95 | 0d | 1 | 1.03mi |
| 37347 Waterman Ave Palmdale, CA | 3.0 | 2.0 | 1383 | $3,350 | $2.42 | 0d | 1 | 1.13mi |
| 36805 Alder St Palmdale, CA | 3.0 | 2.0 | 1189 | $2,700 | $2.27 | 21d | 1 | 1.15mi |
| 37707 57th St E Palmdale, CA | 3.0 | 2.5 | 1454 | $2,700 | $1.86 | 0d | 1 | 1.16mi |
| 5335 Carlo Ct Palmdale, CA | 4.0 | 2.5 | 1922 | $3,450 | $1.80 | 4d | 1 | 1.28mi |
| 36521 Windtree Cir Palmdale, CA | 3.0 | 2.0 | 1371 | $3,000 | $2.19 | 23d | 1 | 1.30mi |
| 37835 58th St E Palmdale, CA | 3.0 | 2.0 | 1232 | $2,800 | $2.27 | 0d | 1 | 1.36mi |
| 5720 Opal Ave Palmdale, CA | 4.0 | 3.0 | 1996 | $3,500 | $1.75 | 0d | 1 | 1.36mi |
| 36453 Clearwood Ct Palmdale, CA | 3.0 | 2.5 | 1651 | $2,850 | $1.73 | 0d | 1 | 1.38mi |
| 6012 Sandpiper Pl Palmdale, CA | 4.0 | 2.0 | 1645 | $2,798 | $1.70 | 0d | 1 | 1.41mi |
Listing history 29 events
-
2026-06-21days on market $139,000 Active 87 DOM
-
2026-06-18days on market $139,000 Active 84 DOM
-
2026-06-17remarks 591-char remark
-
2026-06-17pricedays on market $139,000 Active 83 DOM
-
2026-06-16days on market $149,999 Active 82 DOM
-
2026-06-15days on market $149,999 Active 81 DOM
-
2026-06-13days on market $149,999 Active 79 DOM
-
2026-06-13days on market $149,999 Active 78 DOM
-
2026-06-09days on market $149,999 Active 75 DOM
-
2026-06-08days on market $149,999 Active 74 DOM
-
2026-06-07days on market $149,999 Active 73 DOM
-
2026-06-04days on market $149,999 Active 70 DOM
-
2026-06-03days on market $149,999 Active 69 DOM
-
2026-06-02days on market $149,999 Active 68 DOM
-
2026-06-01days on market $149,999 Active 67 DOM
-
2026-05-31days on market $149,999 Active 66 DOM
-
2026-03-26$149,999 Active
-
2025-09-28historical
-
2025-07-30price $134,999
-
2025-06-17$139,999 Active
-
2024-09-04price $145,000
-
2024-08-20price $147,000
-
2019-11-27historical
-
2019-11-27status Pending
-
2019-11-01$70,000 Active
-
2018-12-27historical
-
2018-10-12soldstatus $57,000 Closed
-
2018-08-27status Pending
-
2018-04-24$60,000 Active
ⓘ Source: listings_history table (triggers on properties + properties_extension) + one-shot
backfill from property_details.listing_events for pre-trigger history.
Climate risk First Street
- Flood 1/10 Low FEMA zone X (shaded) · 0% chance over 30 yrs
- Wildfire 7/10 Severe
- Heat 6/10 Major 4 d/yr ≥99°F today · 9 d/yr by 30 yrs out
- Wind 1/10 Low
- Air quality 10/10 Extreme 27 unhealthy d/yr today · 34 by 30 yrs out
Nearby sold comps map
Loading sold comps map…
Walkable amenities ~0.75 mi
Loading nearby amenities…
Taxation est. · year 1
- Rental income
- $38,227
- − Mortgage interest
- −$7,786
- − Property taxes
- −$2,085
- − Insurance
- −$695
- − Repairs & maintenance
- −$3,058
- − Management
- −$3,058
- − Depreciation
- −$4,044
- Taxable income
- $17,501
- Est. tax owed @ 24.0%
- −$4,200
- After-tax cash flow
- $14,472/yr
For passive investors: Depreciation is non-cash, so a rental often shows a tax loss while cash-flowing — sheltering income. Rental losses are passive: they offset passive income freely, and up to $25,000/yr can offset ordinary (W-2) income if you actively participate and your MAGI is under $100k (phasing out to $0 by $150k); unused losses carry forward. On sale, claimed depreciation is recaptured at up to 25%, and gains may owe capital-gains tax (a 1031 exchange can defer both). Figures are a year-1 estimate at your 24.0% rate — not tax advice; consult a CPA.
Schools (NCES district)
- District
- Palmdale Elementary
- NCES district ID
- 0629580
- Math proficiency
- 20% ▲ 1.00%
- Reading proficiency
- 31% ▲ 1.00%
- Median HH income
- $48,652
- Composite
- 25.34/100
- National rank
- #12888
- State rank
- #1147 of 1400 in CA
Livability — Palmdale
- Score
- 55/100
- State rank
- #861
- US rank
- #23501
Category grades
Schools grade is shown separately in the Schools card above.
Census & demographics
- Census place
- Palmdale, CA
- County
- Los Angeles County · 9,444,647 people
- City population
- 177,644
- Metro
- Los Angeles-Long Beach-Anaheim, CA
- Population (ZIP)
- 42,639
- Household income
- $85,954
- Rent vs Own
- Severe rent burden
- 747.0
Population outlook (Los Angeles County) Hauer SSP2
- Today (2025)
- 10,940,515 people
- By 2030
- 11,256,481 · +2.9%
- By 2040
- 11,729,929 · +7.2%
- By 2050
- 11,948,407 · +9.2%
- By 2075
- 11,818,114 · +8.0%
- By 2100
- 10,842,928 · -0.9%
Race, ethnicity, and origin ACS 2023
- Neighborhood character
- Predominantly Hispanic (72%)
- Race & ethnicity
- Hispanic / Latino 72% Two or more races 21% Black 13% White 11% Asian 2% Native American 1%
- Hispanic origin (detail)
- Mexican 55%
- Common ancestry
- Italian 1%
- Foreign-born
- 27% · Canada, Dominican Republic
- Languages at home
- 42% English-only · Spanish 55% Tagalog/Filipino 1%
Political lean MEDSL · Los Angeles
- 2024 margin
- Solid D (+32.9) · D 64.8% · R 31.9% · Other 3.3%
- 2008→2024 swing
- -7.4pp toward R · 2008: 40.4pp · 2024: 32.9pp
- All cycles
- 2024: D+32.9 2020: D+44.2 2016: D+48.0 2012: D+40.0 2008: D+40.4
Not yet ingested
- Civics
- —
Market trends
- HPI YoY
- ▼ -27.00%
- Current HPI
- 394.1607
- Rent YoY
- —
- Metro
- Los Angeles-Long Beach-Anaheim, CA
- State GDP YoY
- ▲ 3.21%
- F500 in state
- 116
Industry mix (Fortune 500 HQ in CA)
| Industry | F500 HQs | Revenue |
|---|---|---|
| Technology | 27 | $1,492B |
|
||
| Financial Services | 3 | $174B |
|
||
| Retail | 3 | $44B |
|
||
| Insurance | 3 | $26B |
|
||
| Media / Entertainment | 2 | $115B |
|
||
| Pharmaceuticals / Biotech | 2 | $62B |
|
||
Price history
+150.0% since first listed13 events — show timeline
- 2026-03-26 Listed $149,999 AVMLS
- 2025-09-28 Listing Removed — CRMLS
- 2025-07-30 Price Changed $134,999 AVMLS
- 2025-06-17 Listed $139,999 CRMLS
- 2024-09-04 Price Changed $145,000 AVMLS
- 2024-08-20 Price Changed $147,000 AVMLS
- 2019-11-27 Listing Removed — AVMLS
- 2019-11-27 Pending — AVMLS
- 2019-11-01 Listed $70,000 AVMLS
- 2018-12-27 Listing Removed — AVMLS
- 2018-10-12 Sold (MLS) $57,000 AVMLS
- 2018-08-27 Pending — AVMLS
- 2018-04-24 Listed $60,000 AVMLS
Cash-flow waterfall
monthlySold comps — $/sqft
last 12 mo · ≤1 miLoading sold comps…