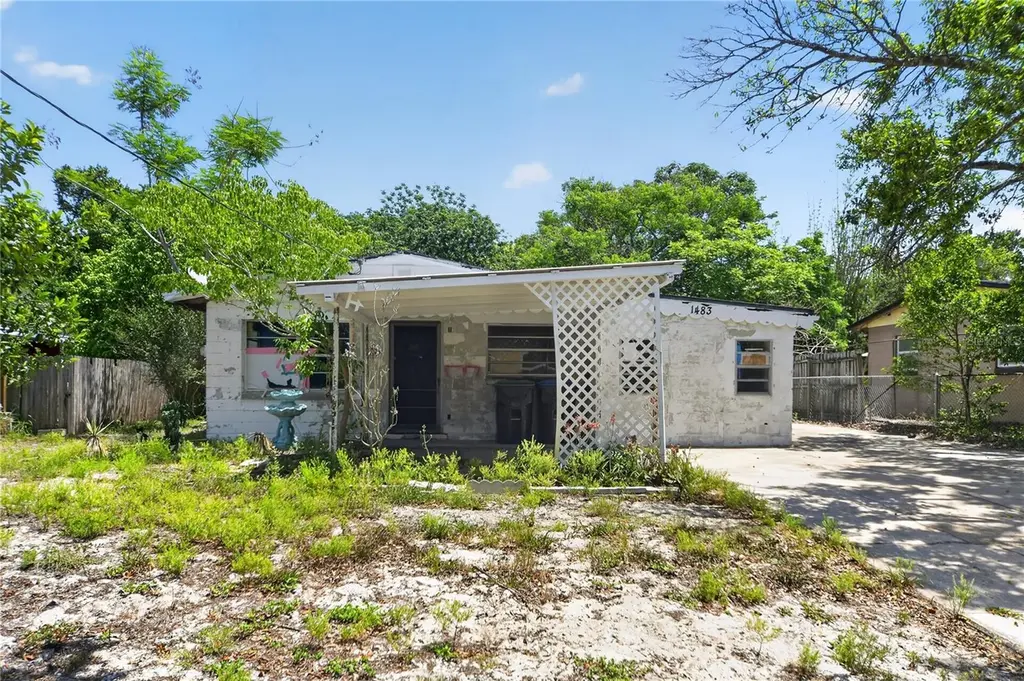
1483 Matador Dr · Ocoee, FL
Flood risk 1/10 · Minimal
- FEMA flood zone
- X (unshaded)
- Chance of flooding over 30 yrs
- 0.0%
- Est. flood insurance / yr
- $507 – $1,088
Fire risk 1/10 · Minimal
- Est. fire insurance / yr
- $947 – $1,759
Heat risk 8/10 · Major
- Hot days now (above 108°F)
- 7 days/yr
- Hot days in 30 yrs
- 23 days/yr
Wind risk 9/10 · Severe
- Chance of severe wind over 30 yrs
- 99.0%
Air-quality risk 1/10 · Minimal
- Unhealthy air days now
- 0 days/yr
- Unhealthy air days in 30 yrs
- 0 days/yr
Risk factors via First Street. Map © Google.
Why this score? — see what drove the C- grade
The composite is a weighted blend of 9 inputs, each scored 0–100. Each bar is that input's sub-score; the figure is the points it added to the 100-point composite (weight × sub-score).
- Cash flow +18.1/30.0
- ARV discount +7.5/15.0
- Appreciation +5.8/10.0
- DSCR +5.7/10.0
- 1% rule +4.9/10.0
- Schools +4.1/10.0
- Livability +3.3/5.0
- Rent growth +2.5/5.0
- Condition / age +2.5/5.0
$219,000
🖨 Deal sheet 📄 Offer letter ✓ Due diligence
Listing remarks
Under contract-accepting backup offers. Needs TLC. House was cleaned out. Property is being sold AS-IS. Age of big ticket items unknown. * * * This is a limited-service listing - Please see realtor remarks for showing instructions. * * *
Key facts
- 7,560 sq ft lot
- Built 1960
- Listed 27 days
Property features AI
Finance
- Other: Lot size about 0.17 acre (approx. 0.07 ha); Living area approximately 1,327 square feet; Building area approximately 1,535 square feet; Total acreage: 0 to less than 1/4
- Financial info: No lease restrictions noted; Property zoned R-1
- HOA & community: No additional association indicated
Exterior
- Utilities: Public water; Public sewer; Other utilities
- Home design: Single Family Residence; Residential property; Fixer condition; One story; Faces west; Entry level: One
- Construction: Other construction materials; Other roof; Other foundation details; Built on slab or unspecified foundation
- Exterior features: Other exterior features; Asphalt road surface
Interior
- Bedrooms: 3 bedrooms
- Flooring: Other flooring
- Bathrooms: 1 full bathroom
- Heating & cooling: Other heating; Other cooling
- Interior features: Other interior features
- Laundry & utility: Other laundry features
Neighborhood map
What this means for you Summary
Snapshot
- This is a 3-bed/1.0-bath single-family listed at $219k.
Deal economics
- At list price, monthly cash flow is $193 ($2k/yr) — positive.
- The deal already cash-flows at list — no discount required.
- To meet the 1% rule (rent ≥ 1% of price), the offer needs to be $216k (1.2% below list).
- Recommended offer: $216k (1.5% below list) — sets the bar for market timing.
- Cap rate 7.3% vs local median 3.6% in Ocoee — top-decile yield for the area; either an underpriced asset or a hidden risk that comps aren't pricing in. Stress-test before assuming the spread holds.
Location & tenants
- Location reads 66/100 on livability (#602 in FL) — a middle-class / working-renter tenant base. Strengths: housing A+, crime A-, employment A-; Watch: amenities F, commute F, health & safety F.
- Orange (suburban): math 46% / reading 51% proficiency, ranked #43 of 73 in FL (top 59%) — families likely to look elsewhere, expect single-tenant / working-renter base with shorter leases.
- Market conditions: 28 active listings in the ZIP; 26 comparable units currently listed for rent nearby; rentals leasing fast (median 11d on market — plan ~1-2 weeks tenant-placement turnaround); 8,053 units permitted in Orange County in 2024 (3,133 in 5+ unit buildings).
Forward outlook
- In year one you build about $5k of equity ($2k loan paydown + $4k appreciation (1.6% local appreciation)).
- Orange County population projected at +52% by 2050 — long-run rental-demand tailwind backs the buy-and-hold thesis.
- At projected returns (1.6% appreciation + 3.0% rent growth), your $61k cash investment doubles in ~7 years — after that, you're playing with house money.
- By year 7, paydown + projected appreciation supports a ~$33k cash-out refi (75% LTV) — recoverable capital for the next deal without selling this one.
Negotiation context
- It's been on market 27 days — a 2% lower offer ($216k) is reasonable based on typical stale-listing flexibility.
Risks & watch-outs
- Climate carrying-cost: severe wind risk, 99% chance of damaging wind over 30y; extreme-heat days projected 7→23/yr by 2055 (HVAC capex compounding) — expect insurance premiums to compound above CPI over the hold.
Questions for the listing agent
- Built in 1960 — when were the roof, HVAC, electrical panel, plumbing, and water heater last replaced?
- Is there a deadline driving the sale (1031 exchange, divorce, estate, relocation)? That informs how much negotiation room exists.
- What's the average days-on-market for RENTAL listings here right now (not sales)? A rising rental-DOM trend means longer vacancies and softer asking-rent achievability than the comps imply.
- What's the recent tenant-quality profile in this submarket — average credit score on applications, eviction rate, late-payment / NSF rate, and stable-employment percentage? A property-management company in the area should have these aggregated.
- How much new for-sale + rental construction is in the pipeline within 1–3 miles? Heavy new supply typically softens prices + rents 12–24 months out; constrained supply supports both.
Investment metrics
- 1% rule
- 0.99% ✗
- Cap rate
- 7.35%
- Cash-on-cash
- 3.77%
- DSCR
- 1.17
- GRM
- 8.4
CMA / ARV
- ARV (on-the-fly)
- $473,739
- Comps found
- 1
Show comp detail 1 sale within ~0.75 mi
| Address | Dist | Beds/Ba | Sqft | Sold | Price | $/sf | Match |
|---|---|---|---|---|---|---|---|
| 3558 Crystal St | 0.23mi | 2/2.0 (-1) | 1,150 (-13%) | 18mo | $410,000 | $357 | 44 |
Match score weights: distance 35% · size 25% · config 20% · recency 20%. Top-matched comps best support the ARV.
Projected returns pro-forma
1.64% appreciation · 3.0% rent growth · sell at horizon
- IRR
- 7.2%
- Equity multiple
- 1.38×
- Total profit
- $23,329
- Equity at exit
- $82,122
- IRR
- 10.8%
- Equity multiple
- 2.40×
- Total profit
- $86,144
- Equity at exit
- $115,069
Cash invested: $61,320 (down + closing). Projections, not guarantees.
Landlord ↔ Tenant lean methodology
- Overall (STATE)
- 87 Strongly Landlord-Friendly
- State Florida
- 87 Strongly Landlord-Friendly · R+3
- County
- — inherits STATE
- City
- — inherits STATE
ZIP-level market 34734
- Home prices YoY
- 0.6%
- Active inventory
- 28
- Price-to-rent
- 8.4×
Monthly cashflow live
- Estimated rent
- $2,163 high interval (Pro) →
- Mortgage (P&I)
- −$1,148
- Tax from tax record
- −$276 /mo · $3,315/yr
- Insurance
- −$91
- HOA
- −$0
- Vacancy / Maint / Mgmt
- −$454
- Net cashflow
- $193
Break-even live
UW: 25.0% down · 7.5% · 30yr · 1.5% tax · 5.0% vac · 8.0% maint · 8.0% mgmt
Financing live
Cash to close
- Down payment
- $54,750
- Closing costs
- $6,570
- Reserves months
- —
- Total cash needed
- —
Loan-product check · same deal, 3 products live
Conventional
25% down · 7.5% · 30yr
- Down + closing
- —
- Monthly P&I
- —
- Monthly cashflow
- —
- DSCR
- —
- Eligible?
- —
Personal DTI + credit; lowest rate.
DSCR
20% down · 8.5% · 30yr
- Down + closing
- —
- Monthly P&I
- —
- Monthly cashflow
- —
- DSCR
- —
- Eligible?
- —
No personal income docs; deal must DSCR.
Hard money
10% down · 12.0% · 12mo
- Down + closing
- —
- Monthly P&I
- —
- Monthly cashflow
- —
- DSCR
- —
- Eligible?
- —
Short-term bridge; refi at stabilization.
Rent comps 26 comps
| Address | Beds | Baths | Sqft | Rent | $/sqft | DOM | Units | Dist |
|---|---|---|---|---|---|---|---|---|
| 3100 Old Winter Garden Rd Ocoee, FL | 1.0–3.0 | 1.0–2.0 | 885 | $2,044 | $2.31 | 2d | 13 | 0.41mi |
| 9426 Lake Lotta Cir Gotha, FL | 2.0 | 2.5 | 1112 | $1,975 | $1.78 | 17d | 1 | 0.67mi |
| 9304 Daney St Gotha, FL | 3.0 | 2.0 | 1147 | $2,025 | $1.77 | 4d | 1 | 0.74mi |
| 608 Bridge Creek Blvd Ocoee, FL | 4.0 | 2.0 | 1659 | $2,840 | $1.71 | 23d | 1 | 0.83mi |
| 2760 Southside Dr Ocoee, FL | 3.0 | 1.0–3.5 | 1252 | $3,450 | $2.75 | 2d | 41 | 0.86mi |
| 101 Allure Pt Ocoee, FL | 1.0–3.0 | 1.0–2.0 | 1080 | $2,541 | $2.35 | 2d | 28 | 0.88mi |
| 2168 Leather Fern Dr Unit 1 Ocoee, FL | 3.0 | 2.5 | 1792 | $2,599 | $1.45 | 10d | 1 | 0.89mi |
| 906 Oasis Palm Cir Ocoee, FL | 1.0–2.0 | 1.0–2.0 | 1061 | $2,185 | $2.06 | 1d | 11 | 0.97mi |
| 1024 Vizcaya Lake Rd Ocoee, FL | 1.0–2.0 | 1.0–2.0 | 776 | $1,803 | $2.32 | 2d | 27 | 0.98mi |
| 1101 Vintage Village Ln #110 Ocoee, FL | 2.0 | 2.0 | 1127 | $1,800 | $1.60 | 23d | 1 | 1.03mi |
| 1101 Vintage Village Ln Ocoee, FL | 2.0 | 2.0 | 1100 | $1,725 | $1.57 | 3d | 2 | 1.03mi |
| 1601 Maguire Rd Ocoee, FL | 3.0 | 1.0–2.0 | 1098 | $3,217 | $2.93 | 23d | 33 | 1.07mi |
| 1995 Erving Cir #307 Ocoee, FL | 2.0 | 2.0 | 1109 | $1,800 | $1.62 | 11d | 1 | 1.12mi |
| 2025 Erving Cir #207 Ocoee, FL | 2.0 | 2.0 | 1031 | $1,800 | $1.75 | 21d | 1 | 1.13mi |
| 2415 Treasure Landing Pkwy Ocoee, FL | 1.0–3.0 | 1.0–2.0 | 1032 | $2,047 | $1.98 | 2d | 40 | 1.13mi |
| 2025 Erving Cir Ocoee, FL | 2.0 | 1.0–2.0 | 976 | $1,725 | $1.77 | 2d | 2 | 1.13mi |
| 2000 Erving Cir #208 Ocoee, FL | 3.0 | 2.0 | 1292 | $1,950 | $1.51 | 7d | 1 | 1.15mi |
| 2000 Erving Cir Ocoee, FL | 2.0–3.0 | 2.0 | 1161 | $1,950 | $1.68 | 23d | 2 | 1.15mi |
| 816 Sleepy Harbour Dr Unit 818 Ocoee, FL | 2.0 | 2.0 | 1195 | $1,850 | $1.55 | 17d | 1 | 1.19mi |
| 611 Olympic Dr Unit B Ocoee, FL | 2.0 | 2.0 | 1493 | $1,770 | $1.19 | 4d | 1 | 1.21mi |
| 204 Hawthorne Groves Blvd Orlando, FL | 1.0–3.0 | 1.0–2.0 | 1126 | $2,001 | $1.78 | 2d | 32 | 1.24mi |
| 2299 Aloha Bay Ct Ocoee, FL | 3.0 | 2.5 | 1630 | $2,200 | $1.35 | 16d | 1 | 1.25mi |
| 763 Olympic Cir Ocoee, FL | 3.0 | 2.0 | 1401 | $2,200 | $1.57 | 23d | 1 | 1.30mi |
| 2310 Aloha Bay Ct Ocoee, FL | 3.0 | 2.5 | 1562 | $1,995 | $1.28 | 10d | 1 | 1.30mi |
| 2310 Aloha Bay Ct Ocoee, FL | 3.0 | 2.5 | 1562 | $1,995 | $1.28 | 12d | 1 | 1.30mi |
| 772 Olympic Cir Unit H2 Ocoee, FL | 3.0 | 2.0 | 1401 | $1,995 | $1.42 | 12d | 1 | 1.33mi |
Listing history 3 events
-
2026-05-20status Pending
-
2026-05-04price $219,000
-
2026-04-25$239,000 Active
ⓘ Source: listings_history table (triggers on properties + properties_extension) + one-shot
backfill from property_details.listing_events for pre-trigger history.
Tax reassessment forecast FL · Resets to sale price
- Current annual tax
- $3,315 · $276/mo
- Projected year-2 tax
- $3,315 · $276/mo
- Expected delta
- $0/yr ($0/mo · 0.0%)
ⓘ Screening estimate from a state-policy table — verify with the county assessor before closing.
Climate risk First Street
- Flood 1/10 Low FEMA zone X (unshaded) · 0% chance over 30 yrs
- Wildfire 1/10 Low
- Heat 8/10 Severe 7 d/yr ≥108°F today · 23 d/yr by 30 yrs out
- Wind 9/10 Extreme 99% chance of damaging wind over 30 yrs
- Air quality 1/10 Low 0 unhealthy d/yr today · 0 by 30 yrs out
Nearby sold comps map
Loading sold comps map…
Walkable amenities ~0.75 mi
Loading nearby amenities…
Taxation est. · year 1
- Rental income
- $25,956
- − Mortgage interest
- −$12,267
- − Property taxes
- −$3,315
- − Insurance
- −$1,095
- − Repairs & maintenance
- −$2,076
- − Management
- −$2,076
- − Depreciation
- −$6,371
- Taxable loss
- −$1,245
- Est. tax savings @ 24.0%
- +$299
- After-tax cash flow
- $2,613/yr
For passive investors: Depreciation is non-cash, so a rental often shows a tax loss while cash-flowing — sheltering income. Rental losses are passive: they offset passive income freely, and up to $25,000/yr can offset ordinary (W-2) income if you actively participate and your MAGI is under $100k (phasing out to $0 by $150k); unused losses carry forward. On sale, claimed depreciation is recaptured at up to 25%, and gains may owe capital-gains tax (a 1031 exchange can defer both). Figures are a year-1 estimate at your 24.0% rate — not tax advice; consult a CPA.
Schools (NCES district)
- District
- Orange
- NCES district ID
- 1201440
- Math proficiency
- 46% ▼ -9.00%
- Reading proficiency
- 51% ▼ -2.00%
- Median HH income
- $49,350
- Composite
- 41.47/100
- National rank
- #3461
- State rank
- #43 of 73 in FL
Livability — Ocoee
- Score
- 66/100
- State rank
- #602
- US rank
- #11554
Category grades
Schools grade is shown separately in the Schools card above.
Census & demographics
- City population
- 47,327
- Population (ZIP)
- 4,031
Population outlook (Orange County) Hauer SSP2
- Today (2025)
- 1,618,226 people
- By 2030
- 1,787,404 · +10.5%
- By 2040
- 2,125,621 · +31.4%
- By 2050
- 2,454,016 · +51.6%
- By 2075
- 3,173,711 · +96.1%
- By 2100
- 3,607,781 · +122.9%
Race, ethnicity, and origin ACS 2023
- Neighborhood character
- Highly diverse neighborhood (Simpson 0.70)
- Race & ethnicity
- White 45% Hispanic / Latino 28% Two or more races 26% Asian 9% Black 8%
- Hispanic origin (detail)
- Puerto Rican 14% Cuban 4% Dominican 3%
- Common ancestry
- Estonian 5% Slovak 2% Romanian 1%
- Foreign-born
- 24% · Canada, South Korea, Jamaica
- Languages at home
- 56% English-only · Spanish 26% Other Indo-European 8% Korean 5%
Political lean MEDSL · Orange
- 2024 margin
- D (+13.6) · D 56.1% · R 42.5% · Other 1.3%
- 2008→2024 swing
- -5.0pp toward R · 2008: 18.6pp · 2024: 13.6pp
- All cycles
- 2024: D+13.6 2020: D+23.1 2016: D+24.6 2012: D+18.2 2008: D+18.6
Not yet ingested
- Civics
- —
Market trends
- HPI YoY
- ▲ 1.64%
- Current HPI
- 294.1533
- Rent YoY
- —
- Metro
- —
- State GDP YoY
- ▲ 3.28%
- F500 in state
- 36
Industry mix (Fortune 500 HQ in FL)
| Industry | F500 HQs | Revenue |
|---|---|---|
| Industrial Technology | 2 | $29B |
|
||
| Insurance | 2 | $17B |
|
||
| Retail | 1 | $60B |
|
||
| Technology Distribution | 1 | $58B |
|
||
| Homebuilding | 1 | $35B |
|
||
| Technology Manufacturing | 1 | $35B |
|
||
Price history
-8.4% since first listed3 events — show timeline
- 2026-05-20 Pending — Stellar MLS as Distributed by MLS Grid
- 2026-05-04 Price Changed $219,000 Stellar MLS as Distributed by MLS Grid
- 2026-04-25 Listed $239,000 Stellar MLS as Distributed by MLS Grid
Property tax history
+11.4%/yrLatest (2025): $3,315 · +9.3% YoY. Source: county tax records.
Cash-flow waterfall
monthlySold comps — $/sqft
last 12 mo · ≤1 miLoading sold comps…