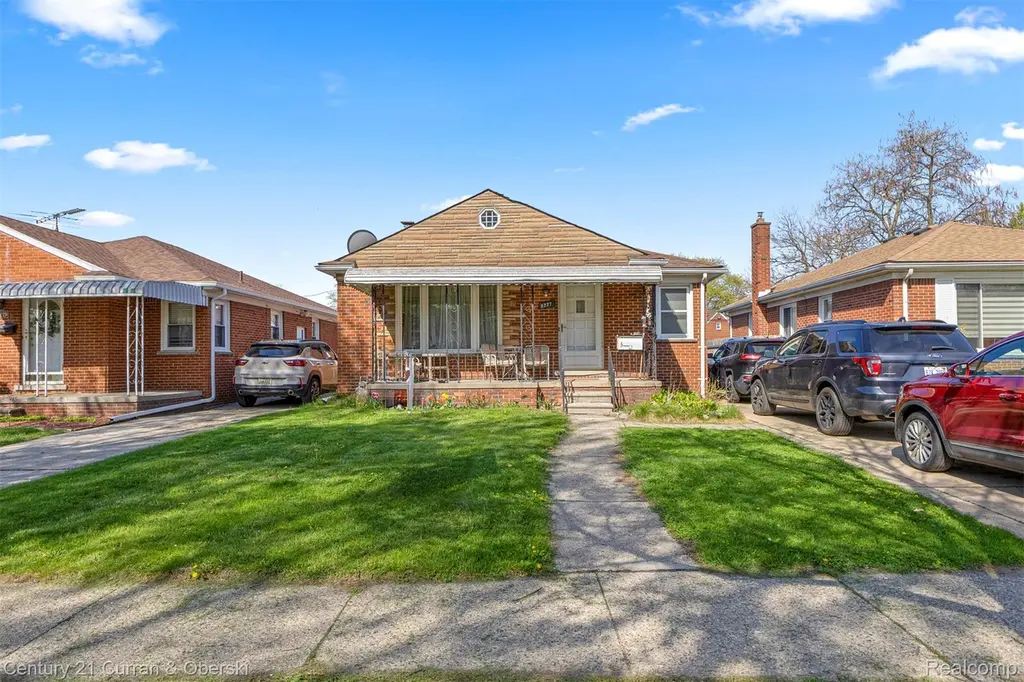
8227 Riverview St · Dearborn Heights, MI
Flood risk No data
- FEMA flood zone
- —
- Chance of flooding over 30 yrs
- —
- Est. flood insurance / yr
- —
Fire risk No data
- Est. fire insurance / yr
- —
Heat risk No data
- Hot days now (above threshold)
- —
- Hot days in 30 yrs
- —
Wind risk No data
- Chance of severe wind over 30 yrs
- —
Air-quality risk No data
- Unhealthy air days now
- —
- Unhealthy air days in 30 yrs
- —
Risk factors via First Street. Map © Google.
Why this score? — see what drove the F grade
The composite is a weighted blend of 9 inputs, each scored 0–100. Each bar is that input's sub-score; the figure is the points it added to the 100-point composite (weight × sub-score).
- Cash flow +10.4/30.0
- ARV discount +5.9/15.0
- Livability +4.0/5.0
- DSCR +3.0/10.0
- Schools +2.8/10.0
- Rent growth +2.6/5.0
- Condition / age +2.5/5.0
- 1% rule +2.1/10.0
- Appreciation +0.0/10.0
$239,999
🖨 Deal sheet 📄 Offer letter ✓ Due diligence
Listing remarks MLS
5 BEDROOMS (2 IN THE BSASEMENT) WITH 2 FULL BATHROOMS, AND FINISHED BASEMENT IN THE HEART OF DEARBORN HEIGHTS. ONE BATHROOM IN EACH LEVEL AND UPDATED. NEW FLOORING IN THE KITCHEN AREA. DINNING ROOM OPENS TO THE KITCHEN. UPDATES INCLUDING WITHIN 7 YEARS ROOF, FURNACE, AC UNIT AND HOT WATER TANK. WHOLE HOUSE JUST FRESHLY PAINTED WITH BRAND NEW DOORS' HARDWARE. ALL APPLIANCES STAY. OCCUPANCY IS NEGOTIABLE. ALL DATA AND MEASURMENTS ARE APPROXIMATE NOT GURANTEED. B-A-T-V-A-I
Key facts
- New flooring
- Finished basement
- Updated bathrooms
Tags
Neighborhood map
What this means for you Summary
Snapshot
- This is a 3-bed/1.5-bath single-family listed at $240k.
Deal economics
- At list price, monthly cash flow is $-128 ($-2k/yr) — negative.
- To cash-flow at today's rent, offer at most $217k (9.5% below list).
- To meet the 1% rule (rent ≥ 1% of price), the offer needs to be $171k (28.8% below list).
- Recommended offer: $171k (28.8% below list) — sets the bar for 1% rule.
Location & tenants
- Location reads 79/100 on livability (#82 in MI, #1,885 nationally) — a middle-class / working-renter tenant base. Strengths: commute A+, cost of living A+, housing A+; Watch: schools C-, crime D+, employment D+.
- Dearborn City School District (urban): math 26% / reading 39% proficiency, ranked #325 of 540 in MI (top 60%) — families likely to look elsewhere, expect single-tenant / working-renter base with shorter leases; 66% free/reduced lunch — lower-income household profile, screen leases tightly.
- Market conditions: Rents flat; 143 active listings in the ZIP; 15 comparable units currently listed for rent nearby; rentals at typical pace (median 18d on market — plan ~3-4 weeks tenant-placement turnaround); 40% of comp listings sitting > 30 days — soft ceiling on asking rent; 2,639 units permitted in Wayne County in 2024 (1,216 in 5+ unit buildings).
- This rent runs 34% of the median local income ($61k/yr) — at the standard rent-burdened threshold; future hikes will face affordability resistance.
Forward outlook
- Local home prices are declining (-3.0%/yr); year-one equity from $2k of loan paydown is wiped out by about $7k of value loss. Plan a longer hold.
- Wayne County population projected at -17% by 2050 — secular population decline; favor cash flow + early exit over multi-decade hold.
Negotiation context
- Only 6 days on market — expect competitive offers; lowballing is unlikely to land.
- 5 sale attempts since 14y ago; this cycle's ask is 11900% above the opening price — seller raised mid-cycle; expect resistance to lowballs.
- Current owner paid $46k; list at $240k implies a 416% gain — meaningful room to come down on a strong offer.
Risks & watch-outs
- Watch-outs: built in 1952 — expect roof / HVAC / electrical / plumbing capex.
Questions for the listing agent
- What do current leases actually rent for vs. the listed asking? Can we see a recent rent roll and the last 12 months of T-12 income?
- Built in 1952 — when were the roof, HVAC, electrical panel, plumbing, and water heater last replaced?
- Is there a deadline driving the sale (1031 exchange, divorce, estate, relocation)? That informs how much negotiation room exists.
- Crime grade is D in this area — have there been break-ins, vandalism, or insurance claims at this property in the last 3 years? What carrier currently insures it and at what premium?
- The area grade is low — what's the realistic commute time and amenity access for the typical tenant pool here? Any planned neighborhood developments (good or bad) we should know about?
- What's the average days-on-market for RENTAL listings here right now (not sales)? A rising rental-DOM trend means longer vacancies and softer asking-rent achievability than the comps imply.
- What's the recent tenant-quality profile in this submarket — average credit score on applications, eviction rate, late-payment / NSF rate, and stable-employment percentage? A property-management company in the area should have these aggregated.
- How much new for-sale + rental construction is in the pipeline within 1–3 miles? Heavy new supply typically softens prices + rents 12–24 months out; constrained supply supports both.
Investment metrics
- 1% rule
- 0.71% ✗
- Cap rate
- 5.65%
- Cash-on-cash
- -2.29%
- DSCR
- 0.90
- GRM
- 11.7
CMA / ARV
- ARV (median comp)
- $231,839
- List price
- $239,999
- Delta
- 7.83%
- Verdict
- FAIR
- Comps
- 20 within 1.0 mi
Show comp detail 12 sales within ~0.75 mi
| Address | Dist | Beds/Ba | Sqft | Sold | Price | $/sf | Match |
|---|---|---|---|---|---|---|---|
| 8152 Virgil St | 0.17mi | 3/1.0 | 1,061 (+2%) | 5mo | $156,000 | $147 | 83 |
| 8218 Beaverland St | 0.45mi | 3/1.0 | 1,058 (+1%) | 3mo | $160,000 | $151 | 73 |
| 8841 Virgil | 0.40mi | 3/1.0 | 1,013 (-3%) | 3mo | $185,000 | $183 | 72 |
| 8109 Beaverland St | 0.44mi | 3/1.0 | 1,082 (+4%) | 1mo | $105,000 | $97 | 70 |
| 8915 Wormer Ave | 0.54mi | 3/1.0 | 981 (-6%) | 0mo | $183,500 | $187 | 62 |
| 9025 Appleton | 0.50mi | 3/1.0 | 1,092 (+5%) | 6mo | $205,000 | $188 | 61 |
| 8275 Beaverland St | 0.42mi | 3/2.0 | 1,158 (+11%) | 2mo | $159,900 | $138 | 58 |
| 7420 Fenton St | 0.65mi | 2/1.0 (-1) | 1,080 (+3%) | 2mo | $160,000 | $148 | 55 |
| 7568 Hazelton St | 0.54mi | 3/1.0 | 960 (-8%) | 5mo | $141,000 | $147 | 55 |
| 8074 Nightingale St | 0.75mi | 3/1.0 | 1,020 (-2%) | 6mo | $200,000 | $196 | 55 |
| 7686 W Parkway St | 0.51mi | 3/1.0 | 1,191 (+14%) | 3mo | $115,000 | $97 | 48 |
| 7260 Fenton St | 0.74mi | 3/1.0 | 1,200 (+15%) | 3mo | $241,000 | $201 | 36 |
Match score weights: distance 35% · size 25% · config 20% · recency 20%. Top-matched comps best support the ARV.
Projected returns pro-forma
-3.0% appreciation · 0.41% rent growth · sell at horizon
- IRR
- -22.7%
- Equity multiple
- 0.23×
- Total profit
- $-51,497
- Equity at exit
- $35,785
- IRR
- -24.4%
- Equity multiple
- -0.08×
- Total profit
- $-72,638
- Equity at exit
- $20,751
Cash invested: $67,200 (down + closing). Projections, not guarantees.
Landlord ↔ Tenant lean methodology
- Overall (STATE)
- 62 Landlord-Friendly
- State Michigan
- 62 Landlord-Friendly · EVEN
- County
- — inherits STATE
- City
- — inherits STATE
ZIP-level market 48127
- Rents YoY
- 0.4%
- Active inventory
- 143
- Price-to-rent
- 11.7×
Monthly cashflow live
- Estimated rent
- $1,709 high interval (Pro) →
- Mortgage (P&I)
- −$1,259
- Tax from tax record
- −$120 /mo · $1,444/yr
- Insurance
- −$100
- HOA
- −$0
- Vacancy / Maint / Mgmt
- −$359
- Net cashflow
- $-128
Break-even live
UW: 25.0% down · 7.5% · 30yr · 1.5% tax · 5.0% vac · 8.0% maint · 8.0% mgmt
Financing live
Cash to close
- Down payment
- $60,000
- Closing costs
- $7,200
- Reserves months
- —
- Total cash needed
- —
Loan-product check · same deal, 3 products live
Conventional
25% down · 7.5% · 30yr
- Down + closing
- —
- Monthly P&I
- —
- Monthly cashflow
- —
- DSCR
- —
- Eligible?
- —
Personal DTI + credit; lowest rate.
DSCR
20% down · 8.5% · 30yr
- Down + closing
- —
- Monthly P&I
- —
- Monthly cashflow
- —
- DSCR
- —
- Eligible?
- —
No personal income docs; deal must DSCR.
Hard money
10% down · 12.0% · 12mo
- Down + closing
- —
- Monthly P&I
- —
- Monthly cashflow
- —
- DSCR
- —
- Eligible?
- —
Short-term bridge; refi at stabilization.
Rent comps 15 comps
| Address | Beds | Baths | Sqft | Rent | $/sqft | DOM | Units | Dist |
|---|---|---|---|---|---|---|---|---|
| 8187 Lenore St Dearborn Heights, MI | 2.0 | 1.0 | 768 | $1,550 | $2.02 | 43d | 1 | 0.30mi |
| 8254 W Parkway St Redford, MI | 3.0 | 1.0 | 1220 | $1,350 | $1.11 | 12d | 1 | 0.41mi |
| 7618 Hazelton St Dearborn Heights, MI | 3.0 | 1.0 | 1310 | $1,700 | $1.30 | 17d | 1 | 0.52mi |
| 7462 N Vernon St Dearborn Heights, MI | 4.0 | 1.0 | 1113 | $1,900 | $1.71 | 1d | 1 | 0.58mi |
| 7420 Drexel St Dearborn Heights, MI | 2.0 | 1.0 | 1080 | $1,700 | $1.57 | 17d | 1 | 0.59mi |
| 7420 Drexel St Dearborn Heights, MI | 2.0 | 1.0 | 1080 | $1,600 | $1.48 | 4d | 1 | 0.59mi |
| 7420 Drexel St Dearborn Heights, MI | 2.0 | 1.0 | 1080 | $1,700 | $1.57 | 43d | 1 | 0.59mi |
| 8402 Robindale Ave Dearborn Heights, MI | 3.0 | 1.0 | 1190 | $1,600 | $1.34 | 15d | 1 | 0.66mi |
| 8455 Robindale Ave Dearborn Heights, MI | 3.0 | 1.0 | 1100 | $1,750 | $1.59 | 4d | 1 | 0.71mi |
| 6978 Mayburn St Dearborn Heights, MI | 3.0 | 2.0 | 1250 | $1,800 | $1.44 | 43d | 1 | 0.81mi |
| 22330 W Warren Ave Redford Charter Twp, MI | 2.0 | 1.0 | 750 | $1,200 | $1.60 | 43d | 1 | 1.00mi |
| 7080 Highview St Dearborn Heights, MI | 3.0 | 2.5 | 1105 | $2,000 | $1.81 | 18d | 1 | 1.11mi |
| 7014 Kinmore St Dearborn Heights, MI | 3.0 | 1.0 | 960 | $1,900 | $1.98 | 21d | 1 | 1.22mi |
| 8270 Trinity St Detroit, MI | 3.0 | 1.0 | 806 | $1,528 | $1.90 | 43d | 1 | 1.31mi |
| 9059 Burt Rd Detroit, MI | 3.0 | 1.0 | 980 | $1,400 | $1.43 | 43d | 1 | 1.44mi |
Listing history 25 events
-
2026-06-18days on market $239,999 Active 6 DOM
-
2026-06-17days on market $239,999 Active 5 DOM
-
2026-06-16days on market $239,999 Active 4 DOM
-
2026-06-15days on market $239,999 Active 3 DOM
-
2026-06-13pricedays on market $239,999 Active 1 DOM
-
2026-06-09days on market $249,999 Active 116 DOM
-
2026-06-08days on market $249,999 Active 115 DOM
-
2026-06-07days on market $249,999 Active 114 DOM
-
2026-06-04days on market $249,999 Active 111 DOM
-
2026-06-03days on market $249,999 Active 110 DOM
-
2026-06-02days on market $249,999 Active 109 DOM
-
2026-06-01days on market $249,999 Active 108 DOM
-
2026-05-31days on market $249,999 Active 107 DOM
-
2026-04-21historical $2,000
-
2026-04-14$2,000
-
2026-02-14$249,999 Active 474-char remark
Show marketing remark (474 chars)
5 BEDROOMS (2 IN THE BSASEMENT) WITH 2 FULL BATHROOMS, AND FINISHED BASEMENT IN THE HEART OF DEARBORN HEIGHTS. ONE BATHROOM IN EACH LEVEL AND UPDATED. NEW FLOORING IN THE KITCHEN AREA. DINNING ROOM OPENS TO THE KITCHEN. UPDATES INCLUDING WITHIN 7 YEARS ROOF, FURNACE, AC UNIT AND HOT WATER TANK. WHOLE HOUSE JUST FRESHLY PAINTED WITH BRAND NEW DOORS' HARDWARE. ALL APPLIANCES STAY. OCCUPANCY IS NEGOTIABLE. ALL DATA AND MEASURMENTS ARE APPROXIMATE NOT GURANTEED. B-A-T-V-A-I
-
2026-02-11historical $249,999 474-char remark
Show marketing remark (474 chars)
5 BEDROOMS (2 IN THE BSASEMENT) WITH 2 FULL BATHROOMS, AND FINISHED BASEMENT IN THE HEART OF DEARBORN HEIGHTS. ONE BATHROOM IN EACH LEVEL AND UPDATED. NEW FLOORING IN THE KITCHEN AREA. DINNING ROOM OPENS TO THE KITCHEN. UPDATES INCLUDING WITHIN 7 YEARS ROOF, FURNACE, AC UNIT AND HOT WATER TANK. WHOLE HOUSE JUST FRESHLY PAINTED WITH BRAND NEW DOORS' HARDWARE. ALL APPLIANCES STAY. OCCUPANCY IS NEGOTIABLE. ALL DATA AND MEASURMENTS ARE APPROXIMATE NOT GURANTEED. B-A-T-V-A-I
-
2013-01-25soldstatus $46,500
-
2012-12-31soldstatus $46,500
-
2012-12-31soldstatus $46,500
-
2012-12-14historical
-
2012-12-14historical
-
2012-10-27$45,000
-
2012-10-27$45,000
ⓘ Source: listings_history table (triggers on properties + properties_extension) + one-shot
backfill from property_details.listing_events for pre-trigger history.
Tax reassessment forecast MI · Partial reset (capped growth)
- Current annual tax
- $1,444 · $120/mo
- Projected year-2 tax
- $2,570 · $214/mo
- Expected delta
- +$1,126/yr (+$94/mo · 78.0%)
ⓘ Screening estimate from a state-policy table — verify with the county assessor before closing.
Nearby sold comps map
Loading sold comps map…
Walkable amenities ~0.75 mi
Loading nearby amenities…
Taxation est. · year 1
- Rental income
- $20,513
- − Mortgage interest
- −$13,444
- − Property taxes
- −$1,444
- − Insurance
- −$1,200
- − Repairs & maintenance
- −$1,641
- − Management
- −$1,641
- − Depreciation
- −$6,982
- Taxable loss
- −$5,838
- Est. tax savings @ 24.0%
- +$1,401
- After-tax cash flow
- $-140/yr
For passive investors: Depreciation is non-cash, so a rental often shows a tax loss while cash-flowing — sheltering income. Rental losses are passive: they offset passive income freely, and up to $25,000/yr can offset ordinary (W-2) income if you actively participate and your MAGI is under $100k (phasing out to $0 by $150k); unused losses carry forward. On sale, claimed depreciation is recaptured at up to 25%, and gains may owe capital-gains tax (a 1031 exchange can defer both). Figures are a year-1 estimate at your 24.0% rate — not tax advice; consult a CPA.
Schools (NCES district)
- District
- Dearborn City School District
- NCES district ID
- 2611600
- Math proficiency
- 26% ▼ -14.00%
- Reading proficiency
- 39% ▼ -8.00%
- Median HH income
- $46,884
- Composite
- 27.93/100
- National rank
- #6864
- State rank
- #325 of 540 in MI
Livability — Dearborn Heights
- Score
- 79/100
- State rank
- #82
- US rank
- #1885
Category grades
Schools grade is shown separately in the Schools card above.
Census & demographics
- Census place
- Dearborn Heights, MI
- County
- Wayne County · 1,562,939 people
- City population
- 61,771
- Metro
- Detroit-Warren-Dearborn, MI
- Population (ZIP)
- 39,646
- Household income
- $60,742
- Rent vs Own
- Severe rent burden
- 1196.0
Population outlook (Wayne County) Hauer SSP2
- Today (2025)
- 1,675,273 people
- By 2030
- 1,620,300 · -3.3%
- By 2040
- 1,502,341 · -10.3%
- By 2050
- 1,384,039 · -17.4%
- By 2075
- 1,124,592 · -32.9%
- By 2100
- 881,193 · -47.4%
Race, ethnicity, and origin ACS 2023
- Neighborhood character
- Predominantly White (85%)
- Race & ethnicity
- White 85% Black 8% Two or more races 3% Hispanic / Latino 3% Asian 2%
- Common ancestry
- Arab 8% Romanian 7% Lithuanian 2%
- Foreign-born
- 31% · Canada
- Languages at home
- 46% English-only · Arabic 45% Russian/Polish/Slavic 2% Other Indo-European 2%
Political lean MEDSL · Wayne
- 2024 margin
- Strong D (+29.0) · D 62.7% · R 33.7% · Other 3.6%
- 2008→2024 swing
- -20.5pp toward R · 2008: 49.5pp · 2024: 29.0pp
- All cycles
- 2024: D+29.0 2020: D+38.1 2016: D+37.3 2012: D+46.9 2008: D+49.5
Not yet ingested
- Civics
- —
Market trends
- HPI YoY
- ▼ -319.04%
- Current HPI
- 225.9407
- Rent YoY
- ▲ 0.41%
- Metro
- Detroit-Warren-Dearborn, MI
- State GDP YoY
- ▲ 1.37%
- F500 in state
- 28
Industry mix (Fortune 500 HQ in MI)
| Industry | F500 HQs | Revenue |
|---|---|---|
| Automotive Parts | 3 | $48B |
|
||
| Automotive | 2 | $372B |
|
||
| Chemicals | 1 | $45B |
|
||
| Automotive Retail | 1 | $29B |
|
||
| Healthcare / Medical Devices | 1 | $23B |
|
||
| Automotive Technology | 1 | $20B |
|
||
Price history
-95.6% since first listed12 events — show timeline
- 2026-04-21 Rental Removed $2,000 REALSOURCE
- 2026-04-14 Listed for Rent $2,000 REALSOURCE
- 2026-02-14 Listed $249,999 MiRealSource-MiMLS
- 2026-02-14 Listed $249,999 REALCOMP
- 2026-02-11 Coming Soon $249,999 MiRealSource-MiMLS
- 2013-01-25 Sold (Public Records) $46,500 Public Records
- 2012-12-31 Sold (MLS) $46,500 MiRealSource-MiMLS
- 2012-12-31 Sold (MLS) $46,500 REALCOMP
- 2012-12-14 Listing Removed — MiRealSource-MiMLS
- 2012-12-14 Listing Removed — REALCOMP
- 2012-10-27 Listed $45,000 MiRealSource-MiMLS
- 2012-10-27 Listed $45,000 REALCOMP
Property tax history
-2.1%/yrLatest (2025): $1,444 · -27.5% YoY. Source: county tax records.
Cash-flow waterfall
monthlySold comps — $/sqft
last 12 mo · ≤1 miLoading sold comps…