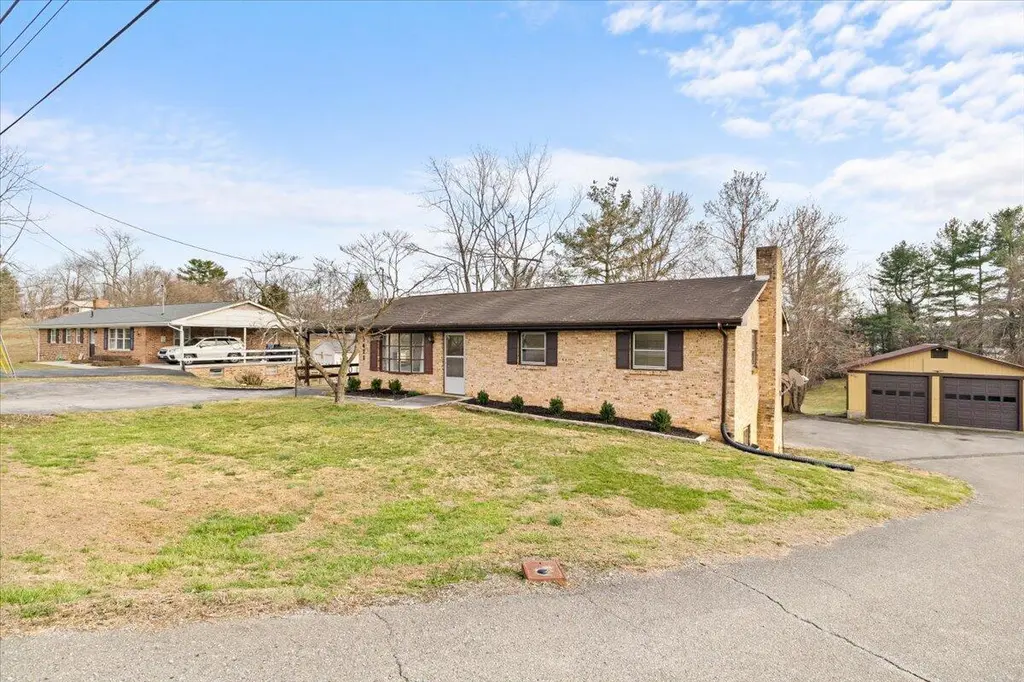
1471 Mud Pike Rd NW · Christiansburg, VA
Flood risk 6/10 · Moderate
- FEMA flood zone
- X (unshaded)
- Chance of flooding over 30 yrs
- 0.74%
- Est. flood insurance / yr
- $473 – $860
Fire risk 3/10 · Minor
- Est. fire insurance / yr
- $666 – $1,236
Heat risk 3/10 · Minor
- Hot days now (above 94°F)
- 7 days/yr
- Hot days in 30 yrs
- 19 days/yr
Wind risk 2/10 · Minimal
- Chance of severe wind over 30 yrs
- 1.0%
Air-quality risk 1/10 · Minimal
- Unhealthy air days now
- 0 days/yr
- Unhealthy air days in 30 yrs
- 0 days/yr
Risk factors via First Street. Map © Google.
Why this score? — see what drove the D- grade
The composite is a weighted blend of 9 inputs, each scored 0–100. Each bar is that input's sub-score; the figure is the points it added to the 100-point composite (weight × sub-score).
- ARV discount +15.0/15.0
- Cash flow +6.6/30.0
- Schools +5.4/10.0
- Livability +4.0/5.0
- Rent growth +2.8/5.0
- Condition / age +2.5/5.0
- DSCR +0.9/10.0
- 1% rule +0.6/10.0
- Appreciation +0.0/10.0
$344,900
🖨 Deal sheet (PDF) 📄 Offer letter ✓ Due diligence
Listing remarks MLS
Quality brick ranch located in one of the most convenient areas of Christiansburg. This 4 bedroom, 2.5 bathroom home offers a great combination of comfort, space, and functionality. A standout feature is the large detached 4 car garage, perfect for car enthusiasts, a workshop, or additional storage. The property also includes a storage shed and two paved driveways, providing plenty of parking for vehicles, trailers, or guests. Enjoy the spacious deck, ideal for relaxing or entertaining outdoors. Located in the Christiansburg school district and just 12 minutes from Virginia Tech, this home offers easy access to shopping, dining, and local amenities while still providing plenty of room to spread out.
Key facts
- Storage shed
- Spacious deck
- Two paved driveways
Tags
Neighborhood map
What this means for you Summary
Snapshot
- This is a 3-bed/2.0-bath single-family listed at $345k.
Deal economics
- At list price, monthly cash flow is $-560 ($-7k/yr) — negative.
- To cash-flow at today's rent, offer at most $246k (28.7% below list).
- To meet the 1% rule (rent ≥ 1% of price), the offer needs to be $194k (43.8% below list).
- Recommended offer: $194k (43.8% below list) — sets the bar for 1% rule.
Location & tenants
- Location reads 81/100 on livability (#53 in VA, #1,452 nationally) — a professional / high-income tenant draw. Strengths: cost of living A+, housing A+, commute A-; Watch: amenities F.
- Montgomery County Public School District (urban): math 57% / reading 70% proficiency, ranked #47 of 131 in VA (top 36%) — acceptable for families but not a draw, mixed tenant base, ~2y average lease.
- Zoned schools: Christiansburg Elementary (math 59% / reading 68%, grade B, #460 of 1,108 statewide, top 42%, 407 students, 41% FRL); Christiansburg Middle (math 38% / reading 63%, grade C, #226 of 342 statewide, top 67%, 752 students, 44% FRL); Christiansburg High (math 79% / reading 77%, grade A-, #80 of 319 statewide, top 25%, 1,116 students, 41% FRL).
- Market conditions: Rents rising (+1.1%/yr); 250 active listings in the ZIP; 1 comparable units currently listed for rent nearby; solid renter incomes; 323 units permitted in Montgomery County in 2024 (0 in 5+ unit buildings).
- This rent runs 30% of the median local income ($77k/yr) — at the standard rent-burdened threshold; future hikes will face affordability resistance.
Forward outlook
- Local home prices are declining (-3.0%/yr); year-one equity from $2k of loan paydown is wiped out by about $10k of value loss. Plan a longer hold.
- Montgomery County population projected at +13% by 2050 — modest demand growth; plan on rents tracking national, not racing it.
Negotiation context
- It's been on market 108 days — a 9% lower offer ($314k) is reasonable based on typical stale-listing flexibility.
Risks & watch-outs
- Climate carrying-cost: major flood risk — expect insurance premiums to compound above CPI over the hold.
Questions for the listing agent
- What do current leases actually rent for vs. the listed asking? Can we see a recent rent roll and the last 12 months of T-12 income?
- It's been on market 108 days. Have you received any prior offers? Is the seller open to a 44% concession, seller financing, or rate buy-down credit?
- Built in 1972 — when were the roof, HVAC, electrical panel, plumbing, and water heater last replaced?
- Why hasn't it sold? Are there any deal-killer items the seller is aware of (foundation, flood, title, zoning, code violations)?
- Is there a deadline driving the sale (1031 exchange, divorce, estate, relocation)? That informs how much negotiation room exists.
- Schools are A-rated — typically a magnet for longer-tenancy family renters. What's the average tenant stay here, and is there a school-zone premium baked into asking?
- The area grade is low — what's the realistic commute time and amenity access for the typical tenant pool here? Any planned neighborhood developments (good or bad) we should know about?
- What's the average days-on-market for RENTAL listings here right now (not sales)? A rising rental-DOM trend means longer vacancies and softer asking-rent achievability than the comps imply.
- What's the recent tenant-quality profile in this submarket — average credit score on applications, eviction rate, late-payment / NSF rate, and stable-employment percentage? A property-management company in the area should have these aggregated.
- How much new for-sale + rental construction is in the pipeline within 1–3 miles? Heavy new supply typically softens prices + rents 12–24 months out; constrained supply supports both.
Investment metrics
- 1% rule
- 0.56% ✗
- Cap rate
- 4.34%
- Cash-on-cash
- -6.96%
- DSCR
- 0.69
- GRM
- 14.8
CMA / ARV
- ARV (median comp)
- $440,504
- List price
- $344,900
- Delta
- -21.70%
- Verdict
- UNDERPRICED
- Comps
- 20 within 1.0 mi
Show comp detail 12 sales within ~0.75 mi
| Address | Dist | Beds/Ba | Sqft | Sold | Price | $/sf | Match |
|---|---|---|---|---|---|---|---|
| 1380 Dow St | 0.63mi | 3/2.5 | 1,812 (+1%) | 1mo | $345,000 | $190 | 66 |
| 1535 Kensington Way | 0.54mi | 4/3.0 (+1) | 1,817 (+1%) | 2mo | $382,450 | $210 | 63 |
| 1381 Dow St | 0.62mi | 3/1.5 | 1,732 (-4%) | 2mo | $330,000 | $191 | 61 |
| 210 Windsong Dr | 0.66mi | 3/2.0 | 1,719 (-4%) | 5mo | $353,000 | $205 | 57 |
| 535 Keystone Dr | 0.54mi | 3/2.5 | 1,760 (-2%) | 15mo | $355,000 | $202 | 57 |
| 940 Holland Loop | 0.39mi | 3/2.5 | 1,650 (-8%) | 17mo | $349,950 | $212 | 51 |
| 990 Holland Loop NW | 0.44mi | 4/2.5 (+1) | 1,933 (+7%) | 11mo | $418,900 | $217 | 51 |
| 960 Holland Loop | 0.41mi | 4/2.5 (+1) | 1,933 (+7%) | 17mo | $386,350 | $200 | 47 |
| 365 S Hill Dr | 0.42mi | 4/2.5 (+1) | 2,016 (+12%) | 8mo | $320,000 | $159 | 47 |
| 105 Ashton Ct | 0.69mi | 4/3.0 (+1) | 1,695 (-6%) | 6mo | $345,000 | $204 | 44 |
| 445 Chelsea Loop | 0.60mi | 4/3.0 (+1) | 1,972 (+10%) | 7mo | $342,500 | $174 | 41 |
| 1747 Mud Pike Rd | 0.63mi | 2/2.0 (-1) | 1,660 (-8%) | 16mo | $254,000 | $153 | 39 |
Match score weights: distance 35% · size 25% · config 20% · recency 20%. Top-matched comps best support the ARV.
Projected returns pro-forma
-3.0% appreciation · 1.05% rent growth · sell at horizon
- IRR
- -30.3%
- Equity multiple
- 0.01×
- Total profit
- $-95,443
- Equity at exit
- $51,426
- IRR
- -41.6%
- Equity multiple
- -0.50×
- Total profit
- $-144,376
- Equity at exit
- $29,821
Cash invested: $96,572 (down + closing). Projections, not guarantees.
Landlord ↔ Tenant lean methodology
- Overall (STATE)
- 55 Moderately Landlord-Leaning
- State Virginia
- 55 Moderately Landlord-Leaning · D+2
- County
- — inherits STATE
- City
- — inherits STATE
ZIP-level market 24073
- Home prices YoY
- -26.2%
- Rents YoY
- 1.1%
- Active inventory
- 250
- Price-to-rent
- 14.8×
Monthly cashflow live
- Estimated rent
- $1,938 medium interval (Pro) →
- Mortgage (P&I)
- −$1,809
- Tax from tax record
- −$139 /mo · $1,667/yr
- Insurance
- −$144
- HOA
- −$0
- Vacancy / Maint / Mgmt
- −$407
- Net cashflow
- $-560
Break-even live
Sensitivity live
| Price | -10% $-365 | -5% $-462 | +0% $-560 | +5% $-658 | +10% $-755 |
|---|---|---|---|---|---|
| Rent | -10% $-713 | -5% $-637 | +0% $-560 | +5% $-484 | +10% $-407 |
| Rate | -1.0pp $-386 | -0.5pp $-472 | base $-560 | +0.5pp $-649 | +1.0pp $-740 |
UW: 25.0% down · 7.5% · 30yr · 1.5% tax · 5.0% vac · 8.0% maint · 8.0% mgmt
Financing live
Cash to close
- Down payment
- $86,225
- Closing costs
- $10,347
- Reserves months
- —
- Total cash needed
- —
Loan-product check · same deal, 3 products live
Conventional
25% down · 7.5% · 30yr
- Down + closing
- —
- Monthly P&I
- —
- Monthly cashflow
- —
- DSCR
- —
- Eligible?
- —
Personal DTI + credit; lowest rate.
DSCR
20% down · 8.5% · 30yr
- Down + closing
- —
- Monthly P&I
- —
- Monthly cashflow
- —
- DSCR
- —
- Eligible?
- —
No personal income docs; deal must DSCR.
Hard money
10% down · 12.0% · 12mo
- Down + closing
- —
- Monthly P&I
- —
- Monthly cashflow
- —
- DSCR
- —
- Eligible?
- —
Short-term bridge; refi at stabilization.
Rent comps 1 comps
| Address | Beds | Baths | Sqft | Rent | $/sqft | DOM | Units | Dist |
|---|---|---|---|---|---|---|---|---|
| 375 Skylar DR Christiansburg, VA | 3.0 | 2.0 | 1647 | $1,900 | $1.15 | 45d | 1 | 1.33mi |
Listing history 20 events
-
2026-06-21days on market $344,900 Active 108 DOM
-
2026-06-19days on market $344,900 Active 106 DOM
-
2026-06-18days on market $344,900 Active 105 DOM
-
2026-06-17days on market $344,900 Active 104 DOM
-
2026-06-16days on market $344,900 Active 103 DOM
-
2026-06-15days on market $344,900 Active 102 DOM
-
2026-06-14days on market $344,900 Active 100 DOM
-
2026-06-13days on market $344,900 Active 99 DOM
-
2026-06-10days on market $344,900 Active 97 DOM
-
2026-06-09days on market $344,900 Active 96 DOM
-
2026-06-08days on market $344,900 Active 95 DOM
-
2026-06-07days on market $344,900 Active 94 DOM
-
2026-06-05days on market $344,900 Active 91 DOM
-
2026-06-03days on market $344,900 Active 90 DOM
-
2026-06-02days on market $344,900 Active 89 DOM
-
2026-06-01days on market $344,900 Active 88 DOM
-
2026-05-31days on market $344,900 Active 87 DOM
-
2026-05-30days on market $344,900 Active 86 DOM
-
2026-04-16price $344,900 708-char remark
Show marketing remark (708 chars)
Quality brick ranch located in one of the most convenient areas of Christiansburg. This 4 bedroom, 2.5 bathroom home offers a great combination of comfort, space, and functionality. A standout feature is the large detached 4 car garage, perfect for car enthusiasts, a workshop, or additional storage. The property also includes a storage shed and two paved driveways, providing plenty of parking for vehicles, trailers, or guests. Enjoy the spacious deck, ideal for relaxing or entertaining outdoors. Located in the Christiansburg school district and just 12 minutes from Virginia Tech, this home offers easy access to shopping, dining, and local amenities while still providing plenty of room to spread out.
-
2026-03-05$349,999 Active 708-char remark
Show marketing remark (708 chars)
Quality brick ranch located in one of the most convenient areas of Christiansburg. This 4 bedroom, 2.5 bathroom home offers a great combination of comfort, space, and functionality. A standout feature is the large detached 4 car garage, perfect for car enthusiasts, a workshop, or additional storage. The property also includes a storage shed and two paved driveways, providing plenty of parking for vehicles, trailers, or guests. Enjoy the spacious deck, ideal for relaxing or entertaining outdoors. Located in the Christiansburg school district and just 12 minutes from Virginia Tech, this home offers easy access to shopping, dining, and local amenities while still providing plenty of room to spread out.
ⓘ Source: listings_history table (triggers on properties + properties_extension) + one-shot
backfill from property_details.listing_events for pre-trigger history.
Tax reassessment forecast VA · Resets to sale price
- Current annual tax
- $1,667 · $139/mo
- Projected year-2 tax
- $2,828 · $236/mo
- Expected delta
- +$1,162/yr (+$97/mo · 69.7%)
ⓘ Screening estimate from a state-policy table — verify with the county assessor before closing.
Climate risk First Street
- Flood 6/10 Major FEMA zone X (unshaded) · 74% chance over 30 yrs
- Wildfire 3/10 Moderate
- Heat 3/10 Moderate 7 d/yr ≥94°F today · 19 d/yr by 30 yrs out
- Wind 2/10 Low 100% chance of damaging wind over 30 yrs
- Air quality 1/10 Low 0 unhealthy d/yr today · 0 by 30 yrs out
Nearby sold comps map
Loading sold comps map…
Walkable amenities ~0.75 mi
Loading nearby amenities…
Taxation est. · year 1
- Rental income
- $23,259
- − Mortgage interest
- −$19,320
- − Property taxes
- −$1,667
- − Insurance
- −$1,724
- − Repairs & maintenance
- −$1,861
- − Management
- −$1,861
- − Depreciation
- −$10,033
- Taxable loss
- −$13,207
- Est. tax savings @ 24.0%
- +$3,170
- After-tax cash flow
- $-3,552/yr
For passive investors: Depreciation is non-cash, so a rental often shows a tax loss while cash-flowing — sheltering income. Rental losses are passive: they offset passive income freely, and up to $25,000/yr can offset ordinary (W-2) income if you actively participate and your MAGI is under $100k (phasing out to $0 by $150k); unused losses carry forward. On sale, claimed depreciation is recaptured at up to 25%, and gains may owe capital-gains tax (a 1031 exchange can defer both). Figures are a year-1 estimate at your 24.0% rate — not tax advice; consult a CPA.
Schools (NCES district)
- District
- Montgomery County Public School District
- NCES district ID
- 5102520
- Math proficiency
- 57% ▼ -29.00%
- Reading proficiency
- 70% ▼ -11.00%
- Median HH income
- $46,618
- Composite
- 53.6/100
- National rank
- #1440
- State rank
- #47 of 131 in VA
Livability — Christiansburg
- Score
- 81/100
- State rank
- #53
- US rank
- #1452
Category grades
Schools grade is shown separately in the Schools card above.
Census & demographics
- County
- Montgomery County · 78,218 people
- City population
- 29,677
- Metro
- Blacksburg-Christiansburg, VA
- Population (ZIP)
- 29,677
- Household income
- $76,800
- Rent vs Own
- Severe rent burden
- 861.0
Population outlook (Montgomery County) Hauer SSP2
- Today (2025)
- 105,748 people
- By 2030
- 110,301 · +4.3%
- By 2040
- 115,652 · +9.4%
- By 2050
- 119,651 · +13.1%
- By 2075
- 126,005 · +19.2%
- By 2100
- 129,771 · +22.7%
Race, ethnicity, and origin ACS 2023
- Neighborhood character
- Predominantly White (86%)
- Race & ethnicity
- White 86% Two or more races 5% Black 4% Hispanic / Latino 4% Asian 3%
- Common ancestry
- Italian 3% Slovak 3% Serbian 2%
- Foreign-born
- 5% · Canada, South Korea, Jamaica
- Languages at home
- 94% English-only · Spanish 3% Other Indo-European 2% Korean 1%
Political lean MEDSL · Montgomery
- 2024 margin
- Toss-up / Even · D 50.9% · R 47.4% · Other 1.7%
- 2008→2024 swing
- -1.4pp toward R · 2008: 4.9pp · 2024: 3.5pp
- All cycles
- 2024: D+3.5 2020: D+5.8 2016: D+1.3 2012: R+0.2 2008: D+4.9
Not yet ingested
- Civics
- —
Market trends
- HPI YoY
- ▼ -94.98%
- Current HPI
- 267.2504
- Rent YoY
- ▲ 1.05%
- Metro
- Blacksburg-Christiansburg, VA
- State GDP YoY
- ▲ 2.40%
- F500 in state
- 50
Industry mix (Fortune 500 HQ in VA)
| Industry | F500 HQs | Revenue |
|---|---|---|
| Aerospace / Defense | 4 | $236B |
|
||
| Technology / Defense | 3 | $32B |
|
||
| Financial Services | 2 | $176B |
|
||
| Utilities | 2 | $27B |
|
||
| Insurance | 2 | $25B |
|
||
| Technology | 2 | $15B |
|
||
Price history
-1.5% since first listed2 events — show timeline
- 2026-04-16 Price Changed $344,900 MLSRV
- 2026-03-05 Listed $349,999 MLSRV
Property tax history
+1.7%/yrLatest (2025): $1,667 · +1.3% YoY. Source: county tax records.
Cash-flow waterfall
monthlySold comps — $/sqft
last 12 mo · ≤1 miLoading sold comps…