 🏷️ Likely Rental
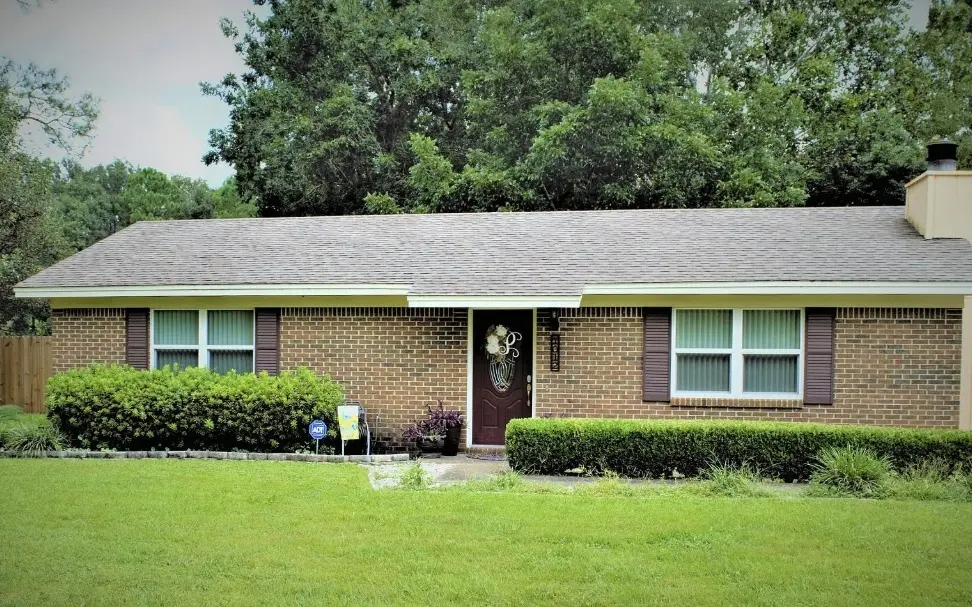
1012 Virginia Ct · Callaway, FL
Flood risk 1/10 · Minimal
- FEMA flood zone
- X (unshaded)
- Chance of flooding over 30 yrs
- 0.0%
- Est. flood insurance / yr
- $507 – $1,088
Fire risk 7/10 · Major
- Est. fire insurance / yr
- $947 – $1,759
Heat risk 10/10 · Severe
- Hot days now (above 105°F)
- 7 days/yr
- Hot days in 30 yrs
- 21 days/yr
Wind risk 9/10 · Severe
- Chance of severe wind over 30 yrs
- 99.0%
Air-quality risk 1/10 · Minimal
- Unhealthy air days now
- 0 days/yr
- Unhealthy air days in 30 yrs
- 0 days/yr
Risk factors via First Street. Map © Google.
Why this score? — see what drove the D+ grade
The composite is a weighted blend of 9 inputs, each scored 0–100. Each bar is that input's sub-score; the figure is the points it added to the 100-point composite (weight × sub-score).
- Cash flow +15.0/30.0
- ARV discount +7.5/15.0
- 1% rule +5.0/10.0
- DSCR +5.0/10.0
- Schools +4.3/10.0
- Livability +3.2/5.0
- Rent growth +2.8/5.0
- Condition / age +2.5/5.0
- Appreciation +0.0/10.0
$5,000
🖨 Deal sheet (PDF) 📄 Offer letter ✓ Due diligence
Listing remarks MLS
Entered for comp purposes
Key facts
- Garage
- Built 1982
- Listed 9 days
Property features AI
Exterior
- Parking: 1-car garage
- Home design: Residential property
- Construction: Lot size approximately 0.29 acres
- Exterior features: Lot zoned R-2
Interior
- Bathrooms: One full bathroom
- Interior features: 1 full bathroom
Neighborhood map
What this means for you Summary
Snapshot
- This is a 2-bed/1.0-bath single-family listed at $5k.
Deal economics
- At list price, monthly cash flow is $1k ($13k/yr) — positive.
- The deal already cash-flows at list — no discount required.
- Meets the 1% rule at list price ($1k rent vs $5k).
- Cap rate 269.9% vs local median 5.1% in Callaway — top-decile yield for the area; either an underpriced asset or a hidden risk that comps aren't pricing in. Stress-test before assuming the spread holds.
Location & tenants
- Location reads 64/100 on livability (#690 in FL) — a middle-class / working-renter tenant base. Strengths: cost of living A+, housing A+; Watch: employment D+, amenities F, commute F.
- Bay (suburban): math 51% / reading 51% proficiency, ranked #29 of 73 in FL (top 40%) — acceptable for families but not a draw, mixed tenant base, ~2y average lease.
- Zoned schools: Callaway Elementary School (math 37% / reading 42%, grade F, #1,513 of 2,144 statewide, top 73%, 511 students, 72% FRL); Rutherford High School (math 24% / reading 29%, grade F, #489 of 667 statewide, top 74%, 1,337 students, 63% FRL) — zoned schools average 68% FRL vs 48% district-wide (19 pts higher); higher-poverty schools than district average — tighter screening recommended.
- Zoned-school proficiency averages 33% at this address vs 51% district-wide (-18 pts) — the specific schools serving this property underperform the Bay average; the district grade overstates school quality for this exact location.
- Market conditions: Rents rising (+1.1%/yr); 983 active listings in the ZIP; 9 comparable units currently listed for rent nearby; rentals at typical pace (median 23d on market — plan ~3-4 weeks tenant-placement turnaround); 2,473 units permitted in Bay County in 2024 (559 in 5+ unit buildings).
Forward outlook
- Local home prices are declining (-3.0%/yr); year-one equity from $35 of loan paydown is wiped out by about $150 of value loss. Plan a longer hold.
- Bay County population projected at +24% by 2050 — long-run rental-demand tailwind backs the buy-and-hold thesis.
- At projected returns (-3.0% appreciation + 1.1% rent growth), your $1k cash investment doubles in ~1 year — after that, you're playing with house money.
Negotiation context
- Only 10 days on market — expect competitive offers; lowballing is unlikely to land.
- 5 sale attempts since 19y ago with the ask held roughly flat each time — persistent listings suggest the price (not the market) is what's stuck; bring a comps-based counter.
Risks & watch-outs
- Climate carrying-cost: severe wind risk, 99% chance of damaging wind over 30y; major wildfire risk; extreme-heat days projected 7→21/yr by 2055 (HVAC capex compounding) — expect insurance premiums to compound above CPI over the hold.
Questions for the listing agent
- Is there a deadline driving the sale (1031 exchange, divorce, estate, relocation)? That informs how much negotiation room exists.
- Schools are F-rated, which usually means shorter tenancies and higher turnover. Who's the typical renter profile here, and what's been the actual vacancy rate?
- The area grade is low — what's the realistic commute time and amenity access for the typical tenant pool here? Any planned neighborhood developments (good or bad) we should know about?
- What's the average days-on-market for RENTAL listings here right now (not sales)? A rising rental-DOM trend means longer vacancies and softer asking-rent achievability than the comps imply.
- What's the recent tenant-quality profile in this submarket — average credit score on applications, eviction rate, late-payment / NSF rate, and stable-employment percentage? A property-management company in the area should have these aggregated.
- How much new for-sale + rental construction is in the pipeline within 1–3 miles? Heavy new supply typically softens prices + rents 12–24 months out; constrained supply supports both.
Investment metrics
- 1% rule
- 28.69% ✓
- Cap rate
- 269.95%
- Cash-on-cash
- 941.62%
- DSCR
- 42.90
- GRM
- 0.3
CMA / ARV
- ARV (on-the-fly)
- $229,284
- Comps found
- 4
Show comp detail 4 sales within ~0.75 mi
| Address | Dist | Beds/Ba | Sqft | Sold | Price | $/sf | Match |
|---|---|---|---|---|---|---|---|
| 925 Hurst Ct | 0.12mi | 3/1.0 (+1) | 1,176 (-1%) | 11mo | $185,000 | $157 | 79 |
| 7169 Fox Meadow Dr | 0.30mi | 3/2.0 (+1) | 1,365 (+15%) | 2mo | $248,000 | $182 | 51 |
| 6724 E 6th St | 0.75mi | 3/2.0 (+1) | 1,218 (+2%) | 14mo | $263,000 | $216 | 40 |
| 514 J H Crews Cir | 0.70mi | 3/2.0 (+1) | 1,346 (+13%) | 17mo | $260,000 | $193 | 22 |
Match score weights: distance 35% · size 25% · config 20% · recency 20%. Top-matched comps best support the ARV.
Projected returns pro-forma
-3.0% appreciation · 1.12% rent growth · sell at horizon
- IRR
- —
- Equity multiple
- 48.51×
- Total profit
- $66,515
- Equity at exit
- $746
- IRR
- —
- Equity multiple
- 99.27×
- Total profit
- $137,579
- Equity at exit
- $432
Cash invested: $1,400 (down + closing). Projections, not guarantees.
Landlord ↔ Tenant lean methodology
- Overall (STATE)
- 87 Strongly Landlord-Friendly
- State Florida
- 87 Strongly Landlord-Friendly · R+3
- County
- — inherits STATE
- City
- — inherits STATE
ZIP-level market 32404
- Home prices YoY
- -16.1%
- Rents YoY
- 1.1%
- Active inventory
- 983
- Price-to-rent
- 0.3×
Monthly cashflow live
- Estimated rent
- $1,434 high interval (Pro) →
- Mortgage (P&I)
- −$26
- Tax est. 1.5%
- −$6 /mo · $75/yr
- Insurance
- −$2
- HOA
- −$0
- Vacancy / Maint / Mgmt
- −$301
- Net cashflow
- $1,099
Break-even live
Sensitivity live
| Price | -10% $1,102 | -5% $1,100 | +0% $1,099 | +5% $1,097 | +10% $1,095 |
|---|---|---|---|---|---|
| Rent | -10% $985 | -5% $1,042 | +0% $1,099 | +5% $1,155 | +10% $1,212 |
| Rate | -1.0pp $1,101 | -0.5pp $1,100 | base $1,099 | +0.5pp $1,097 | +1.0pp $1,096 |
UW: 25.0% down · 7.5% · 30yr · 1.5% tax · 5.0% vac · 8.0% maint · 8.0% mgmt
Financing live
Cash to close
- Down payment
- $1,250
- Closing costs
- $150
- Reserves months
- —
- Total cash needed
- —
Loan-product check · same deal, 3 products live
Conventional
25% down · 7.5% · 30yr
- Down + closing
- —
- Monthly P&I
- —
- Monthly cashflow
- —
- DSCR
- —
- Eligible?
- —
Personal DTI + credit; lowest rate.
DSCR
20% down · 8.5% · 30yr
- Down + closing
- —
- Monthly P&I
- —
- Monthly cashflow
- —
- DSCR
- —
- Eligible?
- —
No personal income docs; deal must DSCR.
Hard money
10% down · 12.0% · 12mo
- Down + closing
- —
- Monthly P&I
- —
- Monthly cashflow
- —
- DSCR
- —
- Eligible?
- —
Short-term bridge; refi at stabilization.
Rent comps 9 comps
| Address | Beds | Baths | Sqft | Rent | $/sqft | DOM | Units | Dist |
|---|---|---|---|---|---|---|---|---|
| 263 Nelle Ave Panama City, FL | 3.0 | 2.0 | 1294 | $1,690 | $1.31 | 23d | 1 | 0.95mi |
| 291 Sukoshi Dr Unit A Panama City, FL | 2.0 | 1.5 | 918 | $1,495 | $1.63 | 23d | 1 | 1.09mi |
| 285 Sukoshi Dr Unit C Panama City, FL | 2.0 | 1.5 | 916 | $1,250 | $1.36 | 15d | 1 | 1.13mi |
| 7006 Lois St Unit B Panama City, FL | 2.0 | 1.0 | 1000 | $1,000 | $1.00 | 23d | 1 | 1.22mi |
| 116 Christie Ln Panama City, FL | 3.0 | 2.0 | 1092 | $1,550 | $1.42 | 23d | 1 | 1.29mi |
| 168 N Comet Ave Panama City, FL | 2.0 | 2.0 | 950 | $1,100 | $1.16 | 23d | 1 | 1.44mi |
| 6121 Harvey St Apt 16 Panama City, FL | 2.0 | 1.5 | 1000 | $1,090 | $1.09 | 23d | 1 | 1.44mi |
| 6121 Harvey St Unit 8 Panama City, FL | 2.0 | 1.5 | 1200 | $1,050 | $0.88 | 23d | 1 | 1.44mi |
| 6101 Harvey St #3 Panama City, FL | 2.0 | 1.5 | 1108 | $1,050 | $0.95 | 23d | 1 | 1.46mi |
Listing history 8 events
-
2026-06-15days on market $5,000 Active 10 DOM
-
2026-06-14days on market $5,000 Active 8 DOM
-
2026-06-13days on market $5,000 Active 7 DOM
-
2026-06-10days on market $5,000 Active 5 DOM
-
2026-06-09days on market $5,000 Active 4 DOM
-
2026-06-08days on market $5,000 Active 3 DOM
-
2026-06-07remarks 318-char remark
-
2026-06-07$5,000 Active 2 DOM
ⓘ Source: listings_history table (triggers on properties + properties_extension) + one-shot
backfill from property_details.listing_events for pre-trigger history.
Climate risk First Street
- Flood 1/10 Low FEMA zone X (unshaded) · 0% chance over 30 yrs
- Wildfire 7/10 Severe
- Heat 10/10 Extreme 7 d/yr ≥105°F today · 21 d/yr by 30 yrs out
- Wind 9/10 Extreme 99% chance of damaging wind over 30 yrs
- Air quality 1/10 Low 0 unhealthy d/yr today · 0 by 30 yrs out
Nearby sold comps map
Loading sold comps map…
Walkable amenities ~0.75 mi
Loading nearby amenities…
Taxation est. · year 1
- Rental income
- $17,212
- − Mortgage interest
- −$280
- − Property taxes
- −$75
- − Insurance
- −$25
- − Repairs & maintenance
- −$1,377
- − Management
- −$1,377
- − Depreciation
- −$145
- Taxable income
- $13,932
- Est. tax owed @ 24.0%
- −$3,344
- After-tax cash flow
- $9,839/yr
For passive investors: Depreciation is non-cash, so a rental often shows a tax loss while cash-flowing — sheltering income. Rental losses are passive: they offset passive income freely, and up to $25,000/yr can offset ordinary (W-2) income if you actively participate and your MAGI is under $100k (phasing out to $0 by $150k); unused losses carry forward. On sale, claimed depreciation is recaptured at up to 25%, and gains may owe capital-gains tax (a 1031 exchange can defer both). Figures are a year-1 estimate at your 24.0% rate — not tax advice; consult a CPA.
Schools (NCES district)
- District
- Bay
- NCES district ID
- 1200090
- Math proficiency
- 51% ▼ -8.00%
- Reading proficiency
- 51% ▼ -7.00%
- Median HH income
- $47,740
- Composite
- 43.41/100
- National rank
- #3014
- State rank
- #29 of 73 in FL
Livability — Callaway
- Score
- 64/100
- State rank
- #690
- US rank
- #14384
Category grades
Schools grade is shown separately in the Schools card above.
Census & demographics
- County
- Bay County · 163,593 people
- Metro
- Panama City, FL
- Population (ZIP)
- 42,514
- Household income
- $74,708
- Rent vs Own
- Severe rent burden
- 1218.0
Population outlook (Bay County) Hauer SSP2
- Today (2025)
- 206,264 people
- By 2030
- 217,740 · +5.6%
- By 2040
- 238,738 · +15.7%
- By 2050
- 255,545 · +23.9%
- By 2075
- 288,295 · +39.8%
- By 2100
- 288,638 · +39.9%
Race, ethnicity, and origin ACS 2023
- Neighborhood character
- Predominantly White (69%)
- Race & ethnicity
- White 69% Black 12% Two or more races 10% Hispanic / Latino 9% Asian 3%
- Hispanic origin (detail)
- Mexican 2% Puerto Rican 3%
- Common ancestry
- Lithuanian 3% Slovak 2% Italian 2%
- Foreign-born
- 7% · Canada, Vietnam, Mexico
- Languages at home
- 90% English-only · Spanish 6% Vietnamese 1% Other Asian/Pacific 1%
Political lean MEDSL · Bay
- 2024 margin
- Solid R (+47.4) · D 25.8% · R 73.1% · Other 1.1%
- 2008→2024 swing
- -6.6pp toward R · 2008: -40.7pp · 2024: -47.4pp
- All cycles
- 2024: R+47.4 2020: R+43.5 2016: R+46.3 2012: R+43.6 2008: R+40.7
Not yet ingested
- Civics
- —
Market trends
- HPI YoY
- ▼ -50.59%
- Current HPI
- 263.7178
- Rent YoY
- ▲ 1.12%
- Metro
- Panama City, FL
- State GDP YoY
- ▲ 3.28%
- F500 in state
- 36
Industry mix (Fortune 500 HQ in FL)
| Industry | F500 HQs | Revenue |
|---|---|---|
| Industrial Technology | 2 | $29B |
|
||
| Insurance | 2 | $17B |
|
||
| Retail | 1 | $60B |
|
||
| Technology Distribution | 1 | $58B |
|
||
| Homebuilding | 1 | $35B |
|
||
| Technology Manufacturing | 1 | $35B |
|
||
Price history
-88.1% since first listed16 events — show timeline
- 2026-06-05 Listed $5,000 NFMLS
- 2025-02-07 Listing Removed — CPARMLS
- 2025-02-05 Price Changed $235,000 CPARMLS
- 2025-01-07 Price Changed $245,500 CPARMLS
- 2024-12-12 Listed $250,000 CPARMLS
- 2022-08-11 Sold (Public Records) $160,000 Public Records
- 2022-08-11 Sold (MLS) $160,000 CPARMLS
- 2022-06-28 Listed $160,000 CPARMLS
- 2018-12-06 Sold (Public Records) $138,000 Public Records
- 2018-12-05 Sold (MLS) $138,000 CPARMLS
- 2018-08-25 Listed $135,000 CPARMLS
- 2007-10-30 Sold (Public Records) $126,000 Public Records
- 2007-10-29 Sold (MLS) $126,000 CPARMLS
- 2007-09-04 Listed $126,000 CPARMLS
- 2000-02-02 Sold (Public Records) $93,000 Public Records
- 1987-08-01 Sold (Public Records) $42,000 Public Records
Property tax history
+5.6%/yrLatest (2025): $1,304 · +3.8% YoY. Source: county tax records.
Cash-flow waterfall
monthlySold comps — $/sqft
last 12 mo · ≤1 miLoading sold comps…