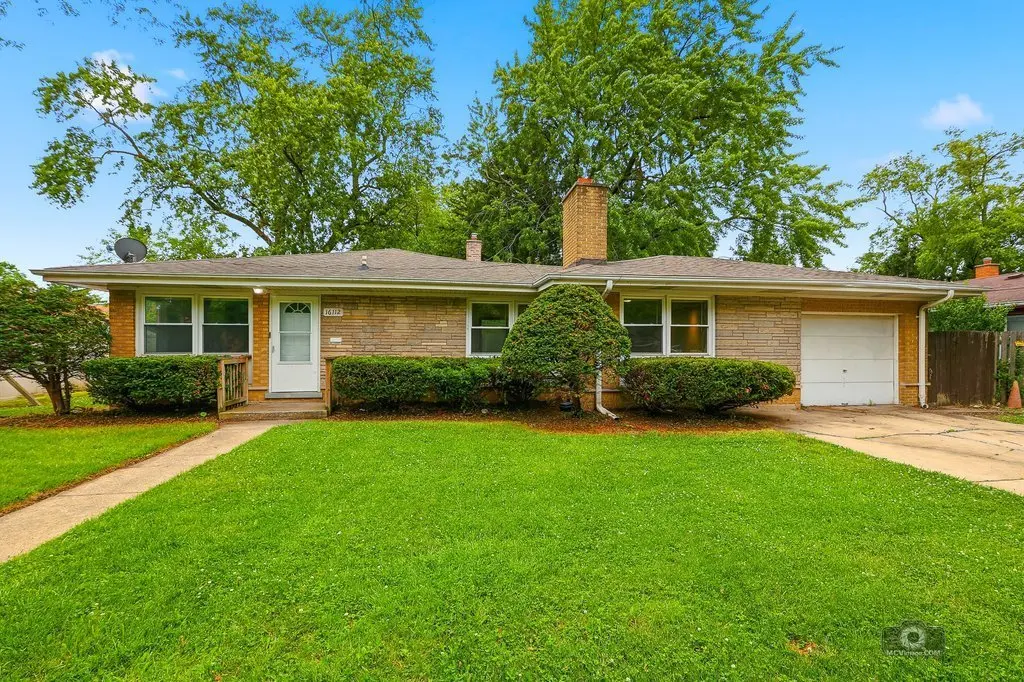
16112 University Ave · South Holland, IL
Flood risk 4/10 · Minor
- FEMA flood zone
- X (shaded)
- Chance of flooding over 30 yrs
- 0.22%
- Est. flood insurance / yr
- $473 – $860
Fire risk 1/10 · Minimal
- Est. fire insurance / yr
- $804 – $1,492
Heat risk 3/10 · Minor
- Hot days now (above 103°F)
- 7 days/yr
- Hot days in 30 yrs
- 15 days/yr
Wind risk 2/10 · Minimal
- Chance of severe wind over 30 yrs
- —
Air-quality risk 4/10 · Minor
- Unhealthy air days now
- 4 days/yr
- Unhealthy air days in 30 yrs
- 5 days/yr
Risk factors via First Street. Map © Google.
Why this score? — see what drove the C grade
The composite is a weighted blend of 9 inputs, each scored 0–100. Each bar is that input's sub-score; the figure is the points it added to the 100-point composite (weight × sub-score).
- Cash flow +22.4/30.0
- 1% rule +9.0/10.0
- ARV discount +8.8/15.0
- DSCR +7.2/10.0
- Livability +3.9/5.0
- Rent growth +2.5/5.0
- Condition / age +2.5/5.0
- Schools +0.7/10.0
- Appreciation +0.0/10.0
$219,000
🖨 Deal sheet 📄 Offer letter ✓ Due diligence
Listing remarks MLS
Attention investors! This turn-key, professionally managed investment home was recently refreshed for a new resident in August 2019 and has a two year lease in place bringing in $1625 per month with the resident responsible for paying the utilities and lawn-care/snow removal. Projected annual cash on cash return of 15.28%! This low maintenance home has beautiful hardwood and tile throughout a majority of the rooms, updated kitchen with black appliances and updated bathrooms. Located in a desirable neighborhood in South Holland, this brick home features a nice sized backyard with beautiful mature trees. The property was rehabbed around 2013 and it appears most of the major items like windows, roof, and mechanicals were replaced around that time. This investment opportunity will not last long Owner has additional properties for sale and is willing to sell as a package or individually. Please contact the listing agent for more details.
Key facts
- Dining area
- Family room
- Back patio
Tags
Property features AI
Finance
- Other: Possession at closing
- HOA & community: No master association fee required
Exterior
- Parking: Attached garage with concrete driveway (1 garage space, 1 total parking space)
- Utilities: Lake Michigan water source; Public sewer
- Home design: Detached single-family home; 1.5-story design; Fee simple ownership
- Construction: Brick construction; Built approximately 61–70 years ago; Property built before 1978
- Exterior features: Less than 0.25 acre lot; Lot dimensions listed
Interior
- Kitchen: Range; Microwave; Refrigerator; Kitchen with eating area / dining combo
- Bedrooms: Three bedrooms (master and two additional bedrooms on second level)
- Flooring: Carpet in living room
- Bathrooms: One full bathroom; One half bathroom
- Heating & cooling: Natural gas heating; Central air conditioning; One fireplace located in the family room
- Interior features: Seven total rooms; Finished full basement
- Laundry & utility: Basement laundry room (15 x 10)
Neighborhood map
What this means for you Summary
Snapshot
- This is a 3-bed/1.5-bath single-family listed at $219k.
Deal economics
- At list price, monthly cash flow is $365 ($4k/yr) — positive.
- The deal already cash-flows at list — no discount required.
- Meets the 1% rule at list price ($3k rent vs $219k).
Location & tenants
- Location reads 77/100 on livability (#167 in IL, #3,071 nationally) — a middle-class / working-renter tenant base. Strengths: commute A+, housing A+, cost of living A; Watch: crime C-, amenities C-, schools D+.
- Thornton Twp Hsd 205 (suburban): math 7% / reading 8% proficiency, ranked #594 of 620 in IL (top 96%) — low school quality limits family demand, transient renter base, plan for 1-2y turnover.
- Market conditions: 135 active listings in the ZIP; 9 comparable units currently listed for rent nearby; rentals leasing fast (median 8d on market — plan ~1-2 weeks tenant-placement turnaround); 6,272 units permitted in Cook County in 2024 (4,658 in 5+ unit buildings).
Forward outlook
- Local home prices are declining (-3.0%/yr); year-one equity from $2k of loan paydown is wiped out by about $7k of value loss. Plan a longer hold.
Negotiation context
- Only 7 days on market — expect competitive offers; lowballing is unlikely to land.
- 5 sale attempts since 13y ago with the ask held roughly flat each time — persistent listings suggest the price (not the market) is what's stuck; bring a comps-based counter.
- Current owner paid $125k; list at $219k implies a 75% gain — meaningful room to come down on a strong offer.
Risks & watch-outs
- Watch-outs: property tax is 4.5% of price.
Questions for the listing agent
- Built in 1960 — when were the roof, HVAC, electrical panel, plumbing, and water heater last replaced?
- Property tax is high relative to price — has the assessment been appealed recently, and will the sale trigger a re-assessment?
- Is there a deadline driving the sale (1031 exchange, divorce, estate, relocation)? That informs how much negotiation room exists.
- Schools are D-rated, which usually means shorter tenancies and higher turnover. Who's the typical renter profile here, and what's been the actual vacancy rate?
- What's the average days-on-market for RENTAL listings here right now (not sales)? A rising rental-DOM trend means longer vacancies and softer asking-rent achievability than the comps imply.
- What's the recent tenant-quality profile in this submarket — average credit score on applications, eviction rate, late-payment / NSF rate, and stable-employment percentage? A property-management company in the area should have these aggregated.
- How much new for-sale + rental construction is in the pipeline within 1–3 miles? Heavy new supply typically softens prices + rents 12–24 months out; constrained supply supports both.
Investment metrics
- 1% rule
- 1.40% ✓
- Cap rate
- 8.29%
- Cash-on-cash
- 7.13%
- DSCR
- 1.32
- GRM
- 6.0
CMA / ARV
- ARV (on-the-fly)
- $225,288
- Comps found
- 12
Show comp detail 12 sales within ~0.75 mi
| Address | Dist | Beds/Ba | Sqft | Sold | Price | $/sf | Match |
|---|---|---|---|---|---|---|---|
| 1006 E 163rd St | 0.28mi | 3/2.0 | 1,263 (-6%) | 1mo | $262,500 | $208 | 74 |
| 1103 E 166th Pl | 0.68mi | 3/2.0 | 1,348 (+0%) | 2mo | $210,000 | $156 | 63 |
| 702 E 162nd Pl | 0.57mi | 3/2.0 | 1,400 (+4%) | 1mo | $230,000 | $164 | 63 |
| 944 E 163rd Pl | 0.36mi | 3/2.0 | 1,205 (-10%) | 2mo | $201,000 | $167 | 62 |
| 16428 Greenwood Ave | 0.42mi | 4/2.0 (+1) | 1,260 (-6%) | 3mo | $215,000 | $171 | 61 |
| 618 E 159th Pl | 0.62mi | 4/2.0 (+1) | 1,294 (-4%) | 2mo | $236,000 | $182 | 57 |
| 823 E 163rd St | 0.45mi | 3/1.0 | 1,184 (-12%) | 1mo | $197,500 | $167 | 57 |
| 16549 Cottage Grove Ave | 0.70mi | 3/2.0 | 1,426 (+6%) | 2mo | $219,500 | $154 | 53 |
| 16211 Joyce Cir | 0.73mi | 3/2.0 | 1,424 (+6%) | 3mo | $239,000 | $168 | 51 |
| 746 E 157th St | 0.70mi | 4/2.0 (+1) | 1,403 (+5%) | 3mo | $180,000 | $128 | 50 |
| 15726 Ingleside Ave | 0.51mi | 3/2.0 | 1,171 (-13%) | 4mo | $220,000 | $188 | 49 |
| 664 E 163rd St | 0.61mi | 4/2.0 (+1) | 1,170 (-13%) | 4mo | $200,000 | $171 | 40 |
Match score weights: distance 35% · size 25% · config 20% · recency 20%. Top-matched comps best support the ARV.
Projected returns pro-forma
-3.0% appreciation · 3.0% rent growth · sell at horizon
- IRR
- -5.2%
- Equity multiple
- 0.81×
- Total profit
- $-11,889
- Equity at exit
- $32,654
- IRR
- 4.7%
- Equity multiple
- 1.34×
- Total profit
- $21,089
- Equity at exit
- $18,935
Cash invested: $61,320 (down + closing). Projections, not guarantees.
Landlord ↔ Tenant lean methodology
- Overall (STATE)
- 43 Moderately Tenant-Leaning
- State Illinois
- 43 Moderately Tenant-Leaning · D+7
- County
- — inherits STATE
- City
- — inherits STATE
ZIP-level market 60473
- Active inventory
- 135
- Price-to-rent
- 6.0×
Monthly cashflow live
- Estimated rent
- $3,065 high interval (Pro) →
- Mortgage (P&I)
- −$1,148
- Tax from tax record
- −$817 /mo · $9,803/yr
- Insurance
- −$91
- HOA
- −$0
- Vacancy / Maint / Mgmt
- −$644
- Net cashflow
- $365
Break-even live
UW: 25.0% down · 7.5% · 30yr · 1.5% tax · 5.0% vac · 8.0% maint · 8.0% mgmt
Financing live
Cash to close
- Down payment
- $54,750
- Closing costs
- $6,570
- Reserves months
- —
- Total cash needed
- —
Loan-product check · same deal, 3 products live
Conventional
25% down · 7.5% · 30yr
- Down + closing
- —
- Monthly P&I
- —
- Monthly cashflow
- —
- DSCR
- —
- Eligible?
- —
Personal DTI + credit; lowest rate.
DSCR
20% down · 8.5% · 30yr
- Down + closing
- —
- Monthly P&I
- —
- Monthly cashflow
- —
- DSCR
- —
- Eligible?
- —
No personal income docs; deal must DSCR.
Hard money
10% down · 12.0% · 12mo
- Down + closing
- —
- Monthly P&I
- —
- Monthly cashflow
- —
- DSCR
- —
- Eligible?
- —
Short-term bridge; refi at stabilization.
Rent comps 9 comps
| Address | Beds | Baths | Sqft | Rent | $/sqft | DOM | Units | Dist |
|---|---|---|---|---|---|---|---|---|
| 16246 Dobson Ave South Holland, IL | 3.0 | 2.0 | 1250 | $3,170 | $2.54 | 2d | 1 | 0.21mi |
| 16001 Avalon Ave South Holland, IL | 3.0 | 2.0 | 1136 | $3,330 | $2.93 | 6d | 1 | 0.24mi |
| 15707 Dante Dr South Holland, IL | 3.0 | 2.0 | 1800 | $2,950 | $1.64 | 3d | 1 | 0.69mi |
| 15509 Park Ln South Holland, IL | 4.0 | 1.5 | 1200 | $3,400 | $2.83 | 7d | 1 | 1.04mi |
| 15509 Park Ln South Holland, IL | 4.0 | 1.5 | 1200 | $3,400 | $2.83 | 24d | 1 | 1.04mi |
| 15231 Hastings Dr Dolton, IL | 4.0 | 1.5 | 1487 | $2,146 | $1.44 | 7d | 1 | 1.09mi |
| 15400 Merrill Ave South Holland, IL | 4.0 | 2.0 | 1508 | $3,330 | $2.21 | 22d | 1 | 1.32mi |
| 660 Clyde Ave Calumet City, IL | 3.0 | 1.5 | 1400 | $1,750 | $1.25 | 3d | 1 | 1.39mi |
| 659 Paxton Ave Calumet City, IL | 3.0 | 2.0 | 1255 | $2,461 | $1.96 | 10d | 1 | 1.49mi |
Listing history 7 events
-
2026-06-18days on market $219,000 Active 7 DOM
-
2026-06-17days on market $219,000 Active 6 DOM
-
2026-06-16days on market $219,000 Active 5 DOM
-
2026-06-15days on market $219,000 Active 4 DOM
-
2026-06-13days on market $219,000 Active 2 DOM
-
2026-06-13remarks 556-char remark
-
2026-06-13$219,000 Active 1 DOM
ⓘ Source: listings_history table (triggers on properties + properties_extension) + one-shot
backfill from property_details.listing_events for pre-trigger history.
Tax reassessment forecast IL · Partial reset (capped growth)
- Current annual tax
- $9,803 · $817/mo
- Projected year-2 tax
- $9,803 · $817/mo
- Expected delta
- $0/yr ($0/mo · 0.0%)
ⓘ Screening estimate from a state-policy table — verify with the county assessor before closing.
Climate risk First Street
- Flood 4/10 Moderate FEMA zone X (shaded) · 22% chance over 30 yrs
- Wildfire 1/10 Low
- Heat 3/10 Moderate 7 d/yr ≥103°F today · 15 d/yr by 30 yrs out
- Wind 2/10 Low
- Air quality 4/10 Moderate 4 unhealthy d/yr today · 5 by 30 yrs out
Nearby sold comps map
Loading sold comps map…
Walkable amenities ~0.75 mi
Loading nearby amenities…
Taxation est. · year 1
- Rental income
- $36,777
- − Mortgage interest
- −$12,267
- − Property taxes
- −$9,803
- − Insurance
- −$1,095
- − Repairs & maintenance
- −$2,942
- − Management
- −$2,942
- − Depreciation
- −$6,371
- Taxable income
- $1,357
- Est. tax owed @ 24.0%
- −$326
- After-tax cash flow
- $4,049/yr
For passive investors: Depreciation is non-cash, so a rental often shows a tax loss while cash-flowing — sheltering income. Rental losses are passive: they offset passive income freely, and up to $25,000/yr can offset ordinary (W-2) income if you actively participate and your MAGI is under $100k (phasing out to $0 by $150k); unused losses carry forward. On sale, claimed depreciation is recaptured at up to 25%, and gains may owe capital-gains tax (a 1031 exchange can defer both). Figures are a year-1 estimate at your 24.0% rate — not tax advice; consult a CPA.
Schools (NCES district)
- District
- Thornton Twp Hsd 205
- NCES district ID
- 1738970
- Math proficiency
- 7% ▬ 0.00%
- Reading proficiency
- 8% ▼ -2.00%
- Median HH income
- $43,392
- Composite
- 6.92/100
- National rank
- #9976
- State rank
- #594 of 620 in IL
Livability — South Holland
- Score
- 77/100
- State rank
- #167
- US rank
- #3071
Category grades
Schools grade is shown separately in the Schools card above.
Census & demographics
- Census place
- South Holland, IL
- City population
- 21,407
- Population (ZIP)
- 21,407
Population outlook (Cook County) Hauer SSP2
- Today (2025)
- 5,347,519 people
- By 2030
- 5,357,703 · +0.2%
- By 2040
- 5,324,924 · -0.4%
- By 2050
- 5,230,762 · -2.2%
- By 2075
- 4,785,735 · -10.5%
- By 2100
- 4,188,836 · -21.7%
Race, ethnicity, and origin ACS 2023
- Neighborhood character
- Predominantly Black (75%)
- Race & ethnicity
- Black 75% White 10% Hispanic / Latino 10% Two or more races 3% Asian 1%
- Hispanic origin (detail)
- Mexican 9% Puerto Rican 1%
- Common ancestry
- Iranian 3% Romanian 2%
- Foreign-born
- 6% · Canada, China
- Languages at home
- 87% English-only · Spanish 8% Other Asian/Pacific 1% Russian/Polish/Slavic 1%
Political lean MEDSL · Cook
- 2024 margin
- Solid D (+42.0) · D 70.4% · R 28.4% · Other 1.2%
- 2008→2024 swing
- -11.4pp toward R · 2008: 53.4pp · 2024: 42.0pp
- All cycles
- 2024: D+42.0 2020: D+50.3 2016: D+53.0 2012: D+49.4 2008: D+53.4
Not yet ingested
- Civics
- —
Market trends
- HPI YoY
- ▼ -114.36%
- Current HPI
- 201.2479
- Rent YoY
- —
- Metro
- —
- State GDP YoY
- ▲ 1.59%
- F500 in state
- 60
Industry mix (Fortune 500 HQ in IL)
| Industry | F500 HQs | Revenue |
|---|---|---|
| Insurance | 4 | $201B |
|
||
| Consumer Goods | 4 | $87B |
|
||
| Industrial Machinery | 3 | $64B |
|
||
| Healthcare | 2 | $55B |
|
||
| Retail / Pharmacy | 1 | $148B |
|
||
| Agriculture / Food | 1 | $86B |
|
||
Price history
+338.9% since first listed13 events — show timeline
- 2026-06-10 Listed $219,000 MRED as Distributed by MLS Grid
- 2020-08-03 Sold (Public Records) $125,000 Public Records
- 2020-06-11 Sold (MLS) $125,000 MRED as Distributed by MLS Grid
- 2020-03-18 Pending — MRED as Distributed by MLS Grid
- 2020-01-13 Listing Removed — MRED as Distributed by MLS Grid
- 2020-01-13 Listed $130,000 MRED as Distributed by MLS Grid
- 2019-10-17 Listed — MRED as Distributed by MLS Grid
- 2013-08-06 Sold (Public Records) $132,500 Public Records
- 2013-07-15 Sold (MLS) $132,500 MRED as Distributed by MLS Grid
- 2013-04-10 Listed — MRED as Distributed by MLS Grid
- 2013-03-29 Sold (MLS) $53,200 MRED as Distributed by MLS Grid
- 2013-03-01 Pending — MRED as Distributed by MLS Grid
- 2013-02-22 Listed $49,900 MRED as Distributed by MLS Grid
Property tax history
+5.6%/yrLatest (2023): $9,803 · +22.0% YoY. Source: county tax records.
Cash-flow waterfall
monthlySold comps — $/sqft
last 12 mo · ≤1 miLoading sold comps…