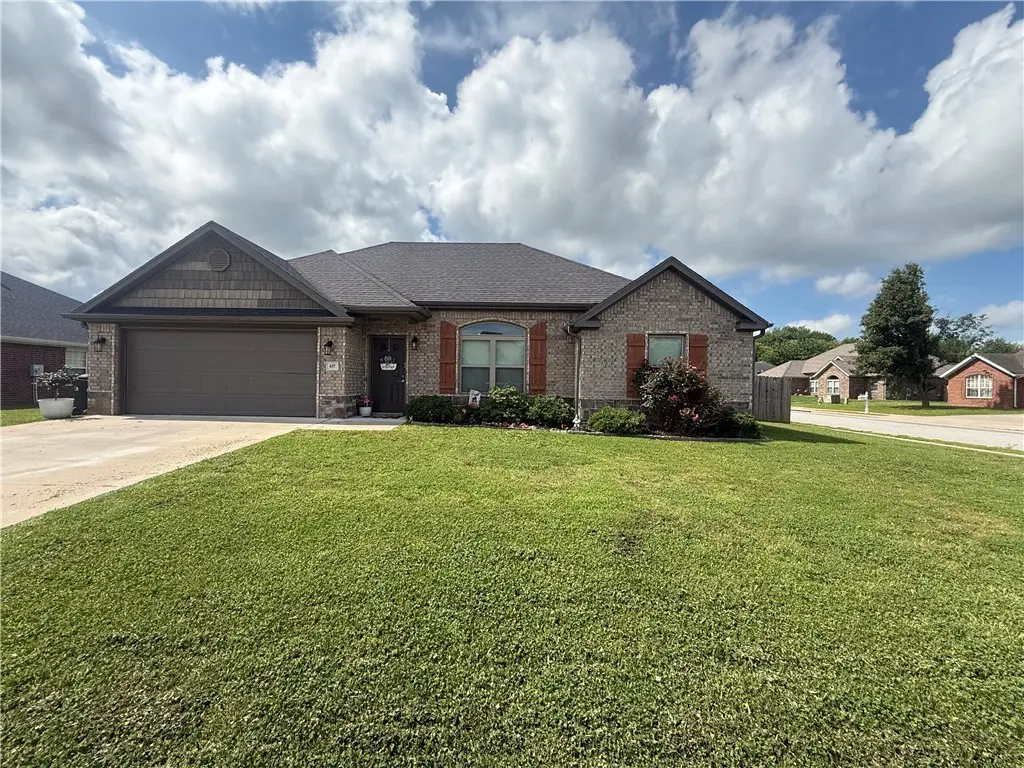
437 Oxen Ln · West Fork, AR
Flood risk 1/10 · Minimal
- FEMA flood zone
- X (unshaded)
- Chance of flooding over 30 yrs
- 0.0%
- Est. flood insurance / yr
- $507 – $1,088
Fire risk 6/10 · Moderate
- Est. fire insurance / yr
- $1,499 – $2,785
Heat risk 5/10 · Moderate
- Hot days now (above 104°F)
- 8 days/yr
- Hot days in 30 yrs
- 23 days/yr
Wind risk 2/10 · Minimal
- Chance of severe wind over 30 yrs
- 3.0%
Air-quality risk 2/10 · Minimal
- Unhealthy air days now
- 1 days/yr
- Unhealthy air days in 30 yrs
- 1 days/yr
Risk factors via First Street. Map © Google.
Why this score? — see what drove the C grade
The composite is a weighted blend of 9 inputs, each scored 0–100. Each bar is that input's sub-score; the figure is the points it added to the 100-point composite (weight × sub-score).
- Cash flow +27.9/30.0
- DSCR +9.9/10.0
- 1% rule +7.0/10.0
- Livability +3.3/5.0
- ARV discount +2.6/15.0
- Rent growth +2.5/5.0
- Condition / age +2.5/5.0
- Schools +2.3/10.0
- Appreciation +0.0/10.0
$278,000
🖨 Deal sheet 📄 Offer letter ✓ Due diligence
Listing remarks MLS
New construction split floor plan, stainless steel appliances, privacy fence, gutters, mini blinds, 3 bed 2 bath home, 2 car garage.
Key facts
- Ceiling fans
- Eat-in kitchen
- Granite countertops
Tags
Property features AI
Finance
- HOA & community: Homeowners association with an annual fee (listed); Community features include curbs and sidewalks
Exterior
- Parking: Attached garage with automatic garage door opener; 2 covered parking spaces
- Security: Smoke detectors
- Utilities: Electricity available; Natural gas available; Sewer available (private sewer)
- Home design: Single-story home; Residential zoning; Entry and layout suitable for resale (under 25 years old)
- Construction: Brick, rock, and vinyl siding exterior; Architectural shingle roof; Slab foundation; Resale construction (less than 25 years old)
- Exterior features: Concrete driveway; Covered patio/porch; Wood privacy fencing in back yard; Cleared and landscaped yard; Corner lot in a subdivision; Shared road frontage
Interior
- Kitchen: Dishwasher; Electric range; Microwave with hood fan; Disposal; Plumbed for ice maker; Granite countertops
- Bedrooms: Bedrooms arranged in a split layout
- Flooring: Laminate flooring
- Bathrooms: 2 full bathrooms
- Heating & cooling: Central heating (gas); Central electric air conditioning
- Interior features: Built-in features; Ceiling fan(s); Granite counters; Split-bedroom floorplan; Window treatments; Double-pane vinyl windows with blinds
- Laundry & utility: Washer hookup; Dryer hookup; Gas water heater
Neighborhood map
What this means for you Summary
Snapshot
- This is a 3-bed/2.0-bath single-family listed at $278k.
Deal economics
- At list price, monthly cash flow is $859 ($10k/yr) — positive.
- The deal already cash-flows at list — no discount required.
- Meets the 1% rule at list price ($3k rent vs $278k).
- Cap rate 10.0% vs local median 5.5% in West Fork — top-decile yield for the area; either an underpriced asset or a hidden risk that comps aren't pricing in. Stress-test before assuming the spread holds.
Location & tenants
- Location reads 66/100 on livability (#126 in AR) — a middle-class / working-renter tenant base. Strengths: crime A+, cost of living A+, housing A+; Watch: schools D-, amenities F, commute F.
- Greenland School District (suburban): math 25% / reading 29% proficiency, ranked #168 of 238 in AR (top 71%) — low school quality limits family demand, transient renter base, plan for 1-2y turnover.
- Market conditions: 74 active listings in the ZIP; 3,494 units permitted in Washington County in 2024 (1,497 in 5+ unit buildings).
Forward outlook
- Local home prices are declining (-3.0%/yr); year-one equity from $2k of loan paydown is wiped out by about $8k of value loss. Plan a longer hold.
- Washington County population projected at +47% by 2050 — long-run rental-demand tailwind backs the buy-and-hold thesis.
- At projected returns (-3.0% appreciation + 3.0% rent growth), your $78k cash investment doubles in ~9 years — after that, you're playing with house money.
Negotiation context
- Only 3 days on market — expect competitive offers; lowballing is unlikely to land.
- 2 sale attempts since 6y ago with the ask held roughly flat each time — persistent listings suggest the price (not the market) is what's stuck; bring a comps-based counter.
- Current owner paid $199k; 40% above their basis — modest negotiation headroom, anchor on the comps not their cost.
Risks & watch-outs
- Climate carrying-cost: major wildfire risk; extreme-heat days projected 8→23/yr by 2055 (HVAC capex compounding) — expect insurance premiums to compound above CPI over the hold.
Questions for the listing agent
- What does the HOA fee cover, when was the last increase, and are there any pending special assessments or reserve-fund shortfalls?
- Is there a deadline driving the sale (1031 exchange, divorce, estate, relocation)? That informs how much negotiation room exists.
- Schools are D-rated, which usually means shorter tenancies and higher turnover. Who's the typical renter profile here, and what's been the actual vacancy rate?
- What's the average days-on-market for RENTAL listings here right now (not sales)? A rising rental-DOM trend means longer vacancies and softer asking-rent achievability than the comps imply.
- What's the recent tenant-quality profile in this submarket — average credit score on applications, eviction rate, late-payment / NSF rate, and stable-employment percentage? A property-management company in the area should have these aggregated.
- How much new for-sale + rental construction is in the pipeline within 1–3 miles? Heavy new supply typically softens prices + rents 12–24 months out; constrained supply supports both.
Investment metrics
- 1% rule
- 1.20% ✓
- Cap rate
- 10.00%
- Cash-on-cash
- 13.24%
- DSCR
- 1.59
- GRM
- 6.9
CMA / ARV
- ARV (on-the-fly)
- $250,948
- Comps found
- 4
Show comp detail 4 sales within ~0.75 mi
| Address | Dist | Beds/Ba | Sqft | Sold | Price | $/sf | Match |
|---|---|---|---|---|---|---|---|
| 443 E Buckboard Rd | 0.10mi | 3/2.0 | 1,602 (+10%) | 3mo | $275,000 | $172 | 77 |
| 478 Harness Ln | 0.05mi | 3/2.0 | 1,644 (+13%) | 12mo | $275,000 | $167 | 66 |
| 518 Harness Ln | 0.10mi | 3/2.0 | 1,649 (+13%) | 19mo | $275,000 | $167 | 58 |
| 488 Wagon Trl | 0.10mi | 3/2.0 | 1,673 (+15%) | 22mo | $294,000 | $176 | 53 |
Match score weights: distance 35% · size 25% · config 20% · recency 20%. Top-matched comps best support the ARV.
Projected returns pro-forma
-3.0% appreciation · 3.0% rent growth · sell at horizon
- IRR
- 3.2%
- Equity multiple
- 1.12×
- Total profit
- $9,625
- Equity at exit
- $41,451
- IRR
- 12.7%
- Equity multiple
- 2.01×
- Total profit
- $78,676
- Equity at exit
- $24,036
Cash invested: $77,840 (down + closing). Projections, not guarantees.
Landlord ↔ Tenant lean methodology
- Overall (STATE)
- 92 Strongly Landlord-Friendly
- State Arkansas
- 92 Strongly Landlord-Friendly · R+14
- County
- — inherits STATE
- City
- — inherits STATE
ZIP-level market 72774
- Home prices YoY
- -16.0%
- Active inventory
- 74
- Price-to-rent
- 6.9×
Monthly cashflow live
- Estimated rent
- $3,338 medium interval (Pro) →
- Mortgage (P&I)
- −$1,458
- Tax from tax record
- −$196 /mo · $2,355/yr
- Insurance
- −$116
- HOA
- −$8
- Vacancy / Maint / Mgmt
- −$701
- Net cashflow
- $859
Break-even live
UW: 25.0% down · 7.5% · 30yr · 1.5% tax · 5.0% vac · 8.0% maint · 8.0% mgmt
Financing live
Cash to close
- Down payment
- $69,500
- Closing costs
- $8,340
- Reserves months
- —
- Total cash needed
- —
Loan-product check · same deal, 3 products live
Conventional
25% down · 7.5% · 30yr
- Down + closing
- —
- Monthly P&I
- —
- Monthly cashflow
- —
- DSCR
- —
- Eligible?
- —
Personal DTI + credit; lowest rate.
DSCR
20% down · 8.5% · 30yr
- Down + closing
- —
- Monthly P&I
- —
- Monthly cashflow
- —
- DSCR
- —
- Eligible?
- —
No personal income docs; deal must DSCR.
Hard money
10% down · 12.0% · 12mo
- Down + closing
- —
- Monthly P&I
- —
- Monthly cashflow
- —
- DSCR
- —
- Eligible?
- —
Short-term bridge; refi at stabilization.
HOA detail
- Monthly dues
- $8 · $96/yr
Listing history 6 events
-
2026-06-01status $278,000 Pending 3 DOM
-
2026-05-31days on market $278,000 Active 3 DOM
-
2026-05-31days on market $278,000 Active 2 DOM
-
2026-05-27$278,000 Active
-
2020-08-31soldstatus $199,200 132-char remark
Show marketing remark (132 chars)
New construction split floor plan, stainless steel appliances, privacy fence, gutters, mini blinds, 3 bed 2 bath home, 2 car garage.
-
2020-07-24$199,200 132-char remark
Show marketing remark (132 chars)
New construction split floor plan, stainless steel appliances, privacy fence, gutters, mini blinds, 3 bed 2 bath home, 2 car garage.
ⓘ Source: listings_history table (triggers on properties + properties_extension) + one-shot
backfill from property_details.listing_events for pre-trigger history.
Tax reassessment forecast AR · Resets to sale price
- Current annual tax
- $2,355 · $196/mo
- Projected year-2 tax
- $2,355 · $196/mo
- Expected delta
- $0/yr ($0/mo · 0.0%)
ⓘ Screening estimate from a state-policy table — verify with the county assessor before closing.
Climate risk First Street
- Flood 1/10 Low FEMA zone X (unshaded) · 0% chance over 30 yrs
- Wildfire 6/10 Major
- Heat 5/10 Major 8 d/yr ≥104°F today · 23 d/yr by 30 yrs out
- Wind 2/10 Low 3% chance of damaging wind over 30 yrs
- Air quality 2/10 Low 1 unhealthy d/yr today · 1 by 30 yrs out
Nearby sold comps map
Loading sold comps map…
Walkable amenities ~0.75 mi
Loading nearby amenities…
Taxation est. · year 1
- Rental income
- $40,055
- − Mortgage interest
- −$15,572
- − Property taxes
- −$2,355
- − Insurance
- −$1,390
- − Repairs & maintenance
- −$3,204
- − Management
- −$3,204
- − HOA
- −$96
- − Depreciation
- −$8,087
- Taxable income
- $6,145
- Est. tax owed @ 24.0%
- −$1,475
- After-tax cash flow
- $8,833/yr
For passive investors: Depreciation is non-cash, so a rental often shows a tax loss while cash-flowing — sheltering income. Rental losses are passive: they offset passive income freely, and up to $25,000/yr can offset ordinary (W-2) income if you actively participate and your MAGI is under $100k (phasing out to $0 by $150k); unused losses carry forward. On sale, claimed depreciation is recaptured at up to 25%, and gains may owe capital-gains tax (a 1031 exchange can defer both). Figures are a year-1 estimate at your 24.0% rate — not tax advice; consult a CPA.
Schools (NCES district)
- District
- Greenland School District
- NCES district ID
- 0506930
- Math proficiency
- 25% ▼ -12.00%
- Reading proficiency
- 29% ▼ -9.00%
- Median HH income
- $43,761
- Composite
- 23.11/100
- National rank
- #7960
- State rank
- #168 of 238 in AR
Livability — West Fork
- Score
- 66/100
- State rank
- #126
- US rank
- #11748
Category grades
Schools grade is shown separately in the Schools card above.
Census & demographics
- Population (ZIP)
- 7,298
Population outlook (Washington County) Hauer SSP2
- Today (2025)
- 271,748 people
- By 2030
- 296,414 · +9.1%
- By 2040
- 346,874 · +27.6%
- By 2050
- 398,552 · +46.7%
- By 2075
- 523,309 · +92.6%
- By 2100
- 615,280 · +126.4%
Race, ethnicity, and origin ACS 2023
- Neighborhood character
- Predominantly White (73%)
- Race & ethnicity
- White 73% Two or more races 19% Hispanic / Latino 6% Asian 2% Native American 2%
- Hispanic origin (detail)
- Mexican 4%
- Common ancestry
- Slovak 6% Italian 5% Iranian 3%
- Foreign-born
- 4% · China, Canada, South Korea
- Languages at home
- 97% English-only · Spanish 1% Chinese 1%
Political lean MEDSL · Washington
- 2024 margin
- Lean R (+6.7) · D 45.1% · R 51.7% · Other 3.2%
- 2008→2024 swing
- +6.4pp toward D · 2008: -13.1pp · 2024: -6.7pp
- All cycles
- 2024: R+6.7 2020: R+3.9 2016: R+10.4 2012: R+16.3 2008: R+13.1
Not yet ingested
- Civics
- —
Market trends
- HPI YoY
- ▼ -50.93%
- Current HPI
- 267.4622
- Rent YoY
- —
- Metro
- —
- State GDP YoY
- ▲ 3.80%
- F500 in state
- 10
Industry mix (Fortune 500 HQ in AR)
| Industry | F500 HQs | Revenue |
|---|---|---|
| Retail | 1 | $681B |
|
||
| Food / Agriculture | 1 | $53B |
|
||
| Retail / Energy | 1 | $22B |
|
||
| Transportation / Logistics | 1 | $12B |
|
||
| Energy | 1 | $4B |
|
||
Price history
+39.6% since first listed3 events — show timeline
- 2026-05-27 Listed $278,000 NWARMLS
- 2020-08-31 Sold (MLS) $199,200 NWARMLS
- 2020-07-24 Listed $199,200 NWARMLS
Property tax history
+12.8%/yrLatest (2025): $2,355 · +8.3% YoY. Source: county tax records.
Cash-flow waterfall
monthlySold comps — $/sqft
last 12 mo · ≤1 miLoading sold comps…