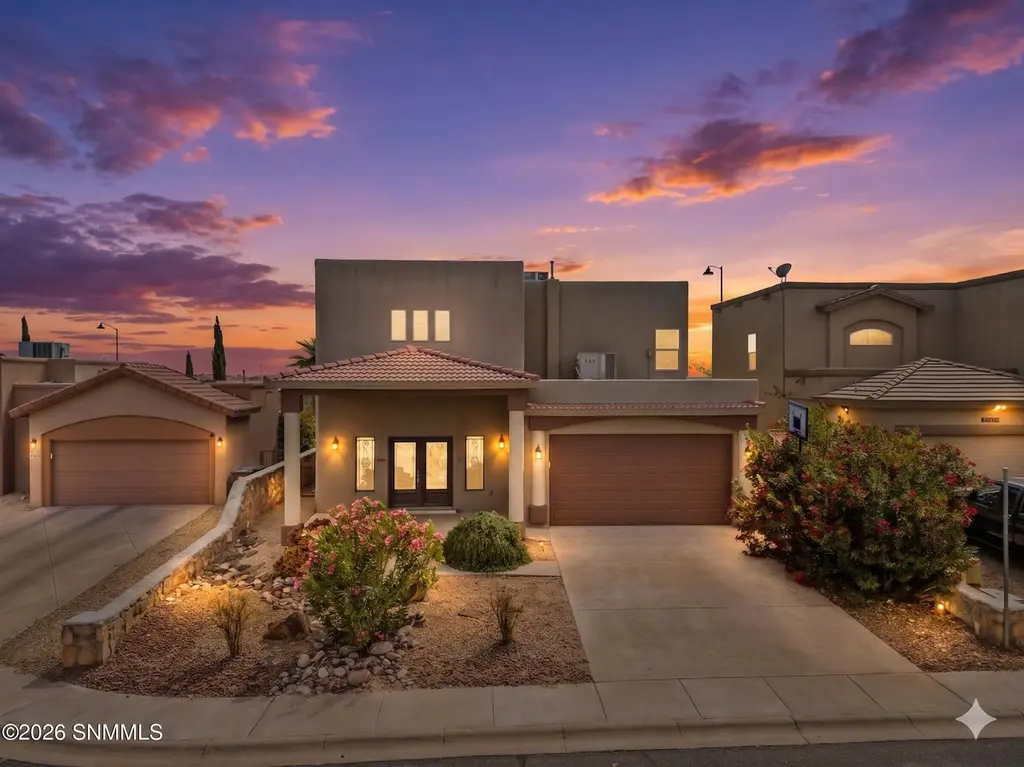
3105 Rio Arriza Loop · Las Cruces, NM
Flood risk 1/10 · Minimal
- FEMA flood zone
- X (unshaded)
- Chance of flooding over 30 yrs
- 0.0%
- Est. flood insurance / yr
- $507 – $1,088
Fire risk 3/10 · Minor
- Est. fire insurance / yr
- $706 – $1,312
Heat risk 6/10 · Moderate
- Hot days now (above 98°F)
- 5 days/yr
- Hot days in 30 yrs
- 18 days/yr
Wind risk 1/10 · Minimal
- Chance of severe wind over 30 yrs
- —
Air-quality risk 1/10 · Minimal
- Unhealthy air days now
- 0 days/yr
- Unhealthy air days in 30 yrs
- 0 days/yr
Risk factors via First Street. Map © Google.
Why this score? — see what drove the D- grade
The composite is a weighted blend of 9 inputs, each scored 0–100. Each bar is that input's sub-score; the figure is the points it added to the 100-point composite (weight × sub-score).
- ARV discount +12.2/15.0
- Cash flow +9.3/30.0
- Schools +4.6/10.0
- Rent growth +3.4/5.0
- Livability +3.0/5.0
- DSCR +2.6/10.0
- Condition / age +2.5/5.0
- 1% rule +2.0/10.0
- Appreciation +0.0/10.0
$349,000
🖨 Deal sheet (PDF) 📄 Offer letter ✓ Due diligence
Listing remarks
ONLY $134/sqft!! Make a statement from the moment you arrive. A grand double panel glass-and-metal front door sets a luxurious tone, welcoming you into a soaring grand entrance that commands attention. The sweeping curved staircase rises elegantly to an upstairs balcony -- the perfect perch to take in breathtaking sunsets and the vast New Mexico sky. Every detail has been thoughtfully curated. The main living area features warm wood floors and a cozy gas fireplace -- the perfect backdrop for evenings in. The main-floor primary suite is a true retreat, complete with a spa-inspired bath offering a double vanity, a spacious shower stall, a soaking garden tub, and two generous closets. Upstairs
Key facts
- Grand entrance
- Curved staircase
- Upstairs balcony
Tags
Property features AI
Exterior
- Parking: 2-car garage
- Utilities: Public water; Public sewer; Natural gas available
- Home design: Single family residence; Two levels
- Construction: Frame and stucco construction; Slab foundation
- Exterior features: Balcony; Covered patio/porch; Back yard fencing; Flat roof; Has a view
Interior
- Kitchen: Dishwasher; Garbage disposal; Gas range; Microwave; Refrigerator
- Bedrooms: Bedrooms with walk-in closet(s)
- Bathrooms: 2 full bathrooms; 1 half bathroom
- Heating & cooling: Central air conditioning; Forced air heating
- Interior features: Eat-in kitchen; Pantry; Walk-in closets; Double-pane windows; Fireplace in living room
- Laundry & utility: Laundry in hall; Gas water heater
Neighborhood map
What this means for you Summary
Snapshot
- This is a 4-bed/3.0-bath single-family listed at $349k.
Deal economics
- At list price, monthly cash flow is $-257 ($-3k/yr) — negative.
- To cash-flow at today's rent, offer at most $304k (13.0% below list).
- To meet the 1% rule (rent ≥ 1% of price), the offer needs to be $245k (29.8% below list).
- Recommended offer: $245k (29.8% below list) — sets the bar for 1% rule.
Location & tenants
- Location reads 59/100 on livability (#120 in NM) — a working-class tenant base; expect higher turnover. Strengths: cost of living A+, housing A; Watch: amenities D+, crime F, commute F.
- Las Cruces Public Schools (urban): math 42% / reading 68% proficiency, ranked #5 of 29 in NM (top 17%) — acceptable for families but not a draw, mixed tenant base, ~2y average lease; 62% free/reduced lunch — lower-income household profile, screen leases tightly.
- Zoned schools: Highland Elementary (744 students, 100% FRL); Camino Real Middle (965 students, 100% FRL); Organ Mountain High School (math 32% / reading 62%, grade D-, #56 of 110 statewide, top 50%, 1,980 students, 0% FRL) — zoned schools at 67% FRL track the district average.
- Market conditions: Rents rising (+3.5%/yr); 598 active listings in the ZIP; 3 comparable units currently listed for rent nearby; rentals lingering (median 46d on market — plan ~5-8 weeks vacancy on turnover, expect pricing pressure); 67% of comp listings sitting > 30 days — soft ceiling on asking rent; 964 units permitted in Doña Ana County in 2024 (0 in 5+ unit buildings).
- This rent runs 43% of the median local income ($69k/yr) — at the standard rent-burdened threshold; future hikes will face affordability resistance.
Forward outlook
- Local home prices are declining (-3.0%/yr); year-one equity from $2k of loan paydown is wiped out by about $10k of value loss. Plan a longer hold.
Negotiation context
- It's been on market 19 days — a 2% lower offer ($344k) is reasonable based on typical stale-listing flexibility.
- 2 sale attempts since 8y ago with the ask held roughly flat each time — persistent listings suggest the price (not the market) is what's stuck; bring a comps-based counter.
Risks & watch-outs
- Climate carrying-cost: extreme-heat days projected 5→18/yr by 2055 (HVAC capex compounding) — expect insurance premiums to compound above CPI over the hold.
Questions for the listing agent
- What do current leases actually rent for vs. the listed asking? Can we see a recent rent roll and the last 12 months of T-12 income?
- Is there a deadline driving the sale (1031 exchange, divorce, estate, relocation)? That informs how much negotiation room exists.
- Schools are D-rated, which usually means shorter tenancies and higher turnover. Who's the typical renter profile here, and what's been the actual vacancy rate?
- Crime grade is F in this area — have there been break-ins, vandalism, or insurance claims at this property in the last 3 years? What carrier currently insures it and at what premium?
- The area grade is low — what's the realistic commute time and amenity access for the typical tenant pool here? Any planned neighborhood developments (good or bad) we should know about?
- What's the average days-on-market for RENTAL listings here right now (not sales)? A rising rental-DOM trend means longer vacancies and softer asking-rent achievability than the comps imply.
- What's the recent tenant-quality profile in this submarket — average credit score on applications, eviction rate, late-payment / NSF rate, and stable-employment percentage? A property-management company in the area should have these aggregated.
- How much new for-sale + rental construction is in the pipeline within 1–3 miles? Heavy new supply typically softens prices + rents 12–24 months out; constrained supply supports both.
Investment metrics
- 1% rule
- 0.70% ✗
- Cap rate
- 5.41%
- Cash-on-cash
- -3.16%
- DSCR
- 0.86
- GRM
- 11.9
CMA / ARV
- ARV (median comp)
- $389,611
- List price
- $349,000
- Delta
- -10.42%
- Verdict
- UNDERPRICED
- Comps
- 1 within 2.0 mi
Projected returns pro-forma
-3.0% appreciation · 3.52% rent growth · sell at horizon
- IRR
- -21.1%
- Equity multiple
- 0.27×
- Total profit
- $-71,753
- Equity at exit
- $52,037
- IRR
- -13.6%
- Equity multiple
- 0.20×
- Total profit
- $-78,643
- Equity at exit
- $30,175
Cash invested: $97,720 (down + closing). Projections, not guarantees.
Landlord ↔ Tenant lean methodology
- Overall (STATE)
- 55 Moderately Landlord-Leaning
- State New Mexico
- 55 Moderately Landlord-Leaning · D+3
- County
- — inherits STATE
- City
- — inherits STATE
ZIP-level market 88012
- Home prices YoY
- -26.2%
- Rents YoY
- 3.5%
- Active inventory
- 598
- Price-to-rent
- 11.9×
Monthly cashflow live
- Estimated rent
- $2,449 medium interval (Pro) →
- Mortgage (P&I)
- −$1,830
- Tax from tax record
- −$217 /mo · $2,598/yr
- Insurance
- −$145
- HOA
- −$0
- Vacancy / Maint / Mgmt
- −$514
- Net cashflow
- $-257
Break-even live
Sensitivity live
| Price | -10% $-60 | -5% $-159 | +0% $-257 | +5% $-356 | +10% $-455 |
|---|---|---|---|---|---|
| Rent | -10% $-451 | -5% $-354 | +0% $-257 | +5% $-161 | +10% $-64 |
| Rate | -1.0pp $-82 | -0.5pp $-169 | base $-257 | +0.5pp $-348 | +1.0pp $-440 |
UW: 25.0% down · 7.5% · 30yr · 1.5% tax · 5.0% vac · 8.0% maint · 8.0% mgmt
Financing live
Cash to close
- Down payment
- $87,250
- Closing costs
- $10,470
- Reserves months
- —
- Total cash needed
- —
Loan-product check · same deal, 3 products live
Conventional
25% down · 7.5% · 30yr
- Down + closing
- —
- Monthly P&I
- —
- Monthly cashflow
- —
- DSCR
- —
- Eligible?
- —
Personal DTI + credit; lowest rate.
DSCR
20% down · 8.5% · 30yr
- Down + closing
- —
- Monthly P&I
- —
- Monthly cashflow
- —
- DSCR
- —
- Eligible?
- —
No personal income docs; deal must DSCR.
Hard money
10% down · 12.0% · 12mo
- Down + closing
- —
- Monthly P&I
- —
- Monthly cashflow
- —
- DSCR
- —
- Eligible?
- —
Short-term bridge; refi at stabilization.
Rent comps 3 comps
| Address | Beds | Baths | Sqft | Rent | $/sqft | DOM | Units | Dist |
|---|---|---|---|---|---|---|---|---|
| 4025 Boardwalk Rd Las Cruces, NM | 4.0 | 2.5 | 2530 | $2,495 | $0.99 | 23d | 1 | 0.38mi |
| 4899 Galina Dr Las Cruces, NM | 5.0 | 3.5 | 3646 | $2,799 | $0.77 | 45d | 1 | 0.42mi |
| 3350 Longview Ln Las Cruces, NM | 3.0 | 2.0 | 2135 | $1,895 | $0.89 | 45d | 1 | 0.45mi |
Listing history 7 events
-
2026-05-09status Pending 993-char remark
-
2026-04-19$349,000 Active 993-char remark
-
2026-01-10price $364,900
-
2025-09-19price $395,000
-
2018-07-16soldstatus
-
2018-07-16soldstatus
-
2018-05-14$249,000
ⓘ Source: listings_history table (triggers on properties + properties_extension) + one-shot
backfill from property_details.listing_events for pre-trigger history.
Tax reassessment forecast NM · Resets to sale price
- Current annual tax
- $2,598 · $217/mo
- Projected year-2 tax
- $2,792 · $233/mo
- Expected delta
- +$194/yr (+$16/mo · 7.5%)
ⓘ Screening estimate from a state-policy table — verify with the county assessor before closing.
Climate risk First Street
- Flood 1/10 Low FEMA zone X (unshaded) · 0% chance over 30 yrs
- Wildfire 3/10 Moderate
- Heat 6/10 Major 5 d/yr ≥98°F today · 18 d/yr by 30 yrs out
- Wind 1/10 Low
- Air quality 1/10 Low 0 unhealthy d/yr today · 0 by 30 yrs out
Nearby sold comps map
Loading sold comps map…
Walkable amenities ~0.75 mi
Loading nearby amenities…
Taxation est. · year 1
- Rental income
- $29,389
- − Mortgage interest
- −$19,549
- − Property taxes
- −$2,598
- − Insurance
- −$1,745
- − Repairs & maintenance
- −$2,351
- − Management
- −$2,351
- − Depreciation
- −$10,153
- Taxable loss
- −$9,358
- Est. tax savings @ 24.0%
- +$2,246
- After-tax cash flow
- $-842/yr
For passive investors: Depreciation is non-cash, so a rental often shows a tax loss while cash-flowing — sheltering income. Rental losses are passive: they offset passive income freely, and up to $25,000/yr can offset ordinary (W-2) income if you actively participate and your MAGI is under $100k (phasing out to $0 by $150k); unused losses carry forward. On sale, claimed depreciation is recaptured at up to 25%, and gains may owe capital-gains tax (a 1031 exchange can defer both). Figures are a year-1 estimate at your 24.0% rate — not tax advice; consult a CPA.
Schools (NCES district)
- District
- Las Cruces Public Schools
- NCES district ID
- 3501500
- Math proficiency
- 42% ▲ 24.00%
- Reading proficiency
- 68% ▲ 35.00%
- Median HH income
- $41,157
- Composite
- 45.98/100
- National rank
- #2535
- State rank
- #5 of 29 in NM
Livability — Las Cruces
- Score
- 59/100
- State rank
- #120
- US rank
- #19687
Category grades
Schools grade is shown separately in the Schools card above.
Census & demographics
- Census place
- Las Cruces, NM
- County
- Dona Ana County · 144,044 people
- City population
- 131,421
- Metro
- Las Cruces, NM
- Population (ZIP)
- 33,158
- Household income
- $69,052
- Rent vs Own
- Severe rent burden
- 717.0
Population outlook (Doña Ana County) Hauer SSP2
- Today (2025)
- 219,177 people
- By 2030
- 220,967 · +0.8%
- By 2040
- 222,775 · +1.6%
- By 2050
- 223,576 · +2.0%
- By 2075
- 228,461 · +4.2%
- By 2100
- 214,536 · -2.1%
Race, ethnicity, and origin ACS 2023
- Neighborhood character
- Majority Hispanic (63%)
- Race & ethnicity
- Hispanic / Latino 63% White 32% Two or more races 25% Native American 2% Black 1% Asian 1%
- Hispanic origin (detail)
- Mexican 55%
- Common ancestry
- Slovak 2% Russian 1% Iranian 1%
- Foreign-born
- 10% · Canada, South Korea
- Languages at home
- 65% English-only · Spanish 33%
Political lean MEDSL · Doña Ana
- 2024 margin
- Lean D (+9.8) · D 53.8% · R 44.0% · Other 2.2%
- 2008→2024 swing
- -7.9pp toward R · 2008: 17.6pp · 2024: 9.8pp
- All cycles
- 2024: D+9.8 2020: D+18.3 2016: D+18.0 2012: D+14.9 2008: D+17.6
Not yet ingested
- Civics
- —
Market trends
- HPI YoY
- ▼ -66.04%
- Current HPI
- 185.7733
- Rent YoY
- ▲ 3.52%
- Metro
- Las Cruces, NM
- State GDP YoY
- —
- F500 in state
- 0
Price history
+40.2% since first listed8 events — show timeline
- 2026-06-09 Sold (MLS) — SNMMLS as distributed by MLS GRID
- 2026-05-09 Pending — SNMMLS as distributed by MLS GRID
- 2026-04-19 Listed $349,000 SNMMLS as distributed by MLS GRID
- 2026-01-10 Price Changed $364,900 SNMMLS as distributed by MLS GRID
- 2025-09-19 Price Changed $395,000 SNMMLS as distributed by MLS GRID
- 2018-07-16 Sold (Public Records) — Public Records
- 2018-07-16 Sold (MLS) — SNMMLS as distributed by MLS GRID
- 2018-05-14 Listed $249,000 SNMMLS as distributed by MLS GRID
Property tax history
+0.7%/yrLatest (2025): $2,598 · -0.6% YoY. Source: county tax records.
Cash-flow waterfall
monthlySold comps — $/sqft
last 12 mo · ≤1 miLoading sold comps…