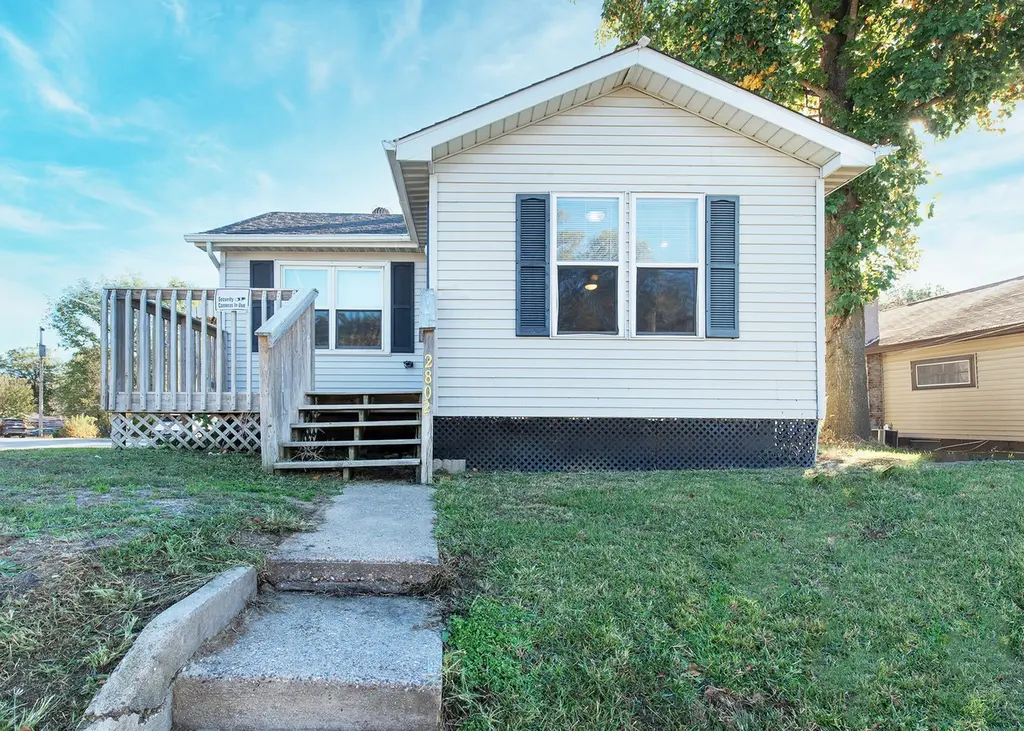
2802 Archer Dr · East Moline, IL
Flood risk 1/10 · Minimal
- FEMA flood zone
- X (unshaded)
- Chance of flooding over 30 yrs
- 0.0%
- Est. flood insurance / yr
- $507 – $1,088
Fire risk 1/10 · Minimal
- Est. fire insurance / yr
- $804 – $1,492
Heat risk 3/10 · Minor
- Hot days now (above 104°F)
- 7 days/yr
- Hot days in 30 yrs
- 16 days/yr
Wind risk 2/10 · Minimal
- Chance of severe wind over 30 yrs
- —
Air-quality risk 3/10 · Minor
- Unhealthy air days now
- 2 days/yr
- Unhealthy air days in 30 yrs
- 3 days/yr
Risk factors via First Street. Map © Google.
Why this score? — see what drove the D- grade
The composite is a weighted blend of 9 inputs, each scored 0–100. Each bar is that input's sub-score; the figure is the points it added to the 100-point composite (weight × sub-score).
- Cash flow +16.2/30.0
- DSCR +5.0/10.0
- 1% rule +4.6/10.0
- ARV discount +4.1/15.0
- Livability +3.1/5.0
- Rent growth +2.5/5.0
- Condition / age +2.5/5.0
- Schools +1.2/10.0
- Appreciation +0.0/10.0
$117,500
🖨 Deal sheet (PDF) 📄 Offer letter ✓ Due diligence
Listing remarks
Situated along a bike path and across from a golf course, this property offers a versatile layout with a heated and cooled workspace located within the attached two-car garage, along with two additional outbuildings for added functionality. The home includes three bedrooms and an updated kitchen and bathroom with newer appliances. The lower-level bedroom does not include an egress window but does provide direct access to the exterior via stairs. * * * This property is part of an estate and is being sold as-is * * * Garage door opener does not currently work
Key facts
- Updated kitchen
- Updated bathroom
- 6,534 sq ft lot
Tags
Property features AI
Finance
- Other: Property not currently leased; Possession at closing; Parcel number available
- Financial info: Homeowner tax exemption
- HOA & community: No master association fee required
Exterior
- Parking: Detached garage accessed off alley; 2 garage spaces (2 total parking spaces)
- Utilities: Public water; Septic tank sewer; Electric with circuit breakers
- Home design: Detached single-family home; One-story design; Fee simple ownership; Built ~61–70 years ago; Assessor-listed living area
- Construction: Vinyl siding with frame construction; Asphalt roof; Block foundation
- Exterior features: Deck; Partial yard fencing; Corner, level lot
Interior
- Kitchen: Range; Gas oven; Microwave; Dishwasher; Refrigerator
- Bedrooms: Master bedroom on main level (12 x 11); Second bedroom on main level (6 x 11); Additional bedroom in basement (12 x 10) — qualifies as possible 3rd bedroom
- Flooring: Laminate flooring in living areas and main-level bedrooms; Vinyl in kitchen; Carpet in basement rooms
- Bathrooms: 1 full bathroom
- Heating & cooling: Forced air heating (natural gas); Central air conditioning
- Interior features: Partially finished basement; Recreation room (basement); Combined dining and living area; 6 total rooms
- Laundry & utility: Laundry on main level; Gas dryer hookup; Laundry closet; Washer; Dryer; Sump pump
Neighborhood map
What this means for you Summary
Snapshot
- This is a 3-bed/1.0-bath single-family listed at $118k.
Deal economics
- At list price, monthly cash flow is $61 ($736/yr) — positive.
- The deal already cash-flows at list — no discount required.
- To meet the 1% rule (rent ≥ 1% of price), the offer needs to be $113k (4.1% below list).
- Recommended offer: $113k (4.1% below list) — sets the bar for 1% rule.
- Cap rate 6.9% vs local median 3.5% in East Moline — top-decile yield for the area; either an underpriced asset or a hidden risk that comps aren't pricing in. Stress-test before assuming the spread holds.
Location & tenants
- Location reads 62/100 on livability (#870 in IL) — a middle-class / working-renter tenant base. Strengths: cost of living A+, housing A+; Watch: crime C-, employment C-, amenities F.
- United Twp Hsd 30 (suburban): math 12% / reading 15% proficiency, ranked #536 of 620 in IL (top 86%) — low school quality limits family demand, transient renter base, plan for 1-2y turnover.
- Zoned schools: United Twp High School (math 12% / reading 15%, grade F, #498 of 693 statewide, top 72%, 1,789 students, 0% FRL).
- Market conditions: 126 active listings in the ZIP; 13 comparable units currently listed for rent nearby; rentals at typical pace (median 23d on market — plan ~3-4 weeks tenant-placement turnaround); 116 units permitted in Rock Island County in 2024 (50 in 5+ unit buildings).
Forward outlook
- Local home prices are declining (-3.0%/yr); year-one equity from $812 of loan paydown is wiped out by about $4k of value loss. Plan a longer hold.
- Rock Island County population projected at -12% by 2050 — secular population decline; favor cash flow + early exit over multi-decade hold.
Negotiation context
- It's been on market 47 days — a 3% lower offer ($114k) is reasonable based on typical stale-listing flexibility.
- 5 sale attempts with the ask held roughly flat each time — persistent listings suggest the price (not the market) is what's stuck; bring a comps-based counter.
Risks & watch-outs
- Watch-outs: built in 1957 — expect roof / HVAC / electrical / plumbing capex.
Questions for the listing agent
- It's been on market 47 days. Have you received any prior offers? Is the seller open to a 4% concession, seller financing, or rate buy-down credit?
- Built in 1957 — when were the roof, HVAC, electrical panel, plumbing, and water heater last replaced?
- Is there a deadline driving the sale (1031 exchange, divorce, estate, relocation)? That informs how much negotiation room exists.
- Schools are F-rated, which usually means shorter tenancies and higher turnover. Who's the typical renter profile here, and what's been the actual vacancy rate?
- The area grade is low — what's the realistic commute time and amenity access for the typical tenant pool here? Any planned neighborhood developments (good or bad) we should know about?
- What's the average days-on-market for RENTAL listings here right now (not sales)? A rising rental-DOM trend means longer vacancies and softer asking-rent achievability than the comps imply.
- What's the recent tenant-quality profile in this submarket — average credit score on applications, eviction rate, late-payment / NSF rate, and stable-employment percentage? A property-management company in the area should have these aggregated.
- How much new for-sale + rental construction is in the pipeline within 1–3 miles? Heavy new supply typically softens prices + rents 12–24 months out; constrained supply supports both.
Investment metrics
- 1% rule
- 0.96% ✗
- Cap rate
- 6.92%
- Cash-on-cash
- 2.24%
- DSCR
- 1.10
- GRM
- 8.7
CMA / ARV
- ARV (on-the-fly)
- $109,296
- Comps found
- 12
Show comp detail 12 sales within ~0.75 mi
| Address | Dist | Beds/Ba | Sqft | Sold | Price | $/sf | Match |
|---|---|---|---|---|---|---|---|
| 1821 27th Ave | 0.27mi | 2/1.0 (-1) | 754 (-5%) | 18mo | $67,320 | $89 | 59 |
| 1116 34th Avenue Ct | 0.43mi | 3/2.0 | 832 (+5%) | 14mo | $192,000 | $231 | 56 |
| 927 35th Ave | 0.52mi | 3/1.0 | 864 (+9%) | 8mo | $119,000 | $138 | 54 |
| 1822 27 1/2 Ave | 0.26mi | 2/1.0 (-1) | 902 (+14%) | 13mo | $53,000 | $59 | 49 |
| 323 15th Ave | 0.74mi | 2/1.0 (-1) | 748 (-6%) | 8mo | $88,000 | $118 | 44 |
| 2817 19th St | 0.34mi | 2/1.0 (-1) | 880 (+11%) | 22mo | $33,500 | $38 | 43 |
| 171 Hero St | 0.73mi | 3/2.0 | 720 (-9%) | 11mo | $126,000 | $175 | 38 |
| 1615 36th Ave | 0.53mi | 2/1.0 (-1) | 870 (+10%) | 19mo | $45,000 | $52 | 38 |
| 516 8th Ave | 0.57mi | 2/1.5 (-1) | 864 (+9%) | 17mo | $120,500 | $139 | 37 |
| 430 14th Ave | 0.75mi | 3/1.0 | 857 (+8%) | 20mo | $125,500 | $146 | 35 |
| 928 35th Ave | 0.54mi | 3/1.0 | 896 (+13%) | 23mo | $135,000 | $151 | 34 |
| 2187 18th St | 0.54mi | 2/2.0 (-1) | 864 (+9%) | 22mo | $117,500 | $136 | 32 |
Match score weights: distance 35% · size 25% · config 20% · recency 20%. Top-matched comps best support the ARV.
Projected returns pro-forma
-3.0% appreciation · 3.0% rent growth · sell at horizon
- IRR
- -12.7%
- Equity multiple
- 0.54×
- Total profit
- $-15,106
- Equity at exit
- $17,520
- IRR
- -3.7%
- Equity multiple
- 0.76×
- Total profit
- $-8,013
- Equity at exit
- $10,159
Cash invested: $32,900 (down + closing). Projections, not guarantees.
Landlord ↔ Tenant lean methodology
- Overall (STATE)
- 43 Moderately Tenant-Leaning
- State Illinois
- 43 Moderately Tenant-Leaning · D+7
- County
- — inherits STATE
- City
- — inherits STATE
ZIP-level market 61244
- Active inventory
- 126
- Price-to-rent
- 8.7×
Monthly cashflow live
- Estimated rent
- $1,127 high interval (Pro) →
- Mortgage (P&I)
- −$616
- Tax from tax record
- −$164 /mo · $1,967/yr
- Insurance
- −$49
- HOA
- −$0
- Vacancy / Maint / Mgmt
- −$237
- Net cashflow
- $61
Break-even live
Sensitivity live
| Price | -10% $128 | -5% $95 | +0% $61 | +5% $28 | +10% $-5 |
|---|---|---|---|---|---|
| Rent | -10% $-28 | -5% $17 | +0% $61 | +5% $106 | +10% $150 |
| Rate | -1.0pp $121 | -0.5pp $91 | base $61 | +0.5pp $31 | +1.0pp $0 |
UW: 25.0% down · 7.5% · 30yr · 1.5% tax · 5.0% vac · 8.0% maint · 8.0% mgmt
Financing live
Cash to close
- Down payment
- $29,375
- Closing costs
- $3,525
- Reserves months
- —
- Total cash needed
- —
Loan-product check · same deal, 3 products live
Conventional
25% down · 7.5% · 30yr
- Down + closing
- —
- Monthly P&I
- —
- Monthly cashflow
- —
- DSCR
- —
- Eligible?
- —
Personal DTI + credit; lowest rate.
DSCR
20% down · 8.5% · 30yr
- Down + closing
- —
- Monthly P&I
- —
- Monthly cashflow
- —
- DSCR
- —
- Eligible?
- —
No personal income docs; deal must DSCR.
Hard money
10% down · 12.0% · 12mo
- Down + closing
- —
- Monthly P&I
- —
- Monthly cashflow
- —
- DSCR
- —
- Eligible?
- —
Short-term bridge; refi at stabilization.
Rent comps 13 comps
| Address | Beds | Baths | Sqft | Rent | $/sqft | DOM | Units | Dist |
|---|---|---|---|---|---|---|---|---|
| 1842 28th Ave East Moline, IL | 2.0 | 1.0 | 914 | $1,100 | $1.20 | 15d | 1 | 0.34mi |
| 625 25th Ave Unit 625 East Moline, IL | 2.0 | 1.0 | 888 | $900 | $1.01 | 23d | 1 | 0.72mi |
| 777 20th Ave Unit 1 East Moline, IL | 2.0 | 1.0 | 1030 | $1,090 | $1.06 | 23d | 1 | 0.79mi |
| 4000 Archer Dr East Moline, IL | 2.0–3.0 | 1.0–1.5 | 933 | $1,499 | $1.61 | 15d | 2 | 0.80mi |
| 123 3rd St Unit House Silvis, IL | 2.0 | 1.0 | 1017 | $1,150 | $1.13 | 23d | 1 | 0.82mi |
| 735 20th Ave Unit 3 East Moline, IL | 2.0 | 1.0 | 690 | $790 | $1.14 | 23d | 1 | 0.83mi |
| 1454 18th St East Moline, IL | 2.0 | 1.5 | 650 | $995 | $1.53 | 23d | 1 | 0.92mi |
| 4102 11th St Unit 1111-2D East Moline, IL | 2.0 | 1.0 | 700 | $820 | $1.17 | 23d | 1 | 0.93mi |
| 4102 11th St Unit 4106-1D R East Moline, IL | 2.0 | 1.0 | 700 | $880 | $1.26 | 23d | 1 | 0.93mi |
| 1111 Avenue Of The Cities Unit 4102-1A R East Moline, IL | 2.0 | 1.0 | 700 | $820 | $1.17 | 23d | 1 | 0.94mi |
| 3341 5th St Unit 1 East Moline, IL | 2.0 | 1.0 | 850 | $1,300 | $1.53 | 23d | 1 | 0.99mi |
| 2101 7th St Silvis, IL | 3.0 | 1.0–2.5 | 905 | $2,010 | $2.22 | 15d | 17 | 1.29mi |
| 1810 14th St Silvis, IL | 3.0 | 1.0 | 1100 | $1,300 | $1.18 | 15d | 1 | 1.43mi |
Listing history 25 events
-
2026-06-17status $117,500 Pending 47 DOM
-
2026-06-17days on market $117,500 Active 47 DOM
-
2026-06-16days on market $117,500 Active 46 DOM
-
2026-06-15days on market $117,500 Active 45 DOM
-
2026-06-14days on market $117,500 Active 43 DOM
-
2026-06-13days on market $117,500 Active 42 DOM
-
2026-06-10days on market $117,500 Active 40 DOM
-
2026-06-09days on market $117,500 Active 39 DOM
-
2026-06-08days on market $117,500 Active 38 DOM
-
2026-06-07days on market $117,500 Active 37 DOM
-
2026-06-02days on market $117,500 Active 32 DOM
-
2026-06-01days on market $117,500 Active 31 DOM
-
2026-05-31days on market $117,500 Active 30 DOM
-
2026-05-30days on market $117,500 Active 29 DOM
-
2026-05-01$117,500 Active
-
2026-05-01historical
-
2026-04-23price
-
2026-03-05status Active
-
2026-02-09status Pending
-
2026-01-20status Active
-
2026-01-14historical
-
2026-01-08status Active
-
2026-01-07historical
-
2026-01-06historical
-
2025-11-21Active
ⓘ Source: listings_history table (triggers on properties + properties_extension) + one-shot
backfill from property_details.listing_events for pre-trigger history.
Tax reassessment forecast IL · Partial reset (capped growth)
- Current annual tax
- $1,967 · $164/mo
- Projected year-2 tax
- $2,317 · $193/mo
- Expected delta
- +$350/yr (+$29/mo · 17.8%)
ⓘ Screening estimate from a state-policy table — verify with the county assessor before closing.
Climate risk First Street
- Flood 1/10 Low FEMA zone X (unshaded) · 0% chance over 30 yrs
- Wildfire 1/10 Low
- Heat 3/10 Moderate 7 d/yr ≥104°F today · 16 d/yr by 30 yrs out
- Wind 2/10 Low
- Air quality 3/10 Moderate 2 unhealthy d/yr today · 3 by 30 yrs out
Nearby sold comps map
Loading sold comps map…
Walkable amenities ~0.75 mi
Loading nearby amenities…
Taxation est. · year 1
- Rental income
- $13,524
- − Mortgage interest
- −$6,582
- − Property taxes
- −$1,967
- − Insurance
- −$588
- − Repairs & maintenance
- −$1,082
- − Management
- −$1,082
- − Depreciation
- −$3,418
- Taxable loss
- −$1,194
- Est. tax savings @ 24.0%
- +$286
- After-tax cash flow
- $1,022/yr
For passive investors: Depreciation is non-cash, so a rental often shows a tax loss while cash-flowing — sheltering income. Rental losses are passive: they offset passive income freely, and up to $25,000/yr can offset ordinary (W-2) income if you actively participate and your MAGI is under $100k (phasing out to $0 by $150k); unused losses carry forward. On sale, claimed depreciation is recaptured at up to 25%, and gains may owe capital-gains tax (a 1031 exchange can defer both). Figures are a year-1 estimate at your 24.0% rate — not tax advice; consult a CPA.
Schools (NCES district)
- District
- United Twp Hsd 30
- NCES district ID
- 1739870
- Math proficiency
- 12% ▼ -5.00%
- Reading proficiency
- 15% ▼ -6.00%
- Median HH income
- $43,647
- Composite
- 11.91/100
- National rank
- #9670
- State rank
- #536 of 620 in IL
Livability — East Moline
- Score
- 62/100
- State rank
- #870
- US rank
- #16964
Category grades
Schools grade is shown separately in the Schools card above.
Census & demographics
- County
- Rock Island County · 103,822 people
- City population
- 23,308
- Metro
- Davenport-Moline-Rock Island, IA-IL
- Population (ZIP)
- 23,308
- Household income
- $63,819
- Rent vs Own
- Severe rent burden
- 746.0
Population outlook (Rock Island County) Hauer SSP2
- Today (2025)
- 140,982 people
- By 2030
- 137,705 · -2.3%
- By 2040
- 130,512 · -7.4%
- By 2050
- 123,841 · -12.2%
- By 2075
- 109,851 · -22.1%
- By 2100
- 90,922 · -35.5%
Race, ethnicity, and origin ACS 2023
- Neighborhood character
- Diverse neighborhood (Simpson 0.62)
- Race & ethnicity
- White 55% Hispanic / Latino 19% Black 18% Two or more races 9% Asian 3%
- Hispanic origin (detail)
- Mexican 17%
- Common ancestry
- English 3% Lithuanian 2% Romanian 2%
- Foreign-born
- 13% · Canada, United Kingdom, Philippines
- Languages at home
- 78% English-only · Spanish 12% French/Haitian/Cajun 3% Other Asian/Pacific 2%
Political lean MEDSL · Rock Island
- 2024 margin
- Lean D (+9.6) · D 53.9% · R 44.4% · Other 1.7%
- 2008→2024 swing
- -15.0pp toward R · 2008: 24.6pp · 2024: 9.6pp
- All cycles
- 2024: D+9.6 2020: D+12.1 2016: D+8.4 2012: D+21.9 2008: D+24.6
Not yet ingested
- Civics
- —
Market trends
- HPI YoY
- ▼ -108.05%
- Current HPI
- 154.4012
- Rent YoY
- —
- Metro
- Davenport-Moline-Rock Island, IA-IL
- State GDP YoY
- ▲ 1.59%
- F500 in state
- 60
Industry mix (Fortune 500 HQ in IL)
| Industry | F500 HQs | Revenue |
|---|---|---|
| Insurance | 4 | $201B |
|
||
| Consumer Goods | 4 | $87B |
|
||
| Industrial Machinery | 3 | $64B |
|
||
| Healthcare | 2 | $55B |
|
||
| Retail / Pharmacy | 1 | $148B |
|
||
| Agriculture / Food | 1 | $86B |
|
||
Price history
11 events — show timeline
- 2026-05-01 Listing Removed — MRED as Distributed by MLS Grid
- 2026-05-01 Listed $117,500 MRED as Distributed by MLS Grid
- 2026-04-23 Price Changed — MRED as Distributed by MLS Grid
- 2026-03-05 Relisted — MRED as Distributed by MLS Grid
- 2026-02-09 Pending — MRED as Distributed by MLS Grid
- 2026-01-20 Relisted — MRED as Distributed by MLS Grid
- 2026-01-14 Listing Removed — MRED as Distributed by MLS Grid
- 2026-01-08 Relisted — MRED as Distributed by MLS Grid
- 2026-01-07 Listing Removed — MRED as Distributed by MLS Grid
- 2026-01-06 Listing Removed — RMLSA as Distributed by MLS Grid
- 2025-11-21 Listed — RMLSA as Distributed by MLS Grid
Property tax history
+2.3%/yrLatest (2024): $1,967 · +7.8% YoY. Source: county tax records.
Cash-flow waterfall
monthlySold comps — $/sqft
last 12 mo · ≤1 miLoading sold comps…