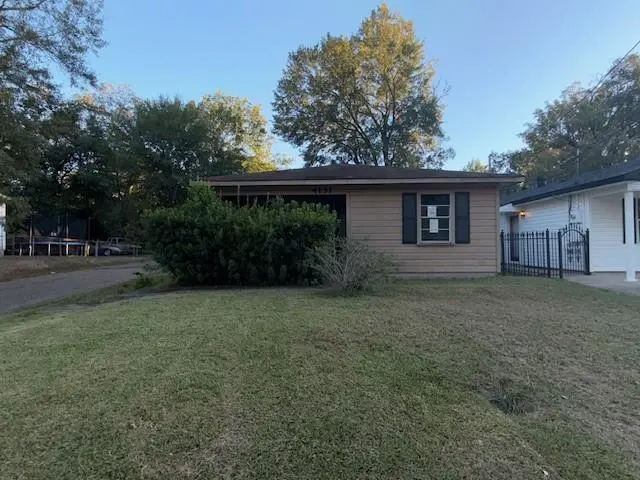
4131 Henry St · Shreveport, LA
Flood risk 1/10 · Minimal
- FEMA flood zone
- X (unshaded)
- Chance of flooding over 30 yrs
- 0.0%
- Est. flood insurance / yr
- $507 – $1,088
Fire risk 1/10 · Minimal
- Est. fire insurance / yr
- $1,269 – $2,357
Heat risk 7/10 · Major
- Hot days now (above 110°F)
- 7 days/yr
- Hot days in 30 yrs
- 22 days/yr
Wind risk 6/10 · Moderate
- Chance of severe wind over 30 yrs
- 68.0%
Air-quality risk 2/10 · Minimal
- Unhealthy air days now
- 1 days/yr
- Unhealthy air days in 30 yrs
- 1 days/yr
Risk factors via First Street. Map © Google.
Why this score? — see what drove the B grade
The composite is a weighted blend of 9 inputs, each scored 0–100. Each bar is that input's sub-score; the figure is the points it added to the 100-point composite (weight × sub-score).
- Cash flow +30.0/30.0
- 1% rule +10.0/10.0
- DSCR +10.0/10.0
- ARV discount +9.9/15.0
- Appreciation +4.4/10.0
- Livability +3.0/5.0
- Rent growth +2.5/5.0
- Condition / age +2.5/5.0
- Schools +2.2/10.0
$42,000
🖨 Deal sheet (PDF) 📄 Offer letter ✓ Due diligence
Listing remarks MLS
Looking for an affordable investment or a place to make your own? This 2-bedroom, 1-bath property is packed with potential and priced to move. A large fenced-in backyard, and a nice-sized storage building, this home offers a solid foundation for the right buyer. Yes, it needs some TLC but with a little vision and effort, this could be a great primary residence, rental, or value-added investment. Priced at just $45,000 Opportunities at this price point don’t come around often and they don’t last long. Bring your ideas, add some love, and unlock the upside. Schedule your tour today before it’s gone.
Key facts
- Central heat
- Storage building
- Fenced-in backyard
Tags
Neighborhood map
What this means for you Summary
Snapshot
- This is a 3-bed/1.0-bath single-family listed at $42k.
Deal economics
- At list price, monthly cash flow is $408 ($5k/yr) — positive.
- The deal already cash-flows at list — no discount required.
- Meets the 1% rule at list price ($866 rent vs $42k).
- Recommended offer: $37k (12.0% below list) — sets the bar for market timing.
- Cap rate 18.0% vs local median 5.6% in Shreveport — top-decile yield for the area; either an underpriced asset or a hidden risk that comps aren't pricing in. Stress-test before assuming the spread holds.
Location & tenants
- Location reads 59/100 on livability (#270 in LA) — a working-class tenant base; expect higher turnover. Strengths: cost of living A+, housing A; Watch: crime F, amenities F, commute F.
- Caddo Parish (urban): math 21% / reading 32% proficiency, ranked #53 of 98 in LA (top 54%) — low school quality limits family demand, transient renter base, plan for 1-2y turnover; 64% free/reduced lunch — lower-income household profile, screen leases tightly.
- Zoned schools: Oak Park Microsociety Elementary School (math 6% / reading 11%, grade F, #616 of 646 statewide, top 96%, 585 students, 90% FRL); Caddo Parish Middle Magnet School (math 79% / reading 93%, grade A+, #1 of 218 statewide, top 0%, 1,003 students, 23% FRL).
- Zoned-school proficiency averages 47% at this address vs 26% district-wide (+21 pts) — the actual schools serving this property are materially stronger than the Caddo Parish average implies; a family-tenant draw the district grade alone would hide.
- Market conditions: 125 active listings in the ZIP; 8 comparable units currently listed for rent nearby; rentals lingering (median 45d on market — plan ~5-8 weeks vacancy on turnover, expect pricing pressure); 62% of comp listings sitting > 30 days — soft ceiling on asking rent; lower-income renter base — watch delinquency; 221 units permitted in Caddo Parish in 2024 (0 in 5+ unit buildings).
- This rent runs 32% of the median local income ($33k/yr) — at the standard rent-burdened threshold; future hikes will face affordability resistance.
Forward outlook
- Local home prices are declining (-1.2%/yr); year-one equity from $290 of loan paydown is wiped out by about $496 of value loss. Plan a longer hold.
- Caddo County population projected at -15% by 2050 — secular population decline; favor cash flow + early exit over multi-decade hold.
- At projected returns (-1.2% appreciation + 3.0% rent growth), your $12k cash investment doubles in ~3 years — after that, you're playing with house money.
Negotiation context
- It's been on market 131 days — a 12% lower offer ($37k) is reasonable based on typical stale-listing flexibility.
Risks & watch-outs
- Climate carrying-cost: major wind risk, 68% chance of damaging wind over 30y; extreme-heat days projected 7→22/yr by 2055 (HVAC capex compounding) — expect insurance premiums to compound above CPI over the hold.
Questions for the listing agent
- It's been on market 131 days. Have you received any prior offers? Is the seller open to a 12% concession, seller financing, or rate buy-down credit?
- Built in 1967 — when were the roof, HVAC, electrical panel, plumbing, and water heater last replaced?
- Why hasn't it sold? Are there any deal-killer items the seller is aware of (foundation, flood, title, zoning, code violations)?
- Is there a deadline driving the sale (1031 exchange, divorce, estate, relocation)? That informs how much negotiation room exists.
- Schools are D-rated, which usually means shorter tenancies and higher turnover. Who's the typical renter profile here, and what's been the actual vacancy rate?
- Crime grade is F in this area — have there been break-ins, vandalism, or insurance claims at this property in the last 3 years? What carrier currently insures it and at what premium?
- What's the average days-on-market for RENTAL listings here right now (not sales)? A rising rental-DOM trend means longer vacancies and softer asking-rent achievability than the comps imply.
- What's the recent tenant-quality profile in this submarket — average credit score on applications, eviction rate, late-payment / NSF rate, and stable-employment percentage? A property-management company in the area should have these aggregated.
- How much new for-sale + rental construction is in the pipeline within 1–3 miles? Heavy new supply typically softens prices + rents 12–24 months out; constrained supply supports both.
Investment metrics
- 1% rule
- 2.06% ✓
- Cap rate
- 17.96%
- Cash-on-cash
- 41.65%
- DSCR
- 2.85
- GRM
- 4.0
CMA / ARV
- ARV (median comp)
- $44,316
- List price
- $42,000
- Delta
- -5.23%
- Verdict
- FAIR
- Comps
- 20 within 1.0 mi
Show comp detail 7 sales within ~0.75 mi
| Address | Dist | Beds/Ba | Sqft | Sold | Price | $/sf | Match |
|---|---|---|---|---|---|---|---|
| 4144 Clover St | 0.03mi | 3/1.0 | 884 (+10%) | 10mo | $11,200 | $13 | 74 |
| 3904 Tate St | 0.42mi | 3/1.0 | 838 (+4%) | 13mo | $10,000 | $12 | 62 |
| 5415 Norton St | 0.33mi | 3/1.0 | 862 (+7%) | 19mo | $36,000 | $42 | 57 |
| 4814 Mcdaniel Dr | 0.74mi | 2/1.0 (-1) | 836 (+4%) | 2mo | $25,000 | $30 | 52 |
| 3938 Mayfield St | 0.74mi | 3/1.0 | 860 (+7%) | 9mo | $8,000 | $9 | 46 |
| 3721 Doris | 0.50mi | 2/1.0 (-1) | 856 (+6%) | 18mo | $45,000 | $53 | 46 |
| 3809 Morrow St | 0.61mi | 3/1.0 | 917 (+14%) | 22mo | $48,750 | $53 | 29 |
Match score weights: distance 35% · size 25% · config 20% · recency 20%. Top-matched comps best support the ARV.
Projected returns pro-forma
-1.18% appreciation · 3.0% rent growth · sell at horizon
- IRR
- 41.0%
- Equity multiple
- 2.91×
- Total profit
- $22,497
- Equity at exit
- $9,774
- IRR
- 45.3%
- Equity multiple
- 5.77×
- Total profit
- $56,153
- Equity at exit
- $9,957
Cash invested: $11,760 (down + closing). Projections, not guarantees.
Landlord ↔ Tenant lean methodology
- Overall (STATE)
- 90 Strongly Landlord-Friendly
- State Louisiana
- 90 Strongly Landlord-Friendly · R+12
- County
- — inherits STATE
- City
- — inherits STATE
ZIP-level market 71109
- Home prices YoY
- -2.1%
- Active inventory
- 125
- Price-to-rent
- 4.0×
Monthly cashflow live
- Estimated rent
- $866 high interval (Pro) →
- Mortgage (P&I)
- −$220
- Tax from tax record
- −$38 /mo · $460/yr
- Insurance
- −$18
- HOA
- −$0
- Vacancy / Maint / Mgmt
- −$182
- Net cashflow
- $408
Break-even live
Sensitivity live
| Price | -10% $432 | -5% $420 | +0% $408 | +5% $396 | +10% $384 |
|---|---|---|---|---|---|
| Rent | -10% $340 | -5% $374 | +0% $408 | +5% $442 | +10% $477 |
| Rate | -1.0pp $429 | -0.5pp $419 | base $408 | +0.5pp $397 | +1.0pp $386 |
UW: 25.0% down · 7.5% · 30yr · 1.5% tax · 5.0% vac · 8.0% maint · 8.0% mgmt
Financing live
Cash to close
- Down payment
- $10,500
- Closing costs
- $1,260
- Reserves months
- —
- Total cash needed
- —
Loan-product check · same deal, 3 products live
Conventional
25% down · 7.5% · 30yr
- Down + closing
- —
- Monthly P&I
- —
- Monthly cashflow
- —
- DSCR
- —
- Eligible?
- —
Personal DTI + credit; lowest rate.
DSCR
20% down · 8.5% · 30yr
- Down + closing
- —
- Monthly P&I
- —
- Monthly cashflow
- —
- DSCR
- —
- Eligible?
- —
No personal income docs; deal must DSCR.
Hard money
10% down · 12.0% · 12mo
- Down + closing
- —
- Monthly P&I
- —
- Monthly cashflow
- —
- DSCR
- —
- Eligible?
- —
Short-term bridge; refi at stabilization.
Rent comps 8 comps
| Address | Beds | Baths | Sqft | Rent | $/sqft | DOM | Units | Dist |
|---|---|---|---|---|---|---|---|---|
| 3530 Pleasant Dr Shreveport, LA | 2.0 | 1.0 | 750 | $725 | $0.97 | 22d | 1 | 0.71mi |
| 4122 Cherokee St Apt 4 Shreveport, LA | 2.0 | 1.0 | 960 | $850 | $0.89 | 45d | 1 | 1.11mi |
| 4122 Cherokee St Apt 4 Shreveport, LA | 2.0 | 1.0 | 750 | $850 | $1.13 | 22d | 1 | 1.11mi |
| 5306 Prentiss Ave Shreveport, LA | 3.0 | 1.0 | 957 | $975 | $1.02 | 45d | 1 | 1.24mi |
| 3902 Sumner St Shreveport, LA | 2.0 | 1.0 | 900 | $700 | $0.78 | 45d | 1 | 1.30mi |
| 3628 Sumner St Shreveport, LA | 3.0 | 1.0 | 956 | $950 | $0.99 | 46d | 1 | 1.39mi |
| 2943 Hillcrest Ave Shreveport, LA | 4.0 | 2.0 | 960 | $1,000 | $1.04 | 22d | 1 | 1.44mi |
| 3051 Amherst St Shreveport, LA | 3.0 | 1.0 | 994 | $595 | $0.60 | 45d | 1 | 1.49mi |
Listing history 9 events
-
2026-06-05days on market $42,000 Active 131 DOM
-
2026-06-03days on market $42,000 Active 130 DOM
-
2026-06-02days on market $42,000 Active 129 DOM
-
2026-06-01days on market $42,000 Active 128 DOM
-
2026-05-31days on market $42,000 Active 127 DOM
-
2026-05-30days on market $42,000 Active 126 DOM
-
2026-03-22price $42,000 636-char remark
Show marketing remark (636 chars)
Looking for an affordable investment or a place to make your own? This 2-bedroom, 1-bath property is packed with potential and priced to move. A large fenced-in backyard, and a nice-sized storage building, this home offers a solid foundation for the right buyer. Yes, it needs some TLC but with a little vision and effort, this could be a great primary residence, rental, or value-added investment. Priced at just $45,000 Opportunities at this price point don’t come around often and they don’t last long. Bring your ideas, add some love, and unlock the upside. Schedule your tour today before it’s gone.
-
2026-01-24$45,000 Active 636-char remark
Show marketing remark (636 chars)
Looking for an affordable investment or a place to make your own? This 2-bedroom, 1-bath property is packed with potential and priced to move. A large fenced-in backyard, and a nice-sized storage building, this home offers a solid foundation for the right buyer. Yes, it needs some TLC but with a little vision and effort, this could be a great primary residence, rental, or value-added investment. Priced at just $45,000 Opportunities at this price point don’t come around often and they don’t last long. Bring your ideas, add some love, and unlock the upside. Schedule your tour today before it’s gone.
-
1980-01-15soldstatus
ⓘ Source: listings_history table (triggers on properties + properties_extension) + one-shot
backfill from property_details.listing_events for pre-trigger history.
Tax reassessment forecast LA · Resets to sale price
- Current annual tax
- $460 · $38/mo
- Projected year-2 tax
- $460 · $38/mo
- Expected delta
- $0/yr ($0/mo · 0.0%)
ⓘ Screening estimate from a state-policy table — verify with the county assessor before closing.
Climate risk First Street
- Flood 1/10 Low FEMA zone X (unshaded) · 0% chance over 30 yrs
- Wildfire 1/10 Low
- Heat 7/10 Severe 7 d/yr ≥110°F today · 22 d/yr by 30 yrs out
- Wind 6/10 Major 68% chance of damaging wind over 30 yrs
- Air quality 2/10 Low 1 unhealthy d/yr today · 1 by 30 yrs out
Nearby sold comps map
Loading sold comps map…
Walkable amenities ~0.75 mi
Loading nearby amenities…
Taxation est. · year 1
- Rental income
- $10,393
- − Mortgage interest
- −$2,353
- − Property taxes
- −$460
- − Insurance
- −$210
- − Repairs & maintenance
- −$831
- − Management
- −$831
- − Depreciation
- −$1,222
- Taxable income
- $4,486
- Est. tax owed @ 24.0%
- −$1,077
- After-tax cash flow
- $3,821/yr
For passive investors: Depreciation is non-cash, so a rental often shows a tax loss while cash-flowing — sheltering income. Rental losses are passive: they offset passive income freely, and up to $25,000/yr can offset ordinary (W-2) income if you actively participate and your MAGI is under $100k (phasing out to $0 by $150k); unused losses carry forward. On sale, claimed depreciation is recaptured at up to 25%, and gains may owe capital-gains tax (a 1031 exchange can defer both). Figures are a year-1 estimate at your 24.0% rate — not tax advice; consult a CPA.
Schools (NCES district)
- District
- Caddo Parish
- NCES district ID
- 2200300
- Math proficiency
- 21% ▼ -33.00%
- Reading proficiency
- 32% ▼ -30.00%
- Median HH income
- $39,227
- Composite
- 22.23/100
- National rank
- #8148
- State rank
- #53 of 98 in LA
Livability — Shreveport
- Score
- 59/100
- State rank
- #270
- US rank
- #19730
Category grades
Schools grade is shown separately in the Schools card above.
Census & demographics
- Census place
- Shreveport, LA
- County
- Caddo Parish · 178,536 people
- City population
- 164,123
- Metro
- Shreveport-Bossier City, LA
- Population (ZIP)
- 17,412
- Household income
- $32,939
- Rent vs Own
- Severe rent burden
- 1265.0
Population outlook (Caddo County) Hauer SSP2
- Today (2025)
- 243,190 people
- By 2030
- 237,231 · -2.5%
- By 2040
- 222,502 · -8.5%
- By 2050
- 206,516 · -15.1%
- By 2075
- 165,706 · -31.9%
- By 2100
- 122,262 · -49.7%
Race, ethnicity, and origin ACS 2023
- Neighborhood character
- Predominantly Black (95%)
- Race & ethnicity
- Black 95% White 4%
- Common ancestry
- Lithuanian 1%
- Foreign-born
- 0%
Political lean MEDSL · Caddo
- 2024 margin
- Toss-up / Even · D 51.6% · R 47.0% · Other 1.4%
- 2008→2024 swing
- +1.6pp toward D · 2008: 3.0pp · 2024: 4.6pp
- All cycles
- 2024: D+4.6 2020: D+6.8 2016: D+4.2 2012: D+4.9 2008: D+3.0
Not yet ingested
- Civics
- —
Market trends
- HPI YoY
- ▼ -1.18%
- Current HPI
- 54.4158
- Rent YoY
- —
- Metro
- Shreveport-Bossier City, LA
- State GDP YoY
- ▲ 3.29%
- F500 in state
- 10
Industry mix (Fortune 500 HQ in LA)
| Industry | F500 HQs | Revenue |
|---|---|---|
| Telecommunications | 2 | $23B |
|
||
| Utilities | 1 | $12B |
|
||
| Wholesale / Distribution | 1 | $5B |
|
||
| Advertising | 1 | $2B |
|
||
Price history
-6.7% since first listed3 events — show timeline
- 2026-03-22 Price Changed $42,000 NTREIS
- 2026-01-24 Listed $45,000 NTREIS
- 1980-01-15 Sold (Public Records) — Public Records
Property tax history
-1.5%/yrLatest (2025): $460 · +0.4% YoY. Source: county tax records.
Cash-flow waterfall
monthlySold comps — $/sqft
last 12 mo · ≤1 miLoading sold comps…