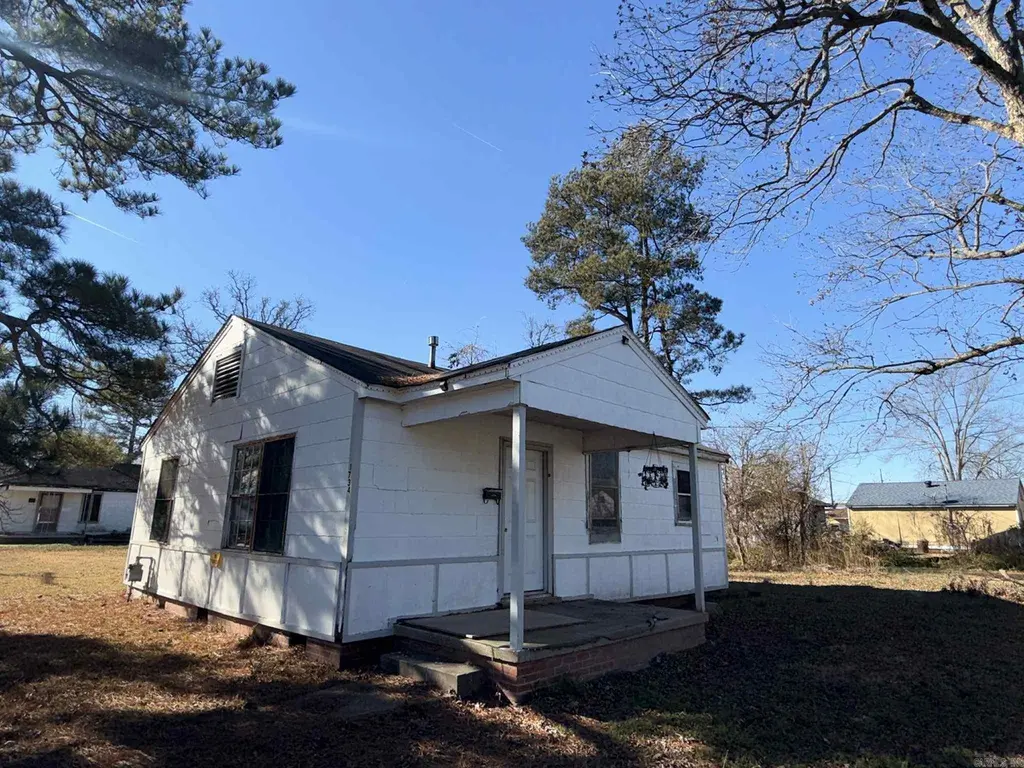
1734 E Circle Dr · Pine Bluff, AR
Flood risk 1/10 · Minimal
- FEMA flood zone
- X (unshaded)
- Chance of flooding over 30 yrs
- 0.0%
- Est. flood insurance / yr
- $507 – $1,088
Fire risk 1/10 · Minimal
- Est. fire insurance / yr
- $1,499 – $2,785
Heat risk 6/10 · Moderate
- Hot days now (above 110°F)
- 7 days/yr
- Hot days in 30 yrs
- 19 days/yr
Wind risk 4/10 · Minor
- Chance of severe wind over 30 yrs
- 20.0%
Air-quality risk 1/10 · Minimal
- Unhealthy air days now
- 0 days/yr
- Unhealthy air days in 30 yrs
- 0 days/yr
Risk factors via First Street. Map © Google.
Why this score? — see what drove the D grade
The composite is a weighted blend of 9 inputs, each scored 0–100. Each bar is that input's sub-score; the figure is the points it added to the 100-point composite (weight × sub-score).
- Cash flow +15.0/30.0
- ARV discount +7.5/15.0
- 1% rule +5.0/10.0
- DSCR +5.0/10.0
- Rent growth +2.5/5.0
- Livability +2.5/5.0
- Condition / age +2.5/5.0
- Schools +0.6/10.0
- Appreciation +0.0/10.0
$14,000
🖨 Deal sheet (PDF) 📄 Offer letter ✓ Due diligence
Listing remarks MLS
2 bedroom 1 bath home offering a great opportunity for investors or buyers seeking a renovation project. Property is in need of extensive repairs and updates throughout. Sold as-is. Owner financing available with acceptable down payment and terms. Ideal for rehab, rental, or value-add investment. Property will be conveyed with a limited warranty deed. AGENTS SEE REMARKS
Key facts
- Built 1944
- Listed 127 days
Neighborhood map
What this means for you Summary
Snapshot
- This is a 2-bed/1.0-bath single-family listed at $14k.
Deal economics
- At list price, monthly cash flow is $531 ($6k/yr) — positive.
- The deal already cash-flows at list — no discount required.
- Meets the 1% rule at list price ($795 rent vs $14k).
- Recommended offer: $12k (12.0% below list) — sets the bar for market timing.
- Cap rate 51.8% vs local median 8.9% in Pine Bluff — top-decile yield for the area; either an underpriced asset or a hidden risk that comps aren't pricing in. Stress-test before assuming the spread holds.
Location & tenants
- Location reads 50/100 on livability (#483 in AR) — a working-class tenant base; expect higher turnover. Strengths: cost of living A+, housing A; Watch: schools F, crime F, amenities F.
- Pine Bluff School District (urban): math 6% / reading 9% proficiency, ranked #236 of 238 in AR (top 99%) — low school quality limits family demand, transient renter base, plan for 1-2y turnover; 85% free/reduced lunch — lower-income household profile, screen leases tightly.
- Market conditions: 211 active listings in the ZIP; 16 comparable units currently listed for rent nearby; rentals lingering (median 45d on market — plan ~5-8 weeks vacancy on turnover, expect pricing pressure); 100% of comp listings sitting > 30 days — soft ceiling on asking rent; 62 units permitted in Jefferson County in 2024 (0 in 5+ unit buildings).
- This rent is only 18% of the median local income ($53k/yr) — well below the 30% rent-burden line; pricing power to push rent on renewal without tenant pushback.
Forward outlook
- Local home prices are declining (-3.0%/yr); year-one equity from $97 of loan paydown is wiped out by about $420 of value loss. Plan a longer hold.
- Jefferson County population projected at -33% by 2050 — secular population decline; favor cash flow + early exit over multi-decade hold.
- At projected returns (-3.0% appreciation + 3.0% rent growth), your $4k cash investment doubles in ~1 year — after that, you're playing with house money.
Negotiation context
- It's been on market 128 days — a 12% lower offer ($12k) is reasonable based on typical stale-listing flexibility.
- 2 sale attempts with the ask held roughly flat each time — persistent listings suggest the price (not the market) is what's stuck; bring a comps-based counter.
Risks & watch-outs
- Watch-outs: built in 1944 — expect roof / HVAC / electrical / plumbing capex.
- Climate carrying-cost: extreme-heat days projected 7→19/yr by 2055 (HVAC capex compounding) — expect insurance premiums to compound above CPI over the hold.
Questions for the listing agent
- It's been on market 128 days. Have you received any prior offers? Is the seller open to a 12% concession, seller financing, or rate buy-down credit?
- Built in 1944 — when were the roof, HVAC, electrical panel, plumbing, and water heater last replaced?
- Why hasn't it sold? Are there any deal-killer items the seller is aware of (foundation, flood, title, zoning, code violations)?
- Is there a deadline driving the sale (1031 exchange, divorce, estate, relocation)? That informs how much negotiation room exists.
- Schools are F-rated, which usually means shorter tenancies and higher turnover. Who's the typical renter profile here, and what's been the actual vacancy rate?
- Crime grade is F in this area — have there been break-ins, vandalism, or insurance claims at this property in the last 3 years? What carrier currently insures it and at what premium?
- The area grade is low — what's the realistic commute time and amenity access for the typical tenant pool here? Any planned neighborhood developments (good or bad) we should know about?
- What's the average days-on-market for RENTAL listings here right now (not sales)? A rising rental-DOM trend means longer vacancies and softer asking-rent achievability than the comps imply.
- What's the recent tenant-quality profile in this submarket — average credit score on applications, eviction rate, late-payment / NSF rate, and stable-employment percentage? A property-management company in the area should have these aggregated.
- How much new for-sale + rental construction is in the pipeline within 1–3 miles? Heavy new supply typically softens prices + rents 12–24 months out; constrained supply supports both.
Investment metrics
- 1% rule
- 5.68% ✓
- Cap rate
- 51.84%
- Cash-on-cash
- 162.66%
- DSCR
- 8.24
- GRM
- 1.5
CMA / ARV
- ARV (median comp)
- $29,777
- List price
- $14,000
- Delta
- -52.98%
- Verdict
- UNDERPRICED
- Comps
- 20 within 1.0 mi
Show comp detail 4 sales within ~0.75 mi
| Address | Dist | Beds/Ba | Sqft | Sold | Price | $/sf | Match |
|---|---|---|---|---|---|---|---|
| 1807 W 27th Ave | 0.59mi | 2/1.0 | 811 (+0%) | 4mo | $24,000 | $30 | 69 |
| 1600 Willow | 0.32mi | 2/1.0 | 896 (+11%) | 21mo | $15,000 | $17 | 50 |
| 2006 W 24th St | 0.39mi | 3/1.0 (+1) | 907 (+12%) | 13mo | $20,000 | $22 | 46 |
| 2405 S Linden St | 0.65mi | 1/1.0 (-1) | 728 (-10%) | 24mo | $33,000 | $45 | 28 |
Match score weights: distance 35% · size 25% · config 20% · recency 20%. Top-matched comps best support the ARV.
Projected returns pro-forma
-3.0% appreciation · 3.0% rent growth · sell at horizon
- IRR
- —
- Equity multiple
- 9.06×
- Total profit
- $31,585
- Equity at exit
- $2,087
- IRR
- —
- Equity multiple
- 19.15×
- Total profit
- $71,130
- Equity at exit
- $1,210
Cash invested: $3,920 (down + closing). Projections, not guarantees.
Landlord ↔ Tenant lean methodology
- Overall (STATE)
- 92 Strongly Landlord-Friendly
- State Arkansas
- 92 Strongly Landlord-Friendly · R+14
- County
- — inherits STATE
- City
- — inherits STATE
ZIP-level market 71603
- Home prices YoY
- -26.0%
- Active inventory
- 211
- Price-to-rent
- 1.5×
Monthly cashflow live
- Estimated rent
- $795 high interval (Pro) →
- Mortgage (P&I)
- −$73
- Tax from tax record
- −$17 /mo · $210/yr
- Insurance
- −$6
- HOA
- −$0
- Vacancy / Maint / Mgmt
- −$167
- Net cashflow
- $531
Break-even live
Sensitivity live
| Price | -10% $539 | -5% $535 | +0% $531 | +5% $527 | +10% $523 |
|---|---|---|---|---|---|
| Rent | -10% $469 | -5% $500 | +0% $531 | +5% $563 | +10% $594 |
| Rate | -1.0pp $538 | -0.5pp $535 | base $531 | +0.5pp $528 | +1.0pp $524 |
UW: 25.0% down · 7.5% · 30yr · 1.5% tax · 5.0% vac · 8.0% maint · 8.0% mgmt
Financing live
Cash to close
- Down payment
- $3,500
- Closing costs
- $420
- Reserves months
- —
- Total cash needed
- —
Loan-product check · same deal, 3 products live
Conventional
25% down · 7.5% · 30yr
- Down + closing
- —
- Monthly P&I
- —
- Monthly cashflow
- —
- DSCR
- —
- Eligible?
- —
Personal DTI + credit; lowest rate.
DSCR
20% down · 8.5% · 30yr
- Down + closing
- —
- Monthly P&I
- —
- Monthly cashflow
- —
- DSCR
- —
- Eligible?
- —
No personal income docs; deal must DSCR.
Hard money
10% down · 12.0% · 12mo
- Down + closing
- —
- Monthly P&I
- —
- Monthly cashflow
- —
- DSCR
- —
- Eligible?
- —
Short-term bridge; refi at stabilization.
Rent comps 16 comps
| Address | Beds | Baths | Sqft | Rent | $/sqft | DOM | Units | Dist |
|---|---|---|---|---|---|---|---|---|
| 1107 S Cypress St Unit 1 Pine Bluff, AR | 2.0 | 1.0 | 875 | $700 | $0.80 | 45d | 1 | 0.47mi |
| 2319 W 27th Ave Unit B Pine Bluff, AR | 2.0 | 1.0 | 907 | $795 | $0.88 | 45d | 1 | 0.61mi |
| 2001 W 28th Ave Pine Bluff, AR | 2.0 | 1.0 | 729 | $750 | $1.03 | 45d | 1 | 0.66mi |
| 1907 W 28th Ave Pine Bluff, AR | 3.0 | 1.5 | 947 | $1,150 | $1.21 | 45d | 1 | 0.66mi |
| 2600 W 30th Ave Unit 2 Pine Bluff, AR | 1.0 | 1.0 | 570 | $650 | $1.14 | 45d | 1 | 0.89mi |
| 2810 S Poplar St Unit 8 Pine Bluff, AR | 1.0 | 1.0 | 1040 | $759 | $0.73 | 45d | 1 | 0.94mi |
| 2600 S Beech St Pine Bluff, AR | 1.0 | 1.0 | 650 | $495 | $0.76 | 45d | 1 | 0.96mi |
| 3109 Daffodil St Pine Bluff, AR | 3.0 | 1.0 | 980 | $825 | $0.84 | 45d | 1 | 0.97mi |
| 501 W 12th Ave Apt 6 Pine Bluff, AR | 2.0 | 1.0 | 773 | $700 | $0.91 | 45d | 1 | 1.00mi |
| 2404 S Walnut St Pine Bluff, AR | 2.0 | 1.0 | 1100 | $700 | $0.64 | 45d | 1 | 1.06mi |
| 3720 Miramar Dr Unit 13 Pine Bluff, AR | 1.0 | 1.0 | 550 | $650 | $1.18 | 45d | 1 | 1.08mi |
| 3008 S Elm St Pine Bluff, AR | 2.0 | 1.0 | 802 | $1,200 | $1.50 | 45d | 1 | 1.09mi |
| 301 W 11th Ave Unit 1 Pine Bluff, AR | 2.0 | 1.0 | 858 | $675 | $0.79 | 45d | 1 | 1.15mi |
| 301 W 33rd Ave Pine Bluff, AR | 2.0 | 1.5 | 871 | $760 | $0.87 | 45d | 1 | 1.45mi |
| 1901 W 40th Ave Pine Bluff, AR | 2.0 | 1.0 | 854 | $765 | $0.90 | 45d | 1 | 1.47mi |
| 6 Duplexes Pine Bluff, AR | 2.0 | 1.5–2.0 | 858 | $772 | $0.90 | 45d | 5 | 1.48mi |
Listing history 15 events
-
2026-06-15days on market $14,000 Active 128 DOM
-
2026-06-14days on market $14,000 Active 126 DOM
-
2026-06-12days on market $14,000 Active 125 DOM
-
2026-06-09days on market $14,000 Active 122 DOM
-
2026-06-08days on market $14,000 Active 121 DOM
-
2026-06-07days on market $14,000 Active 120 DOM
-
2026-06-05days on market $14,000 Active 117 DOM
-
2026-06-03days on market $14,000 Active 116 DOM
-
2026-06-02days on market $14,000 Active 115 DOM
-
2026-06-01days on market $14,000 Active 114 DOM
-
2026-05-31days on market $14,000 Active 113 DOM
-
2026-05-30days on market $14,000 Active 112 DOM
-
2026-04-23status Back on Market 372-char remark
Show marketing remark (372 chars)
2 bedroom 1 bath home offering a great opportunity for investors or buyers seeking a renovation project. Property is in need of extensive repairs and updates throughout. Sold as-is. Owner financing available with acceptable down payment and terms. Ideal for rehab, rental, or value-add investment. Property will be conveyed with a limited warranty deed. AGENTS SEE REMARKS
-
2026-04-01historical 372-char remark
Show marketing remark (372 chars)
2 bedroom 1 bath home offering a great opportunity for investors or buyers seeking a renovation project. Property is in need of extensive repairs and updates throughout. Sold as-is. Owner financing available with acceptable down payment and terms. Ideal for rehab, rental, or value-add investment. Property will be conveyed with a limited warranty deed. AGENTS SEE REMARKS
-
2026-01-14$14,000 New Listing 372-char remark
Show marketing remark (372 chars)
2 bedroom 1 bath home offering a great opportunity for investors or buyers seeking a renovation project. Property is in need of extensive repairs and updates throughout. Sold as-is. Owner financing available with acceptable down payment and terms. Ideal for rehab, rental, or value-add investment. Property will be conveyed with a limited warranty deed. AGENTS SEE REMARKS
ⓘ Source: listings_history table (triggers on properties + properties_extension) + one-shot
backfill from property_details.listing_events for pre-trigger history.
Tax reassessment forecast AR · Resets to sale price
- Current annual tax
- $210 · $17/mo
- Projected year-2 tax
- $210 · $17/mo
- Expected delta
- $0/yr ($0/mo · 0.0%)
ⓘ Screening estimate from a state-policy table — verify with the county assessor before closing.
Climate risk First Street
- Flood 1/10 Low FEMA zone X (unshaded) · 0% chance over 30 yrs
- Wildfire 1/10 Low
- Heat 6/10 Major 7 d/yr ≥110°F today · 19 d/yr by 30 yrs out
- Wind 4/10 Moderate 20% chance of damaging wind over 30 yrs
- Air quality 1/10 Low 0 unhealthy d/yr today · 0 by 30 yrs out
Nearby sold comps map
Loading sold comps map…
Walkable amenities ~0.75 mi
Loading nearby amenities…
Taxation est. · year 1
- Rental income
- $9,541
- − Mortgage interest
- −$784
- − Property taxes
- −$210
- − Insurance
- −$70
- − Repairs & maintenance
- −$763
- − Management
- −$763
- − Depreciation
- −$407
- Taxable income
- $6,543
- Est. tax owed @ 24.0%
- −$1,570
- After-tax cash flow
- $4,806/yr
For passive investors: Depreciation is non-cash, so a rental often shows a tax loss while cash-flowing — sheltering income. Rental losses are passive: they offset passive income freely, and up to $25,000/yr can offset ordinary (W-2) income if you actively participate and your MAGI is under $100k (phasing out to $0 by $150k); unused losses carry forward. On sale, claimed depreciation is recaptured at up to 25%, and gains may owe capital-gains tax (a 1031 exchange can defer both). Figures are a year-1 estimate at your 24.0% rate — not tax advice; consult a CPA.
Schools (NCES district)
- District
- Pine Bluff School District
- NCES district ID
- 0500026
- Math proficiency
- 6% ▼ -9.00%
- Reading proficiency
- 9% ▼ -7.00%
- Median HH income
- $32,374
- Composite
- 5.86/100
- National rank
- #10014
- State rank
- #236 of 238 in AR
Livability — Pine Bluff
- Score
- 50/100
- State rank
- #483
- US rank
- #25645
Category grades
Schools grade is shown separately in the Schools card above.
Census & demographics
- Census place
- Pine Bluff, AR
- County
- Jefferson County · 29,578 people
- City population
- 29,578
- Metro
- Pine Bluff, AR
- Population (ZIP)
- 29,578
- Household income
- $53,130
- Rent vs Own
- Severe rent burden
- 657.0
Population outlook (Jefferson County) Hauer SSP2
- Today (2025)
- 63,110 people
- By 2030
- 58,519 · -7.3%
- By 2040
- 49,740 · -21.2%
- By 2050
- 42,331 · -32.9%
- By 2075
- 29,591 · -53.1%
- By 2100
- 21,047 · -66.7%
Race, ethnicity, and origin ACS 2023
- Neighborhood character
- Majority Black (62%)
- Race & ethnicity
- Black 62% White 33% Two or more races 2% Hispanic / Latino 2%
- Common ancestry
- Italian 2% Slovak 1%
- Foreign-born
- 2% · Canada
- Languages at home
- 98% English-only · Spanish 1%
Political lean MEDSL · Jefferson
- 2024 margin
- Strong D (+20.1) · D 59.2% · R 39.2% · Other 1.6%
- 2008→2024 swing
- -6.2pp toward R · 2008: 26.3pp · 2024: 20.1pp
- All cycles
- 2024: D+20.1 2020: D+21.7 2016: D+25.3 2012: D+29.0 2008: D+26.3
Not yet ingested
- Civics
- —
Market trends
- HPI YoY
- ▼ -72.43%
- Current HPI
- 206.5994
- Rent YoY
- —
- Metro
- Pine Bluff, AR
- State GDP YoY
- ▲ 3.80%
- F500 in state
- 10
Industry mix (Fortune 500 HQ in AR)
| Industry | F500 HQs | Revenue |
|---|---|---|
| Retail | 1 | $681B |
|
||
| Food / Agriculture | 1 | $53B |
|
||
| Retail / Energy | 1 | $22B |
|
||
| Transportation / Logistics | 1 | $12B |
|
||
| Energy | 1 | $4B |
|
||
Price history
3 events — show timeline
- 2026-04-23 Relisted — CARMLS
- 2026-04-01 Listing Removed — CARMLS
- 2026-01-14 Listed $14,000 CARMLS
Property tax history
+2.2%/yrLatest (2025): $210 · +8.3% YoY. Source: county tax records.
Cash-flow waterfall
monthlySold comps — $/sqft
last 12 mo · ≤1 miLoading sold comps…