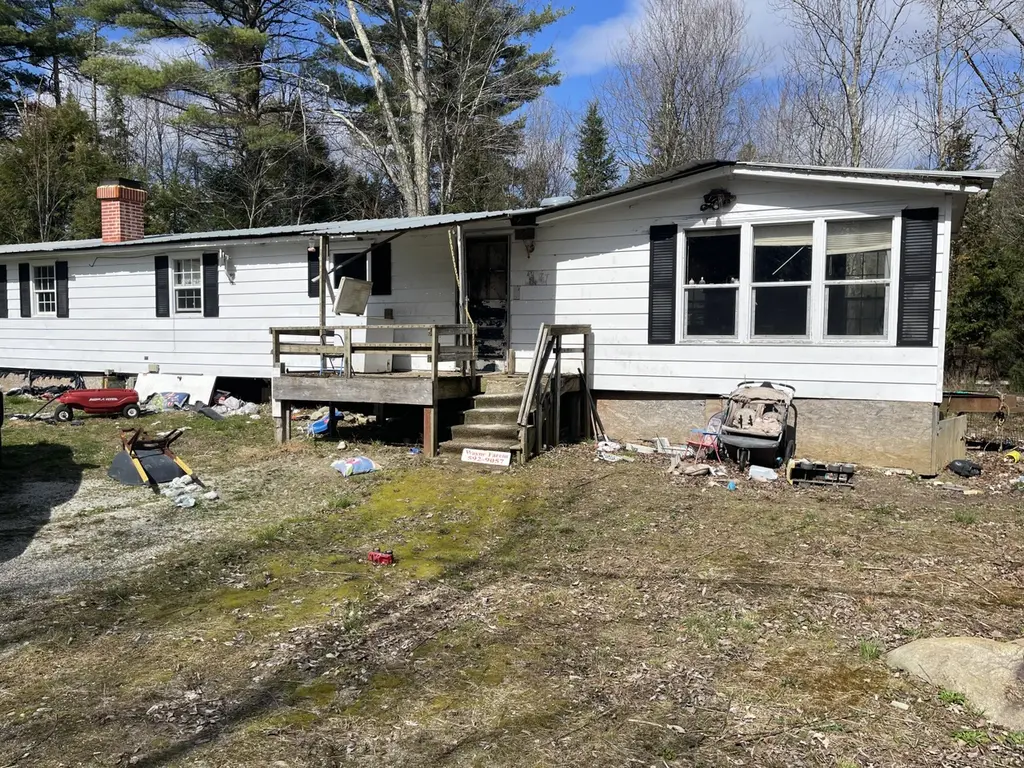
421 Washington Rd · Jefferson, ME
Flood risk 1/10 · Minimal
- FEMA flood zone
- X (unshaded)
- Chance of flooding over 30 yrs
- 0.0%
- Est. flood insurance / yr
- $473 – $860
Fire risk 3/10 · Minor
- Est. fire insurance / yr
- $669 – $1,243
Heat risk 3/10 · Minor
- Hot days now (above 89°F)
- 7 days/yr
- Hot days in 30 yrs
- 16 days/yr
Wind risk 5/10 · Moderate
- Chance of severe wind over 30 yrs
- 26.0%
Air-quality risk 1/10 · Minimal
- Unhealthy air days now
- 0 days/yr
- Unhealthy air days in 30 yrs
- 0 days/yr
Risk factors via First Street. Map © Google.
Why this score? — see what drove the B grade
The composite is a weighted blend of 9 inputs, each scored 0–100. Each bar is that input's sub-score; the figure is the points it added to the 100-point composite (weight × sub-score).
- Cash flow +27.3/30.0
- DSCR +9.5/10.0
- 1% rule +9.3/10.0
- ARV discount +7.5/15.0
- Appreciation +5.6/10.0
- Schools +4.3/10.0
- Rent growth +2.5/5.0
- Livability +2.5/5.0
- Condition / age +2.5/5.0
$75,000
🖨 Deal sheet (PDF) 📄 Offer letter ✓ Due diligence
Listing remarks
Nice level 2 acre site with an older single wide home set on a side gravel road that leads to one other neighbor. Has frontage on Washington road also. Home in need of renovations. Affordable start with drilled well and septic system to renovate or build a new place. Or bring in a new mobile home for nice country living.
Key facts
- 2.08 acre lot
- Parking
- Built 1985
Property features AI
Exterior
- Parking: Gravel parking with 1–4 spaces
- Utilities: Electric service with circuit breakers; Private water; Private sewer; Electric water heater
- Home design: Mobile Home (single-wide); Built in 1985
- Construction: Vinyl siding; Shingle roof
- Exterior features: Level, wooded, rural lot; Private road frontage; Paved road access
Interior
- Kitchen: Kitchen on the first floor
- Bedrooms: Primary bedroom on the first floor; Second bedroom on the first floor
- Flooring: Vinyl flooring; Carpet
- Bathrooms: 1 full bathroom
- Heating & cooling: Forced air heating
- Interior features: First-floor bedroom; Total of 5 rooms
- Laundry & utility: Main-level / first-floor laundry
Neighborhood map
What this means for you Summary
Snapshot
- This is a 2-bed/1.0-bath other listed at $75k.
Deal economics
- At list price, monthly cash flow is $217 ($3k/yr) — positive.
- The deal already cash-flows at list — no discount required.
- Meets the 1% rule at list price ($1k rent vs $75k).
- Recommended offer: $73k (3.0% below list) — sets the bar for market timing.
Location & tenants
- Location reads: area grade B — affects rentability + tenant quality, not the cash-flow math above.
- Jefferson Public Schools (rural): math 35% / reading 60% proficiency, ranked #65 of 185 in ME (top 35%) — families likely to look elsewhere, expect single-tenant / working-renter base with shorter leases.
- Market conditions: 41 active listings in the ZIP; 158 units permitted in Lincoln County in 2024 (0 in 5+ unit buildings).
Forward outlook
- In year one you build about $1k of equity ($519 loan paydown + $884 appreciation (1.2% local appreciation)).
- Lincoln County population projected at -18% by 2050 — secular population decline; favor cash flow + early exit over multi-decade hold.
- At projected returns (1.2% appreciation + 3.0% rent growth), your $21k cash investment doubles in ~5 years — after that, you're playing with house money.
Negotiation context
- It's been on market 46 days — a 3% lower offer ($73k) is reasonable based on typical stale-listing flexibility.
- 4 sale attempts since 22y ago with the ask held roughly flat each time — persistent listings suggest the price (not the market) is what's stuck; bring a comps-based counter.
Risks & watch-outs
- Watch-outs: property tax is 3.3% of price.
- Climate carrying-cost: moderate wind risk, 26% chance of damaging wind over 30y — expect insurance premiums to compound above CPI over the hold.
Questions for the listing agent
- It's been on market 46 days. Have you received any prior offers? Is the seller open to a 3% concession, seller financing, or rate buy-down credit?
- Property tax is high relative to price — has the assessment been appealed recently, and will the sale trigger a re-assessment?
- Is there a deadline driving the sale (1031 exchange, divorce, estate, relocation)? That informs how much negotiation room exists.
- What's the average days-on-market for RENTAL listings here right now (not sales)? A rising rental-DOM trend means longer vacancies and softer asking-rent achievability than the comps imply.
- What's the recent tenant-quality profile in this submarket — average credit score on applications, eviction rate, late-payment / NSF rate, and stable-employment percentage? A property-management company in the area should have these aggregated.
- How much new for-sale + rental construction is in the pipeline within 1–3 miles? Heavy new supply typically softens prices + rents 12–24 months out; constrained supply supports both.
Investment metrics
- 1% rule
- 1.43% ✓
- Cap rate
- 9.76%
- Cash-on-cash
- 12.40%
- DSCR
- 1.55
- GRM
- 5.8
CMA / ARV
No comps found within radius.
Projected returns pro-forma
1.18% appreciation · 3.0% rent growth · sell at horizon
- IRR
- 14.8%
- Equity multiple
- 1.76×
- Total profit
- $15,961
- Equity at exit
- $26,301
- IRR
- 18.1%
- Equity multiple
- 3.24×
- Total profit
- $46,936
- Equity at exit
- $35,498
Cash invested: $21,000 (down + closing). Projections, not guarantees.
Landlord ↔ Tenant lean methodology
- Overall (STATE)
- 41 Moderately Tenant-Leaning
- State Maine
- 41 Moderately Tenant-Leaning · D+2
- County
- — inherits STATE
- City
- — inherits STATE
ZIP-level market 04348
- Home prices YoY
- 0.5%
- Active inventory
- 41
- Price-to-rent
- 5.8×
Monthly cashflow live
- Estimated rent
- $1,074 medium interval (Pro) →
- Mortgage (P&I)
- −$393
- Tax from tax record
- −$207 /mo · $2,487/yr
- Insurance
- −$31
- HOA
- −$0
- Vacancy / Maint / Mgmt
- −$226
- Net cashflow
- $217
Break-even live
Sensitivity live
| Price | -10% $259 | -5% $238 | +0% $217 | +5% $196 | +10% $174 |
|---|---|---|---|---|---|
| Rent | -10% $132 | -5% $174 | +0% $217 | +5% $259 | +10% $302 |
| Rate | -1.0pp $255 | -0.5pp $236 | base $217 | +0.5pp $198 | +1.0pp $178 |
UW: 25.0% down · 7.5% · 30yr · 1.5% tax · 5.0% vac · 8.0% maint · 8.0% mgmt
Financing live
Cash to close
- Down payment
- $18,750
- Closing costs
- $2,250
- Reserves months
- —
- Total cash needed
- —
Loan-product check · same deal, 3 products live
Conventional
25% down · 7.5% · 30yr
- Down + closing
- —
- Monthly P&I
- —
- Monthly cashflow
- —
- DSCR
- —
- Eligible?
- —
Personal DTI + credit; lowest rate.
DSCR
20% down · 8.5% · 30yr
- Down + closing
- —
- Monthly P&I
- —
- Monthly cashflow
- —
- DSCR
- —
- Eligible?
- —
No personal income docs; deal must DSCR.
Hard money
10% down · 12.0% · 12mo
- Down + closing
- —
- Monthly P&I
- —
- Monthly cashflow
- —
- DSCR
- —
- Eligible?
- —
Short-term bridge; refi at stabilization.
Listing history 22 events
-
2026-06-21days on market $75,000 Active 46 DOM
-
2026-06-18days on market $75,000 Active 44 DOM
-
2026-06-17days on market $75,000 Active 43 DOM
-
2026-06-16days on market $75,000 Active 42 DOM
-
2026-06-15days on market $75,000 Active 41 DOM
-
2026-06-13days on market $75,000 Active 39 DOM
-
2026-06-12days on market $75,000 Active 38 DOM
-
2026-06-09days on market $75,000 Active 35 DOM
-
2026-06-08days on market $75,000 Active 34 DOM
-
2026-06-07days on market $75,000 Active 33 DOM
-
2026-06-05days on market $75,000 Active 31 DOM
-
2026-06-04days on market $75,000 Active 29 DOM
-
2026-06-02days on market $75,000 Active 28 DOM
-
2026-06-01days on market $75,000 Active 27 DOM
-
2026-05-31days on market $75,000 Active 26 DOM
-
2026-05-31days on market $75,000 Active 25 DOM
-
2026-05-05$75,000 Active
-
2017-03-08historical
-
2016-09-15price $130,000
-
2016-03-15$145,000 Active
-
2005-05-29$119,900
-
2004-09-20$135,000
ⓘ Source: listings_history table (triggers on properties + properties_extension) + one-shot
backfill from property_details.listing_events for pre-trigger history.
Tax reassessment forecast ME · Partial reset (capped growth)
- Current annual tax
- $2,487 · $207/mo
- Projected year-2 tax
- $2,487 · $207/mo
- Expected delta
- $0/yr ($0/mo · 0.0%)
ⓘ Screening estimate from a state-policy table — verify with the county assessor before closing.
Climate risk First Street
- Flood 1/10 Low FEMA zone X (unshaded) · 0% chance over 30 yrs
- Wildfire 3/10 Moderate
- Heat 3/10 Moderate 7 d/yr ≥89°F today · 16 d/yr by 30 yrs out
- Wind 5/10 Major 26% chance of damaging wind over 30 yrs
- Air quality 1/10 Low 0 unhealthy d/yr today · 0 by 30 yrs out
Nearby sold comps map
Loading sold comps map…
Walkable amenities ~0.75 mi
Loading nearby amenities…
Taxation est. · year 1
- Rental income
- $12,892
- − Mortgage interest
- −$4,201
- − Property taxes
- −$2,487
- − Insurance
- −$375
- − Repairs & maintenance
- −$1,031
- − Management
- −$1,031
- − Depreciation
- −$2,182
- Taxable income
- $1,585
- Est. tax owed @ 24.0%
- −$380
- After-tax cash flow
- $2,223/yr
For passive investors: Depreciation is non-cash, so a rental often shows a tax loss while cash-flowing — sheltering income. Rental losses are passive: they offset passive income freely, and up to $25,000/yr can offset ordinary (W-2) income if you actively participate and your MAGI is under $100k (phasing out to $0 by $150k); unused losses carry forward. On sale, claimed depreciation is recaptured at up to 25%, and gains may owe capital-gains tax (a 1031 exchange can defer both). Figures are a year-1 estimate at your 24.0% rate — not tax advice; consult a CPA.
Schools (NCES district)
- District
- Jefferson Public Schools
- NCES district ID
- 2306870
- Math proficiency
- 35% ▲ 5.00%
- Reading proficiency
- 60% ▲ 10.00%
- Median HH income
- $53,111
- Composite
- 43.08/100
- National rank
- #6631
- State rank
- #65 of 185 in ME
Livability — Jefferson
No livability data for this city. (Only ~50 U.S. cities are tracked.)
Census & demographics
- Population (ZIP)
- 3,497
Population outlook (Lincoln County) Hauer SSP2
- Today (2025)
- 33,059 people
- By 2030
- 32,050 · -3.1%
- By 2040
- 29,490 · -10.8%
- By 2050
- 27,201 · -17.7%
- By 2075
- 24,598 · -25.6%
- By 2100
- 21,989 · -33.5%
Race, ethnicity, and origin ACS 2023
- Neighborhood character
- Predominantly White (92%)
- Race & ethnicity
- White 92% Two or more races 6% Hispanic / Latino 2% Black 1%
- Common ancestry
- Slovak 11% Lithuanian 9% Italian 3%
- Foreign-born
- 2% · Canada
- Languages at home
- 97% English-only · French/Haitian/Cajun 2% Spanish 1%
Political lean MEDSL · Lincoln
- 2024 margin
- D (+11.2) · D 54.6% · R 43.4% · Other 2.0%
- 2008→2024 swing
- -0.8pp no change · 2008: 12.0pp · 2024: 11.2pp
- All cycles
- 2024: D+11.2 2020: D+10.3 2016: D+2.4 2012: D+11.7 2008: D+12.0
Not yet ingested
- Civics
- —
Market trends
- HPI YoY
- ▲ 1.18%
- Current HPI
- 262.1476
- Rent YoY
- —
- Metro
- —
- State GDP YoY
- —
- F500 in state
- 0
Price history
-44.4% since first listed6 events — show timeline
- 2026-05-05 Listed $75,000 MREIS
- 2017-03-08 Delisted — MREIS
- 2016-09-15 Price Changed $130,000 MREIS
- 2016-03-15 Listed $145,000 MREIS
- 2005-05-29 Listed $119,900 MREIS
- 2004-09-20 Listed $135,000 MREIS
Property tax history
+3.2%/yrLatest (2025): $2,487 · +21.8% YoY. Source: county tax records.
Cash-flow waterfall
monthlySold comps — $/sqft
last 12 mo · ≤1 miLoading sold comps…