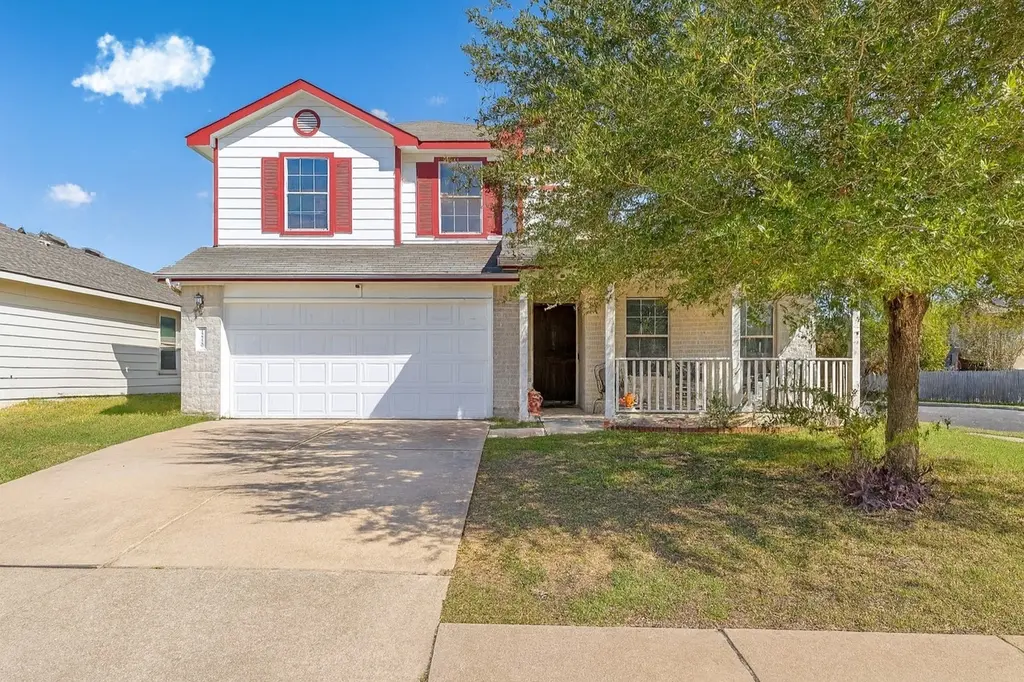
12720 Sky Harbor Dr · Austin, TX
Flood risk 1/10 · Minimal
- FEMA flood zone
- X (unshaded)
- Chance of flooding over 30 yrs
- 0.0%
- Est. flood insurance / yr
- $507 – $1,088
Fire risk 5/10 · Moderate
- Est. fire insurance / yr
- $1,222 – $2,270
Heat risk 8/10 · Major
- Hot days now (above 108°F)
- 7 days/yr
- Hot days in 30 yrs
- 24 days/yr
Wind risk 8/10 · Major
- Chance of severe wind over 30 yrs
- 80.0%
Air-quality risk 1/10 · Minimal
- Unhealthy air days now
- 0 days/yr
- Unhealthy air days in 30 yrs
- 0 days/yr
Risk factors via First Street. Map © Google.
Why this score? — see what drove the D- grade
The composite is a weighted blend of 9 inputs, each scored 0–100. Each bar is that input's sub-score; the figure is the points it added to the 100-point composite (weight × sub-score).
- ARV discount +14.6/15.0
- Cash flow +6.3/30.0
- Livability +4.1/5.0
- Appreciation +3.4/10.0
- 1% rule +3.0/10.0
- Condition / age +2.5/5.0
- Rent growth +2.4/5.0
- Schools +1.9/10.0
- DSCR +0.6/10.0
$280,000
🖨 Deal sheet (PDF) 📄 Offer letter ✓ Due diligence
Listing remarks MLS
Corner Lot | Steps from the Greenbelt | Primary on Main | Upstairs Loft! Positioned just steps from the Dry Creek Greenbelt, 12720 Sky Harbor offers a spacious two-story layout with multiple living areas, a first-floor primary suite, and abundant room to grow. The nearby greenbelt provides a peaceful buffer of open space, natural scenery, and walking areas, giving the home a sense of openness rarely found in this price point. Inside, the main level features a welcoming foyer, two living spaces, and a centrally located kitchen complete with a breakfast nook and formal dining area. The primary bedroom suite is conveniently located on the first floor, providing privacy and ease of access. Upstairs, you'll find a bright and open loft ideal for a game room, office, or second living room, along with three generously sized bedrooms and a full bath. The home offers comfort and functionality throughout. Situated on a corner lot in a desirable Austin location, this property offers strong long-term appeal with a layout that adapts easily to a variety of lifestyles, including work-from-home, multi-generational living, or future value-add enhancements. Its solid structure and flexible design make it an excellent opportunity for buyers seeking a home they can personalize while benefiting from the area’s steady growth and investment potential. Bring your vision and discover the possibilities.
Key facts
- Breakfast nook
- Bright and open loft
- Formal dining area
Tags
Neighborhood map
What this means for you Summary
Snapshot
- This is a 4-bed/3.0-bath single-family listed at $280k.
Deal economics
- At list price, monthly cash flow is $-503 ($-6k/yr) — negative.
- To cash-flow at today's rent, offer at most $191k (31.7% below list).
- To meet the 1% rule (rent ≥ 1% of price), the offer needs to be $224k (20.1% below list).
- Recommended offer: $191k (31.7% below list) — sets the bar for cash-flow.
- Cap rate 4.1% vs local median 1.8% in Austin — top-decile yield for the area; either an underpriced asset or a hidden risk that comps aren't pricing in. Stress-test before assuming the spread holds.
Location & tenants
- Location reads 82/100 on livability (#16 in TX, #1,208 nationally) — a professional / high-income tenant draw. Strengths: amenities A+, commute A+, employment A+; Watch: cost of living D, crime F.
- Del Valle ISD (rural): math 19% / reading 26% proficiency, ranked #749 of 826 in TX (top 91%) — low school quality limits family demand, transient renter base, plan for 1-2y turnover; 77% free/reduced lunch — lower-income household profile, screen leases tightly.
- Zoned schools: Del Valle El (math 22% / reading 22%, grade F, #3,333 of 4,322 statewide, top 80%, 615 students, 89% FRL); Del Valle H S (math 17% / reading 28%, grade F, #1,354 of 1,632 statewide, top 83%, 3,460 students, 90% FRL).
- Market conditions: Rents soft (-0.4%/yr); 251 active listings in the ZIP; 19 comparable units currently listed for rent nearby; rentals at typical pace (median 26d on market — plan ~3-4 weeks tenant-placement turnaround); 47% of comp listings sitting > 30 days — soft ceiling on asking rent; 17,121 units permitted in Travis County in 2024 (11,963 in 5+ unit buildings).
- This rent runs 37% of the median local income ($72k/yr) — at the standard rent-burdened threshold; future hikes will face affordability resistance.
Forward outlook
- Local home prices are declining (-3.0%/yr); year-one equity from $2k of loan paydown is wiped out by about $8k of value loss. Plan a longer hold.
- Travis County population projected at +60% by 2050 — long-run rental-demand tailwind backs the buy-and-hold thesis.
Negotiation context
- It's been on market 198 days — a 12% lower offer ($246k) is reasonable based on typical stale-listing flexibility.
Risks & watch-outs
- Watch-outs: property tax is 2.8% of price.
- Climate carrying-cost: severe wind risk, 80% chance of damaging wind over 30y; moderate wildfire risk; extreme-heat days projected 7→24/yr by 2055 (HVAC capex compounding) — expect insurance premiums to compound above CPI over the hold.
Questions for the listing agent
- What do current leases actually rent for vs. the listed asking? Can we see a recent rent roll and the last 12 months of T-12 income?
- It's been on market 198 days. Have you received any prior offers? Is the seller open to a 32% concession, seller financing, or rate buy-down credit?
- Property tax is high relative to price — has the assessment been appealed recently, and will the sale trigger a re-assessment?
- What does the HOA fee cover, when was the last increase, and are there any pending special assessments or reserve-fund shortfalls?
- Why hasn't it sold? Are there any deal-killer items the seller is aware of (foundation, flood, title, zoning, code violations)?
- Is there a deadline driving the sale (1031 exchange, divorce, estate, relocation)? That informs how much negotiation room exists.
- Crime grade is F in this area — have there been break-ins, vandalism, or insurance claims at this property in the last 3 years? What carrier currently insures it and at what premium?
- The area grade is low — what's the realistic commute time and amenity access for the typical tenant pool here? Any planned neighborhood developments (good or bad) we should know about?
- What's the average days-on-market for RENTAL listings here right now (not sales)? A rising rental-DOM trend means longer vacancies and softer asking-rent achievability than the comps imply.
- What's the recent tenant-quality profile in this submarket — average credit score on applications, eviction rate, late-payment / NSF rate, and stable-employment percentage? A property-management company in the area should have these aggregated.
- How much new for-sale + rental construction is in the pipeline within 1–3 miles? Heavy new supply typically softens prices + rents 12–24 months out; constrained supply supports both.
Investment metrics
- 1% rule
- 0.80% ✗
- Cap rate
- 4.14%
- Cash-on-cash
- -7.70%
- DSCR
- 0.66
- GRM
- 10.4
CMA / ARV
- ARV (median comp)
- $332,804
- List price
- $280,000
- Delta
- -15.87%
- Verdict
- UNDERPRICED
- Comps
- 20 within 1.0 mi
Show comp detail 11 sales within ~0.75 mi
| Address | Dist | Beds/Ba | Sqft | Sold | Price | $/sf | Match |
|---|---|---|---|---|---|---|---|
| 6512 Wagon Spring St | 0.70mi | 4/2.5 | 2,494 (-5%) | 1mo | $365,000 | $146 | 56 |
| 12408 Hayseed Ct | 0.45mi | 3/2.5 (-1) | 2,497 (-5%) | 12mo | $360,000 | $144 | 54 |
| 6409 Albany Sleigh Dr | 0.55mi | 3/2.5 (-1) | 2,497 (-5%) | 9mo | $325,000 | $130 | 51 |
| 5400 Fryman Hill Dr | 0.70mi | 4/2.5 | 2,652 (+1%) | 16mo | $349,900 | $132 | 50 |
| 12312 Ferrystone Glen Dr | 0.68mi | 4/2.5 | 2,633 (0%) | 20mo | $400,000 | $152 | 50 |
| 12001 Foley Dr | 0.63mi | 4/2.0 | 2,369 (-10%) | 11mo | $865,000 | $365 | 41 |
| 6312 Conestoga Wagon Way | 0.56mi | 3/2.5 (-1) | 2,497 (-5%) | 23mo | $362,500 | $145 | 39 |
| 12109 Plow Handle Dr | 0.71mi | 3/2.5 (-1) | 2,305 (-12%) | 7mo | $315,000 | $137 | 33 |
| 6505 Wagon Spring St | 0.67mi | 3/2.5 (-1) | 2,305 (-12%) | 11mo | $350,000 | $152 | 32 |
| 12909 Sexson Ridge Cv | 0.65mi | 3/2.5 (-1) | 2,351 (-11%) | 24mo | $325,000 | $138 | 25 |
| 12312 Noel Bain Cv | 0.75mi | 3/2.5 (-1) | 2,281 (-13%) | 14mo | $338,000 | $148 | 24 |
Match score weights: distance 35% · size 25% · config 20% · recency 20%. Top-matched comps best support the ARV.
Projected returns pro-forma
-3.0% appreciation · 0.0% rent growth · sell at horizon
- IRR
- -33.8%
- Equity multiple
- -0.07×
- Total profit
- $-83,735
- Equity at exit
- $41,749
- IRR
- -70.3%
- Equity multiple
- -0.77×
- Total profit
- $-138,542
- Equity at exit
- $24,209
Cash invested: $78,400 (down + closing). Projections, not guarantees.
Landlord ↔ Tenant lean methodology
- Overall (STATE)
- 87 Strongly Landlord-Friendly
- State Texas
- 87 Strongly Landlord-Friendly · R+5
- County
- — inherits STATE
- City
- — inherits STATE
ZIP-level market 78617
- Home prices YoY
- -1.7%
- Rents YoY
- -0.4%
- Active inventory
- 251
- Price-to-rent
- 10.4×
Monthly cashflow live
- Estimated rent
- $2,237 high interval (Pro) →
- Mortgage (P&I)
- −$1,468
- Tax from tax record
- −$660 /mo · $7,926/yr
- Insurance
- −$117
- HOA
- −$25
- Vacancy / Maint / Mgmt
- −$470
- Net cashflow
- $-503
Break-even live
Sensitivity live
| Price | -10% $-345 | -5% $-424 | +0% $-503 | +5% $-582 | +10% $-662 |
|---|---|---|---|---|---|
| Rent | -10% $-680 | -5% $-592 | +0% $-503 | +5% $-415 | +10% $-326 |
| Rate | -1.0pp $-362 | -0.5pp $-432 | base $-503 | +0.5pp $-576 | +1.0pp $-650 |
UW: 25.0% down · 7.5% · 30yr · 1.5% tax · 5.0% vac · 8.0% maint · 8.0% mgmt
Financing live
Cash to close
- Down payment
- $70,000
- Closing costs
- $8,400
- Reserves months
- —
- Total cash needed
- —
Loan-product check · same deal, 3 products live
Conventional
25% down · 7.5% · 30yr
- Down + closing
- —
- Monthly P&I
- —
- Monthly cashflow
- —
- DSCR
- —
- Eligible?
- —
Personal DTI + credit; lowest rate.
DSCR
20% down · 8.5% · 30yr
- Down + closing
- —
- Monthly P&I
- —
- Monthly cashflow
- —
- DSCR
- —
- Eligible?
- —
No personal income docs; deal must DSCR.
Hard money
10% down · 12.0% · 12mo
- Down + closing
- —
- Monthly P&I
- —
- Monthly cashflow
- —
- DSCR
- —
- Eligible?
- —
Short-term bridge; refi at stabilization.
Rent comps 19 comps
| Address | Beds | Baths | Sqft | Rent | $/sqft | DOM | Units | Dist |
|---|---|---|---|---|---|---|---|---|
| 6316 Carriage Pines Dr Del Valle, TX | 3.0 | 2.5 | 2305 | $2,300 | $1.00 | 45d | 1 | 0.64mi |
| 12821 Stoney Ridge Bnd Del Valle, TX | 3.0 | 2.5 | 2281 | $2,250 | $0.99 | 19d | 1 | 0.68mi |
| 6417 Wagon Spring St Del Valle, TX | 3.0 | 2.5 | 2230 | $2,100 | $0.94 | 14d | 1 | 0.69mi |
| 6417 Wagon Spring St Del Valle, TX | 3.0 | 2.5 | 2230 | $2,149 | $0.96 | 45d | 1 | 0.69mi |
| 6408 Wagon Spring St Del Valle, TX | 4.0 | 3.0 | 2497 | $2,495 | $1.00 | 45d | 1 | 0.70mi |
| 6521 Carriage Pines Dr Del Valle, TX | 5.0 | 3.5 | 2466 | $2,500 | $1.01 | 26d | 1 | 0.70mi |
| 13109 Lofton Cliff Dr Del Valle, TX | 3.0 | 2.0 | 1917 | $2,075 | $1.08 | 14d | 1 | 0.72mi |
| 5204 Bahan Dr Del Valle, TX | 4.0 | 2.5 | 2640 | $1,900 | $0.72 | 4d | 1 | 0.72mi |
| 5032 Irvine Ln Del Valle, TX | 4.0 | 2.5 | 2499 | $2,200 | $0.88 | 24d | 1 | 0.77mi |
| 12316 Noel Bain Cv Del Valle, TX | 3.0 | 2.5 | 2281 | $2,100 | $0.92 | 5d | 1 | 0.78mi |
| 4917 Stockton Ln Del Valle, TX | 4.0 | 2.5 | 2334 | $2,400 | $1.03 | 45d | 1 | 0.87mi |
| 5525 Victory Gallop Dr Del Valle, TX | 3.0 | 2.5 | 1788 | $1,850 | $1.03 | 45d | 1 | 0.97mi |
| 5521 Victory Gallop Dr Del Valle, TX | 3.0 | 2.5 | 1788 | $2,000 | $1.12 | 17d | 1 | 0.98mi |
| 5600 War Admiral Dr Del Valle, TX | 4.0 | 2.5 | 2101 | $2,200 | $1.05 | 5d | 1 | 0.98mi |
| 12901 Staywell Way Del Valle, TX | 3.0 | 2.0 | 1860 | $2,200 | $1.18 | 45d | 1 | 1.09mi |
| 11800 Savanna Canyon Ct Del Valle, TX | 4.0 | 3.0 | 2322 | $2,050 | $0.88 | 6d | 1 | 1.15mi |
| 13817 Gilwell Dr Del Valle, TX | 4.0 | 3.0 | 1878 | $2,195 | $1.17 | 45d | 1 | 1.26mi |
| 14005 Edna Maxine Walk Del Valle, TX | 3.0 | 2.5 | 1932 | $2,100 | $1.09 | 45d | 1 | 1.33mi |
| 5804 Swedish Farms TER Del Valle, TX | 4.0 | 3.0 | 1903 | $2,200 | $1.16 | 45d | 1 | 1.42mi |
HOA detail
- Monthly dues
- $25 · $300/yr
Listing history 17 events
-
2026-06-21days on market $280,000 Active 198 DOM
-
2026-06-18days on market $280,000 Active 195 DOM
-
2026-06-17days on market $280,000 Active 194 DOM
-
2026-06-16days on market $280,000 Active 193 DOM
-
2026-06-15days on market $280,000 Active 192 DOM
-
2026-06-13days on market $280,000 Active 190 DOM
-
2026-06-09days on market $280,000 Active 186 DOM
-
2026-06-08days on market $280,000 Active 185 DOM
-
2026-06-07days on market $280,000 Active 184 DOM
-
2026-06-04days on market $280,000 Active 181 DOM
-
2026-06-03days on market $280,000 Active 180 DOM
-
2026-06-02days on market $280,000 Active 179 DOM
-
2026-06-01days on market $280,000 Active 178 DOM
-
2026-05-31days on market $280,000 Active 177 DOM
-
2026-03-01price $309,000 1406-char remark
Show marketing remark (1406 chars)
Corner Lot | Steps from the Greenbelt | Primary on Main | Upstairs Loft! Positioned just steps from the Dry Creek Greenbelt, 12720 Sky Harbor offers a spacious two-story layout with multiple living areas, a first-floor primary suite, and abundant room to grow. The nearby greenbelt provides a peaceful buffer of open space, natural scenery, and walking areas, giving the home a sense of openness rarely found in this price point. Inside, the main level features a welcoming foyer, two living spaces, and a centrally located kitchen complete with a breakfast nook and formal dining area. The primary bedroom suite is conveniently located on the first floor, providing privacy and ease of access. Upstairs, you'll find a bright and open loft ideal for a game room, office, or second living room, along with three generously sized bedrooms and a full bath. The home offers comfort and functionality throughout. Situated on a corner lot in a desirable Austin location, this property offers strong long-term appeal with a layout that adapts easily to a variety of lifestyles, including work-from-home, multi-generational living, or future value-add enhancements. Its solid structure and flexible design make it an excellent opportunity for buyers seeking a home they can personalize while benefiting from the area’s steady growth and investment potential. Bring your vision and discover the possibilities.
-
2025-12-05$325,000 Active 1406-char remark
Show marketing remark (1406 chars)
Corner Lot | Steps from the Greenbelt | Primary on Main | Upstairs Loft! Positioned just steps from the Dry Creek Greenbelt, 12720 Sky Harbor offers a spacious two-story layout with multiple living areas, a first-floor primary suite, and abundant room to grow. The nearby greenbelt provides a peaceful buffer of open space, natural scenery, and walking areas, giving the home a sense of openness rarely found in this price point. Inside, the main level features a welcoming foyer, two living spaces, and a centrally located kitchen complete with a breakfast nook and formal dining area. The primary bedroom suite is conveniently located on the first floor, providing privacy and ease of access. Upstairs, you'll find a bright and open loft ideal for a game room, office, or second living room, along with three generously sized bedrooms and a full bath. The home offers comfort and functionality throughout. Situated on a corner lot in a desirable Austin location, this property offers strong long-term appeal with a layout that adapts easily to a variety of lifestyles, including work-from-home, multi-generational living, or future value-add enhancements. Its solid structure and flexible design make it an excellent opportunity for buyers seeking a home they can personalize while benefiting from the area’s steady growth and investment potential. Bring your vision and discover the possibilities.
-
2020-09-01soldstatus
ⓘ Source: listings_history table (triggers on properties + properties_extension) + one-shot
backfill from property_details.listing_events for pre-trigger history.
Tax reassessment forecast TX · Resets to sale price
- Current annual tax
- $7,926 · $660/mo
- Projected year-2 tax
- $7,926 · $660/mo
- Expected delta
- $0/yr ($0/mo · 0.0%)
ⓘ Screening estimate from a state-policy table — verify with the county assessor before closing.
Climate risk First Street
- Flood 1/10 Low FEMA zone X (unshaded) · 0% chance over 30 yrs
- Wildfire 5/10 Major
- Heat 8/10 Severe 7 d/yr ≥108°F today · 24 d/yr by 30 yrs out
- Wind 8/10 Severe 80% chance of damaging wind over 30 yrs
- Air quality 1/10 Low 0 unhealthy d/yr today · 0 by 30 yrs out
Nearby sold comps map
Loading sold comps map…
Walkable amenities ~0.75 mi
Loading nearby amenities…
Taxation est. · year 1
- Rental income
- $26,845
- − Mortgage interest
- −$15,684
- − Property taxes
- −$7,926
- − Insurance
- −$1,400
- − Repairs & maintenance
- −$2,148
- − Management
- −$2,148
- − HOA
- −$300
- − Depreciation
- −$8,145
- Taxable loss
- −$10,905
- Est. tax savings @ 24.0%
- +$2,617
- After-tax cash flow
- $-3,421/yr
For passive investors: Depreciation is non-cash, so a rental often shows a tax loss while cash-flowing — sheltering income. Rental losses are passive: they offset passive income freely, and up to $25,000/yr can offset ordinary (W-2) income if you actively participate and your MAGI is under $100k (phasing out to $0 by $150k); unused losses carry forward. On sale, claimed depreciation is recaptured at up to 25%, and gains may owe capital-gains tax (a 1031 exchange can defer both). Figures are a year-1 estimate at your 24.0% rate — not tax advice; consult a CPA.
Schools (NCES district)
- District
- Del Valle ISD
- NCES district ID
- 4816620
- Math proficiency
- 19% ▼ -13.00%
- Reading proficiency
- 26% ▼ -2.00%
- Median HH income
- $41,322
- Composite
- 19.13/100
- National rank
- #8830
- State rank
- #749 of 826 in TX
Livability — Austin
- Score
- 82/100
- State rank
- #16
- US rank
- #1208
Category grades
Schools grade is shown separately in the Schools card above.
Census & demographics
- Census place
- Austin, TX
- County
- Travis County · 1,299,254 people
- City population
- 1,066,854
- Metro
- Austin-Round Rock-Georgetown, TX
- Population (ZIP)
- 30,756
- Household income
- $71,640
- Rent vs Own
- Severe rent burden
- 681.0
Population outlook (Travis County) Hauer SSP2
- Today (2025)
- 1,545,133 people
- By 2030
- 1,729,269 · +11.9%
- By 2040
- 2,097,596 · +35.8%
- By 2050
- 2,463,890 · +59.5%
- By 2075
- 3,249,374 · +110.3%
- By 2100
- 3,801,868 · +146.1%
Race, ethnicity, and origin ACS 2023
- Neighborhood character
- Predominantly Hispanic (75%)
- Race & ethnicity
- Hispanic / Latino 75% Two or more races 33% White 16% Black 6% Asian 1%
- Hispanic origin (detail)
- Mexican 68% Puerto Rican 1%
- Common ancestry
- Romanian 1%
- Foreign-born
- 26% · Canada
- Languages at home
- 41% English-only · Spanish 57% Other Asian/Pacific 1%
Political lean MEDSL · Travis
- 2024 margin
- Solid D (+39.3) · D 68.8% · R 29.4% · Other 1.8%
- 2008→2024 swing
- +9.9pp toward D · 2008: 29.4pp · 2024: 39.3pp
- All cycles
- 2024: D+39.3 2020: D+45.0 2016: D+38.9 2012: D+23.9 2008: D+29.4
Not yet ingested
- Civics
- —
Market trends
- HPI YoY
- ▼ -3.24%
- Current HPI
- 192.3518
- Rent YoY
- ▼ -0.36%
- Metro
- Austin-Round Rock-Georgetown, TX
- State GDP YoY
- ▲ 3.95%
- F500 in state
- 110
Industry mix (Fortune 500 HQ in TX)
| Industry | F500 HQs | Revenue |
|---|---|---|
| Energy | 16 | $1,198B |
|
||
| Technology | 5 | $198B |
|
||
| Engineering / Construction | 4 | $72B |
|
||
| Energy Services | 3 | $60B |
|
||
| Utilities | 3 | $41B |
|
||
| Healthcare | 2 | $330B |
|
||
Price history
-4.9% since first listed3 events — show timeline
- 2026-03-01 Price Changed $309,000 Unlock MLS
- 2025-12-05 Listed $325,000 Unlock MLS
- 2020-09-01 Sold (Public Records) — Public Records
Property tax history
+3.4%/yrLatest (2026): $7,926 · +10.0% YoY. Source: county tax records.
Cash-flow waterfall
monthlySold comps — $/sqft
last 12 mo · ≤1 miLoading sold comps…