 Multi-family
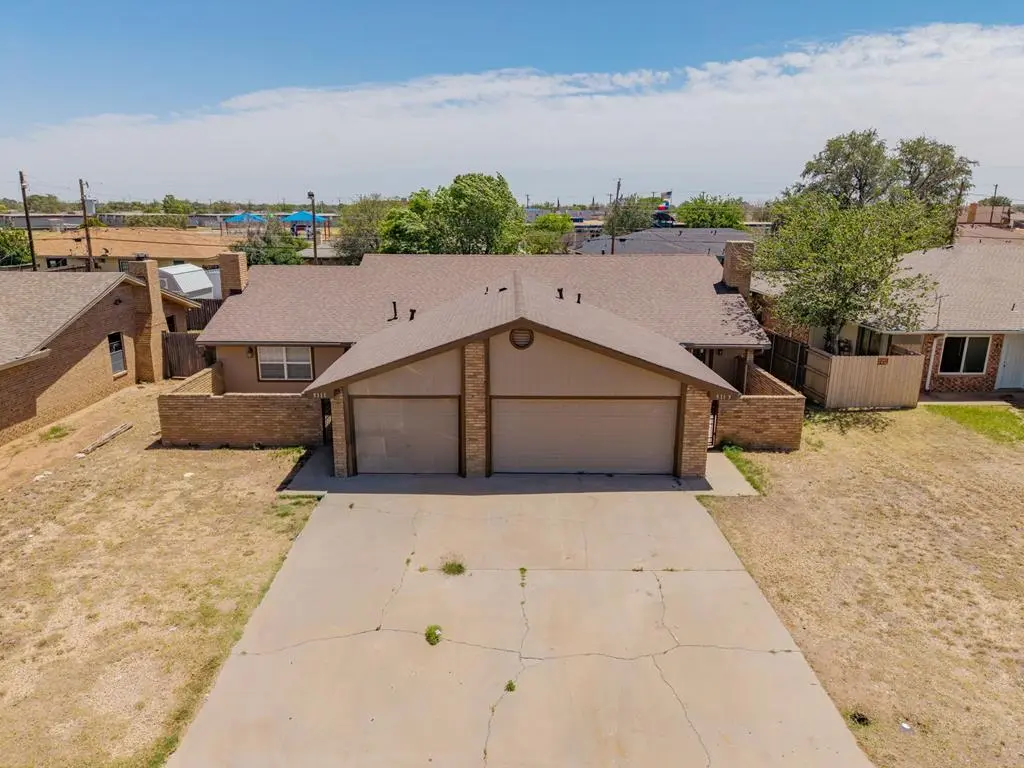
5111 W Illinois Ave · Midland, TX
Flood risk 1/10 · Minimal
- FEMA flood zone
- X
- Chance of flooding over 30 yrs
- 0.0%
- Est. flood insurance / yr
- $507 – $1,088
Fire risk 8/10 · Major
- Est. fire insurance / yr
- $1,222 – $2,270
Heat risk 6/10 · Moderate
- Hot days now (above 101°F)
- 7 days/yr
- Hot days in 30 yrs
- 22 days/yr
Wind risk 2/10 · Minimal
- Chance of severe wind over 30 yrs
- 3.0%
Air-quality risk 1/10 · Minimal
- Unhealthy air days now
- 0 days/yr
- Unhealthy air days in 30 yrs
- 0 days/yr
Risk factors via First Street. Map © Google.
Why this score? — see what drove the D grade
The composite is a weighted blend of 9 inputs, each scored 0–100. Each bar is that input's sub-score; the figure is the points it added to the 100-point composite (weight × sub-score).
- Cash flow +14.3/30.0
- ARV discount +7.5/15.0
- DSCR +4.3/10.0
- Livability +4.0/5.0
- 1% rule +3.4/10.0
- Schools +3.2/10.0
- Condition / age +2.5/5.0
- Rent growth +2.4/5.0
- Appreciation +0.0/10.0
$450,000
🖨 Deal sheet 📄 Offer letter ✓ Due diligence
Multi-family units
County records classify this as Multi-Family (2-4 Unit). Listing-text estimate: 1 unit. estimate disagrees with records
Listing remarks
Incredible opportunity! 2 remodeled units! MOVE IN READY! Fresh paint, recent flooring, light fixtures and quartz! UPDATED ELECTRICAL! 5 bedrooms, 4 full baths, 2 fireplaces, 2 water heaters. .. 3 GARAGE SPACES! Absolutely beautiful!! SEPARATE FENCED BACK YARDS, shade tree, FABULOUS SEPARATE GATED COURTYARDS! LIVE IN ONE AND RENT THE OTHER, or rent them both! CLOSE TO LOOP 250, SHOPPING, RESTAURANTS & STADIUM. Virtual Staging
Key facts
- Remodeled units
- Close to loop 250
- Fenced back yards
Tags
Property features AI
Exterior
- Utilities: Public water; Public sewer
- Home design: Duplex (residential income); Single-story
- Construction: Brick veneer construction; Slab foundation
- Exterior features: Covered patio; Wood fencing; Composition roof
Interior
- Kitchen: Oven; Dishwasher; Microwave; Electric range; Range
- Bedrooms: One 3-bedroom unit; One 2-bedroom unit
- Bathrooms: One 3-bedroom unit with 2 bathrooms; One 2-bedroom unit with 2 bathrooms
- Heating & cooling: Central heating (natural gas); Central air conditioning
- Interior features: Living room fireplace; Covered patio
- Laundry & utility: Gas water heater
Neighborhood map
What this means for you Summary
Snapshot
- This is a 5-bed/4.0-bath multifamily listed at $450k.
Deal economics
- At list price, monthly cash flow is $78 ($940/yr) — positive.
- The deal already cash-flows at list — no discount required.
- To meet the 1% rule (rent ≥ 1% of price), the offer needs to be $376k (16.3% below list).
- Recommended offer: $376k (16.3% below list) — sets the bar for 1% rule.
- Cap rate 6.5% vs local median 4.7% in Midland — top-decile yield for the area; either an underpriced asset or a hidden risk that comps aren't pricing in. Stress-test before assuming the spread holds.
Location & tenants
- Location reads 79/100 on livability (#57 in TX, #2,192 nationally) — a middle-class / working-renter tenant base. Strengths: employment A+, housing A+, health & safety A+; Watch: crime C-, commute D+, amenities D.
- Midland ISD (urban): math 34% / reading 36% proficiency, ranked #477 of 826 in TX (top 58%) — families likely to look elsewhere, expect single-tenant / working-renter base with shorter leases.
- Zoned schools: Jones El (math 22% / reading 27%, grade F, #3,052 of 4,322 statewide, top 74%, 448 students, 69% FRL); Alamo J H (math 23% / reading 32%, grade F, #1,156 of 1,662 statewide, top 71%, 865 students, 62% FRL); Midland H S (math 37% / reading 7%, grade F, #1,366 of 1,632 statewide, top 84%, 2,492 students, 44% FRL).
- Market conditions: Rents soft (-0.3%/yr); 64 active listings in the ZIP; 9 comparable units currently listed for rent nearby; rentals lingering (median 44d on market — plan ~5-8 weeks vacancy on turnover, expect pricing pressure); 67% of comp listings sitting > 30 days — soft ceiling on asking rent; solid renter incomes; 1,504 units permitted in Midland County in 2024 (0 in 5+ unit buildings).
- At $3,765/mo this rent would consume 58% of the median local household income ($77k/yr) (locally 417% of renters already pay >50% of income on rent) — very limited rent-growth headroom before tenants either downsize or default.
Forward outlook
- Local home prices are declining (-3.0%/yr); year-one equity from $3k of loan paydown is wiped out by about $14k of value loss. Plan a longer hold.
- Midland County population projected at +83% by 2050 — long-run rental-demand tailwind backs the buy-and-hold thesis.
Negotiation context
- It's been on market 19 days — a 2% lower offer ($443k) is reasonable based on typical stale-listing flexibility.
Risks & watch-outs
- Climate carrying-cost: severe wildfire risk; extreme-heat days projected 7→22/yr by 2055 (HVAC capex compounding) — expect insurance premiums to compound above CPI over the hold.
Questions for the listing agent
- Is there a deadline driving the sale (1031 exchange, divorce, estate, relocation)? That informs how much negotiation room exists.
- The area grade is low — what's the realistic commute time and amenity access for the typical tenant pool here? Any planned neighborhood developments (good or bad) we should know about?
- What's the average days-on-market for RENTAL listings here right now (not sales)? A rising rental-DOM trend means longer vacancies and softer asking-rent achievability than the comps imply.
- What's the recent tenant-quality profile in this submarket — average credit score on applications, eviction rate, late-payment / NSF rate, and stable-employment percentage? A property-management company in the area should have these aggregated.
- How much new apartment / multifamily construction is in the pipeline within 1–3 miles? Heavy new supply (>2% of stock underway) typically softens rents 12–24 months out; light construction supports rent growth.
Investment metrics
- 1% rule
- 0.84% ✗
- Cap rate
- 6.50%
- Cash-on-cash
- 0.75%
- DSCR
- 1.03
- GRM
- 10.0
CMA / ARV
No comps found within radius.
Projected returns pro-forma
-3.0% appreciation · 0.0% rent growth · sell at horizon
- IRR
- -18.3%
- Equity multiple
- 0.37×
- Total profit
- $-79,039
- Equity at exit
- $67,096
- IRR
- -17.5%
- Equity multiple
- 0.16×
- Total profit
- $-105,346
- Equity at exit
- $38,908
Cash invested: $126,000 (down + closing). Projections, not guarantees.
Landlord ↔ Tenant lean methodology
- Overall (STATE)
- 87 Strongly Landlord-Friendly
- State Texas
- 87 Strongly Landlord-Friendly · R+5
- County
- — inherits STATE
- City
- — inherits STATE
ZIP-level market 79703
- Rents YoY
- -0.3%
- Active inventory
- 64
- Price-to-rent
- 20.6×
Monthly cashflow live
- Estimated rent
- $3,765 high interval (Pro) →
- Mortgage (P&I)
- −$2,360
- Tax from tax record
- −$349 /mo · $4,184/yr
- Insurance
- −$188
- HOA
- −$0
- Vacancy / Maint / Mgmt
- −$791
- Net cashflow
- $78
Break-even live
2-unit breakdown (identical units grouped — click to expand)
| Units | Beds | Baths | Est. rent |
|---|---|---|---|
| 1× unit | 2 | 1 | $1,821 |
| 1× unit | 3 | 1 | $1,945 |
| Total (2 units) | $3,765 | ||
UW: 25.0% down · 7.5% · 30yr · 1.5% tax · 5.0% vac · 8.0% maint · 8.0% mgmt
Financing live
Cash to close
- Down payment
- $112,500
- Closing costs
- $13,500
- Reserves months
- —
- Total cash needed
- —
Loan-product check · same deal, 3 products live
Conventional
25% down · 7.5% · 30yr
- Down + closing
- —
- Monthly P&I
- —
- Monthly cashflow
- —
- DSCR
- —
- Eligible?
- —
Personal DTI + credit; lowest rate.
DSCR
20% down · 8.5% · 30yr
- Down + closing
- —
- Monthly P&I
- —
- Monthly cashflow
- —
- DSCR
- —
- Eligible?
- —
No personal income docs; deal must DSCR.
Hard money
10% down · 12.0% · 12mo
- Down + closing
- —
- Monthly P&I
- —
- Monthly cashflow
- —
- DSCR
- —
- Eligible?
- —
Short-term bridge; refi at stabilization.
Rent comps 9 comps
| Address | Beds | Baths | Sqft | Rent | $/sqft | DOM | Units | Dist |
|---|---|---|---|---|---|---|---|---|
| 4515 Monty Dr Midland, TX | 4.0 | 2.0 | 1853 | $2,400 | $1.30 | 43d | 1 | 0.66mi |
| 303 Koufax Ct Midland, TX | 4.0 | 2.0 | 2096 | $2,950 | $1.41 | 21d | 1 | 0.73mi |
| 4317 Tanner Dr Unit A Midland, TX | 4.0 | 2.0 | 2220 | $2,650 | $1.19 | 21d | 1 | 0.85mi |
| 509 Wagner Dr Midland, TX | 4.0 | 2.0 | 2085 | $3,000 | $1.44 | 43d | 1 | 0.93mi |
| 6020 Spahn St Midland, TX | 4.0 | 2.0 | 1849 | $2,800 | $1.51 | 43d | 1 | 1.04mi |
| 619 Victory Pkwy Midland, TX | 4.0 | 2.0 | 1824 | $3,200 | $1.75 | 13d | 1 | 1.43mi |
| 3900 Douglas Ave Midland, TX | 4.0 | 2.0 | 1961 | $2,800 | $1.43 | 43d | 1 | 1.45mi |
| 6418 Patriot Pkwy Midland, TX | 4.0 | 2.0 | 2178 | $3,200 | $1.47 | 43d | 1 | 1.47mi |
| 6614 Jamestown St Midland, TX | 4.0 | 3.0 | 2284 | $3,000 | $1.31 | 43d | 1 | 1.49mi |
Listing history 18 events
-
2026-06-19status $450,000 Pending 19 DOM
-
2026-06-18days on market $450,000 Active Under Contract 19 DOM
-
2026-06-17days on market $450,000 Active Under Contract 18 DOM
-
2026-06-16days on market $450,000 Active Under Contract 17 DOM
-
2026-06-15days on market $450,000 Active Under Contract 16 DOM
-
2026-06-14days on market $450,000 Active Under Contract 14 DOM
-
2026-06-13days on market $450,000 Active Under Contract 13 DOM
-
2026-06-10days on market $450,000 Active Under Contract 11 DOM
-
2026-06-09days on market $450,000 Active Under Contract 10 DOM
-
2026-06-08days on market $450,000 Active Under Contract 9 DOM
-
2026-06-07remarks 431-char remark
-
2026-06-07statusdays on market $450,000 Active Under Contract 8 DOM
-
2026-06-03days on market $450,000 Active 4 DOM
-
2026-06-02days on market $450,000 Active 3 DOM
-
2026-06-01days on market $450,000 Active 2 DOM
-
2026-06-01remarks 415-char remark
-
2026-05-31remarks 380-char remark
-
2026-05-31$450,000 Active 1 DOM
ⓘ Source: listings_history table (triggers on properties + properties_extension) + one-shot
backfill from property_details.listing_events for pre-trigger history.
Tax reassessment forecast TX · Resets to sale price
- Current annual tax
- $4,184 · $349/mo
- Projected year-2 tax
- $8,235 · $686/mo
- Expected delta
- +$4,051/yr (+$338/mo · 96.8%)
ⓘ Screening estimate from a state-policy table — verify with the county assessor before closing.
Climate risk First Street
- Flood 1/10 Low FEMA zone X · 0% chance over 30 yrs
- Wildfire 8/10 Severe
- Heat 6/10 Major 7 d/yr ≥101°F today · 22 d/yr by 30 yrs out
- Wind 2/10 Low 3% chance of damaging wind over 30 yrs
- Air quality 1/10 Low 0 unhealthy d/yr today · 0 by 30 yrs out
Nearby sold comps map
Loading sold comps map…
Walkable amenities ~0.75 mi
Loading nearby amenities…
Taxation est. · year 1
- Rental income
- $45,180
- − Mortgage interest
- −$25,207
- − Property taxes
- −$4,184
- − Insurance
- −$2,250
- − Repairs & maintenance
- −$3,614
- − Management
- −$3,614
- − Depreciation
- −$13,091
- Taxable loss
- −$6,781
- Est. tax savings @ 24.0%
- +$1,627
- After-tax cash flow
- $2,567/yr
For passive investors: Depreciation is non-cash, so a rental often shows a tax loss while cash-flowing — sheltering income. Rental losses are passive: they offset passive income freely, and up to $25,000/yr can offset ordinary (W-2) income if you actively participate and your MAGI is under $100k (phasing out to $0 by $150k); unused losses carry forward. On sale, claimed depreciation is recaptured at up to 25%, and gains may owe capital-gains tax (a 1031 exchange can defer both). Figures are a year-1 estimate at your 24.0% rate — not tax advice; consult a CPA.
Schools (NCES district)
- District
- Midland ISD
- NCES district ID
- 4830570
- Math proficiency
- 34% ▼ -7.00%
- Reading proficiency
- 36% ▬ 0.00%
- Median HH income
- $63,457
- Composite
- 31.63/100
- National rank
- #5938
- State rank
- #477 of 826 in TX
Livability — Midland
- Score
- 79/100
- State rank
- #57
- US rank
- #2192
Category grades
Schools grade is shown separately in the Schools card above.
Census & demographics
- Census place
- Midland, TX
- County
- Midland County · 168,494 people
- City population
- 168,494
- Metro
- Midland, TX
- Population (ZIP)
- 20,419
- Household income
- $77,285
- Rent vs Own
- Severe rent burden
- 417.0
Population outlook (Midland County) Hauer SSP2
- Today (2025)
- 220,895 people
- By 2030
- 253,667 · +14.8%
- By 2040
- 325,498 · +47.4%
- By 2050
- 404,168 · +83.0%
- By 2075
- 609,802 · +176.1%
- By 2100
- 760,172 · +244.1%
Race, ethnicity, and origin ACS 2023
- Neighborhood character
- Diverse neighborhood (Simpson 0.59)
- Race & ethnicity
- Hispanic / Latino 54% White 34% Two or more races 16% Black 8% Asian 2%
- Hispanic origin (detail)
- Mexican 45% Cuban 4%
- Common ancestry
- Slovak 1% Italian 1% Serbian 1%
- Foreign-born
- 20% · Canada, Jamaica, Vietnam
- Languages at home
- 58% English-only · Spanish 38% Arabic 1% Chinese 1%
Political lean MEDSL · Midland
- 2024 margin
- Solid R (+60.5) · D 19.3% · R 79.8%
- 2008→2024 swing
- -3.3pp toward R · 2008: -57.3pp · 2024: -60.5pp
- All cycles
- 2024: R+60.5 2020: R+56.6 2016: R+55.2 2012: R+61.5 2008: R+57.3
Not yet ingested
- Civics
- —
Market trends
- HPI YoY
- ▼ -250.72%
- Current HPI
- 224.6222
- Rent YoY
- ▼ -0.33%
- Metro
- Midland, TX
- State GDP YoY
- ▲ 3.95%
- F500 in state
- 110
Industry mix (Fortune 500 HQ in TX)
| Industry | F500 HQs | Revenue |
|---|---|---|
| Energy | 16 | $1,198B |
|
||
| Technology | 5 | $198B |
|
||
| Engineering / Construction | 4 | $72B |
|
||
| Energy Services | 3 | $60B |
|
||
| Utilities | 3 | $41B |
|
||
| Healthcare | 2 | $330B |
|
||
Price history
+33233.3% since first listed7 events — show timeline
- 2026-05-30 Listed $450,000 PBBOR
- 2025-03-19 Price Changed $425,000 PBBOR
- 2025-03-13 Price Changed $449,000 PBBOR
- 2025-03-13 Price Changed $445,000 PBBOR
- 2022-02-03 Price Changed $1,350 RENT.
- 2021-12-30 Sold (Public Records) — Public Records
- 2003-06-26 Sold (Public Records) — Public Records
Property tax history
+2.4%/yrLatest (2025): $4,184 · +1.3% YoY. Source: county tax records.
Cash-flow waterfall
monthlySold comps — $/sqft
last 12 mo · ≤1 miLoading sold comps…