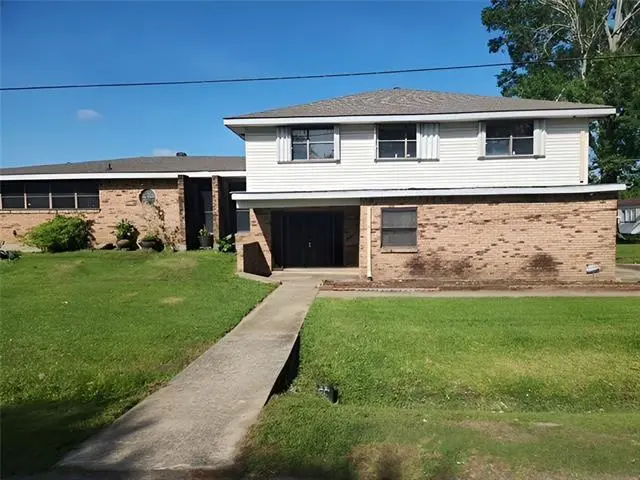
209 Historic East St · Garyville, LA
Flood risk 1/10 · Minimal
- FEMA flood zone
- X (shaded)
- Chance of flooding over 30 yrs
- 0.0%
- Est. flood insurance / yr
- $507 – $1,088
Fire risk 1/10 · Minimal
- Est. fire insurance / yr
- $1,269 – $2,357
Heat risk 9/10 · Severe
- Hot days now (above 108°F)
- 7 days/yr
- Hot days in 30 yrs
- 21 days/yr
Wind risk 9/10 · Severe
- Chance of severe wind over 30 yrs
- 99.0%
Air-quality risk 2/10 · Minimal
- Unhealthy air days now
- 1 days/yr
- Unhealthy air days in 30 yrs
- 2 days/yr
Risk factors via First Street. Map © Google.
Why this score? — see what drove the B+ grade
The composite is a weighted blend of 9 inputs, each scored 0–100. Each bar is that input's sub-score; the figure is the points it added to the 100-point composite (weight × sub-score).
- Cash flow +30.0/30.0
- DSCR +10.0/10.0
- Appreciation +10.0/10.0
- 1% rule +8.9/10.0
- ARV discount +7.5/15.0
- Livability +3.2/5.0
- Rent growth +2.5/5.0
- Condition / age +2.5/5.0
- Schools +1.7/10.0
$109,900
🖨 Deal sheet 📄 Offer letter ✓ Due diligence
Listing remarks MLS
"House on the Hill". This 2700+ sq ft, tri-level home is situated on a 110'x90' lot. Covered entry at the 1st level: Spacious, centrally located foyer. Great room w/wood -burning fireplace. Laundry room. Half bath. 2-bay garage has storage room. Brick steps to the large landing at the 2nd level: Informal dining, formal dining, kitchen and formal living with bay window. Curved stairs to the 3rd level: 3 bedrooms & 1 full bath. And primary bedroom with closets, dressing area and primary bath.
Key facts
- Storage room
- 2 bay garage
- Laundry room
Tags
Property features AI
Finance
- HOA & community: No homeowners association
Exterior
- Parking: Attached garage with two spaces
- Utilities: No sewer available; No water available
- Home design: 2-story home; Poor condition
- Construction: Block and vinyl siding construction; Shingle roof; Slab foundation; Built prior to or around listing year
- Exterior features: Fenced yard; Kennel / dog run and kennels; Shed(s); City lot; Rectangular lot; Lot dimensions approximately 90 x 109
Interior
- Bedrooms: Total rooms: 10
- Bathrooms: 2 full bathrooms; 1 half bathroom
- Interior features: Ceiling fan(s); Wood-burning fireplace
Neighborhood map
What this means for you Summary
Snapshot
- This is a 4-bed/2.5-bath single-family listed at $110k.
Deal economics
- At list price, monthly cash flow is $538 ($6k/yr) — positive.
- The deal already cash-flows at list — no discount required.
- Meets the 1% rule at list price ($2k rent vs $110k).
Location & tenants
- Location reads 65/100 on livability (#154 in LA) — a middle-class / working-renter tenant base. Strengths: crime A+, cost of living A+, housing A+; Watch: health & safety C-, schools D, amenities F.
- St. John The Baptist Parish (suburban): math 13% / reading 25% proficiency, ranked #68 of 98 in LA (top 69%) — low school quality limits family demand, transient renter base, plan for 1-2y turnover; 82% free/reduced lunch — lower-income household profile, screen leases tightly.
- Market conditions: 12 active listings in the ZIP; 61 units permitted in St. John the Baptist Parish in 2024 (0 in 5+ unit buildings).
Forward outlook
- In year one you build about $12k of equity ($760 loan paydown + $11k appreciation (10.0% local appreciation)).
- St. John the Baptist County population projected at -20% by 2050 — secular population decline; favor cash flow + early exit over multi-decade hold.
- At projected returns (10.0% appreciation + 3.0% rent growth), your $31k cash investment doubles in ~2 years — after that, you're playing with house money.
- By year 4, paydown + projected appreciation supports a ~$42k cash-out refi (75% LTV) — recoverable capital for the next deal without selling this one.
Negotiation context
- Only 10 days on market — expect competitive offers; lowballing is unlikely to land.
- 4 sale attempts since 9y ago with the ask held roughly flat each time — persistent listings suggest the price (not the market) is what's stuck; bring a comps-based counter.
Risks & watch-outs
- Climate carrying-cost: severe wind risk, 99% chance of damaging wind over 30y; extreme-heat days projected 7→21/yr by 2055 (HVAC capex compounding) — expect insurance premiums to compound above CPI over the hold.
Questions for the listing agent
- Is there a deadline driving the sale (1031 exchange, divorce, estate, relocation)? That informs how much negotiation room exists.
- Schools are D-rated, which usually means shorter tenancies and higher turnover. Who's the typical renter profile here, and what's been the actual vacancy rate?
- What's the average days-on-market for RENTAL listings here right now (not sales)? A rising rental-DOM trend means longer vacancies and softer asking-rent achievability than the comps imply.
- What's the recent tenant-quality profile in this submarket — average credit score on applications, eviction rate, late-payment / NSF rate, and stable-employment percentage? A property-management company in the area should have these aggregated.
- How much new for-sale + rental construction is in the pipeline within 1–3 miles? Heavy new supply typically softens prices + rents 12–24 months out; constrained supply supports both.
Investment metrics
- 1% rule
- 1.39% ✓
- Cap rate
- 12.16%
- Cash-on-cash
- 20.97%
- DSCR
- 1.93
- GRM
- 6.0
CMA / ARV
No comps found within radius.
Projected returns pro-forma
10.0% appreciation · 3.0% rent growth · sell at horizon
- IRR
- 39.9%
- Equity multiple
- 4.06×
- Total profit
- $94,069
- Equity at exit
- $99,007
- IRR
- 34.4%
- Equity multiple
- 9.12×
- Total profit
- $250,014
- Equity at exit
- $213,512
Cash invested: $30,772 (down + closing). Projections, not guarantees.
Landlord ↔ Tenant lean methodology
- Overall (STATE)
- 90 Strongly Landlord-Friendly
- State Louisiana
- 90 Strongly Landlord-Friendly · R+12
- County
- — inherits STATE
- City
- — inherits STATE
ZIP-level market 70051
- Home prices YoY
- 21.1%
- Active inventory
- 12
- Price-to-rent
- 6.0×
Monthly cashflow live
- Estimated rent
- $1,522 medium interval (Pro) →
- Mortgage (P&I)
- −$576
- Tax from tax record
- −$43 /mo · $512/yr
- Insurance
- −$46
- HOA
- −$0
- Vacancy / Maint / Mgmt
- −$320
- Net cashflow
- $538
Break-even live
UW: 25.0% down · 7.5% · 30yr · 1.5% tax · 5.0% vac · 8.0% maint · 8.0% mgmt
Financing live
Cash to close
- Down payment
- $27,475
- Closing costs
- $3,297
- Reserves months
- —
- Total cash needed
- —
Loan-product check · same deal, 3 products live
Conventional
25% down · 7.5% · 30yr
- Down + closing
- —
- Monthly P&I
- —
- Monthly cashflow
- —
- DSCR
- —
- Eligible?
- —
Personal DTI + credit; lowest rate.
DSCR
20% down · 8.5% · 30yr
- Down + closing
- —
- Monthly P&I
- —
- Monthly cashflow
- —
- DSCR
- —
- Eligible?
- —
No personal income docs; deal must DSCR.
Hard money
10% down · 12.0% · 12mo
- Down + closing
- —
- Monthly P&I
- —
- Monthly cashflow
- —
- DSCR
- —
- Eligible?
- —
Short-term bridge; refi at stabilization.
Listing history 9 events
-
2026-06-19days on market $109,900 Active 10 DOM
-
2026-06-18days on market $109,900 Active 9 DOM
-
2026-06-17days on market $109,900 Active 8 DOM
-
2026-06-16days on market $109,900 Active 7 DOM
-
2026-06-15days on market $109,900 Active 6 DOM
-
2026-06-14days on market $109,900 Active 4 DOM
-
2026-06-13days on market $109,900 Active 3 DOM
-
2026-06-10remarks 498-char remark
-
2026-06-10$109,900 Active 1 DOM
ⓘ Source: listings_history table (triggers on properties + properties_extension) + one-shot
backfill from property_details.listing_events for pre-trigger history.
Tax reassessment forecast LA · Resets to sale price
- Current annual tax
- $512 · $43/mo
- Projected year-2 tax
- $604 · $50/mo
- Expected delta
- +$92/yr (+$8/mo · 18.0%)
ⓘ Screening estimate from a state-policy table — verify with the county assessor before closing.
Climate risk First Street
- Flood 1/10 Low FEMA zone X (shaded) · 0% chance over 30 yrs
- Wildfire 1/10 Low
- Heat 9/10 Extreme 7 d/yr ≥108°F today · 21 d/yr by 30 yrs out
- Wind 9/10 Extreme 99% chance of damaging wind over 30 yrs
- Air quality 2/10 Low 1 unhealthy d/yr today · 2 by 30 yrs out
Nearby sold comps map
Loading sold comps map…
Walkable amenities ~0.75 mi
Loading nearby amenities…
Taxation est. · year 1
- Rental income
- $18,267
- − Mortgage interest
- −$6,156
- − Property taxes
- −$512
- − Insurance
- −$550
- − Repairs & maintenance
- −$1,461
- − Management
- −$1,461
- − Depreciation
- −$3,197
- Taxable income
- $4,929
- Est. tax owed @ 24.0%
- −$1,183
- After-tax cash flow
- $5,270/yr
For passive investors: Depreciation is non-cash, so a rental often shows a tax loss while cash-flowing — sheltering income. Rental losses are passive: they offset passive income freely, and up to $25,000/yr can offset ordinary (W-2) income if you actively participate and your MAGI is under $100k (phasing out to $0 by $150k); unused losses carry forward. On sale, claimed depreciation is recaptured at up to 25%, and gains may owe capital-gains tax (a 1031 exchange can defer both). Figures are a year-1 estimate at your 24.0% rate — not tax advice; consult a CPA.
Schools (NCES district)
- District
- St. John The Baptist Parish
- NCES district ID
- 2201530
- Math proficiency
- 13% ▼ -42.00%
- Reading proficiency
- 25% ▼ -39.00%
- Median HH income
- $50,280
- Composite
- 17.07/100
- National rank
- #9120
- State rank
- #68 of 98 in LA
Livability — Garyville
- Score
- 65/100
- State rank
- #154
- US rank
- #13042
Category grades
Schools grade is shown separately in the Schools card above.
Census & demographics
- Census place
- Garyville, LA
- City population
- 2,045
- Population (ZIP)
- 1,913
Population outlook (St. John the Baptist County) Hauer SSP2
- Today (2025)
- 40,972 people
- By 2030
- 39,295 · -4.1%
- By 2040
- 35,902 · -12.4%
- By 2050
- 32,988 · -19.5%
- By 2075
- 28,661 · -30.0%
- By 2100
- 26,456 · -35.4%
Race, ethnicity, and origin ACS 2023
- Neighborhood character
- Majority Black (55%)
- Race & ethnicity
- Black 55% White 41% Two or more races 4%
- Common ancestry
- Lithuanian 6% Slovak 1%
- Languages at home
- 99% English-only · French/Haitian/Cajun 1%
Political lean MEDSL · St. John the Baptist
- 2024 margin
- Strong D (+29.1) · D 64.0% · R 34.8% · Other 1.2%
- 2008→2024 swing
- +12.9pp toward D · 2008: 16.2pp · 2024: 29.1pp
- All cycles
- 2024: D+29.1 2020: D+28.2 2016: D+24.5 2012: D+26.3 2008: D+16.2
Not yet ingested
- Civics
- —
Market trends
- HPI YoY
- ▲ 33.23%
- Current HPI
- 190.43
- Rent YoY
- —
- Metro
- —
- State GDP YoY
- ▲ 3.29%
- F500 in state
- 10
Industry mix (Fortune 500 HQ in LA)
| Industry | F500 HQs | Revenue |
|---|---|---|
| Telecommunications | 2 | $23B |
|
||
| Utilities | 1 | $12B |
|
||
| Wholesale / Distribution | 1 | $5B |
|
||
| Advertising | 1 | $2B |
|
||
Price history
-23.7% since first listed6 events — show timeline
- 2026-06-08 Listed $109,900 AcadianaMLS
- 2026-06-08 Listed $109,900 GSREIN
- 2017-12-13 Sold (MLS) $125,000 GSREIN
- 2017-10-30 Contingent — GSREIN
- 2017-10-13 Listed $144,000 GSREIN
- 2017-10-12 Listed $144,000 AcadianaMLS
Property tax history
-4.6%/yrLatest (2025): $512 · +0.1% YoY. Source: county tax records.
Cash-flow waterfall
monthlySold comps — $/sqft
last 12 mo · ≤1 miLoading sold comps…