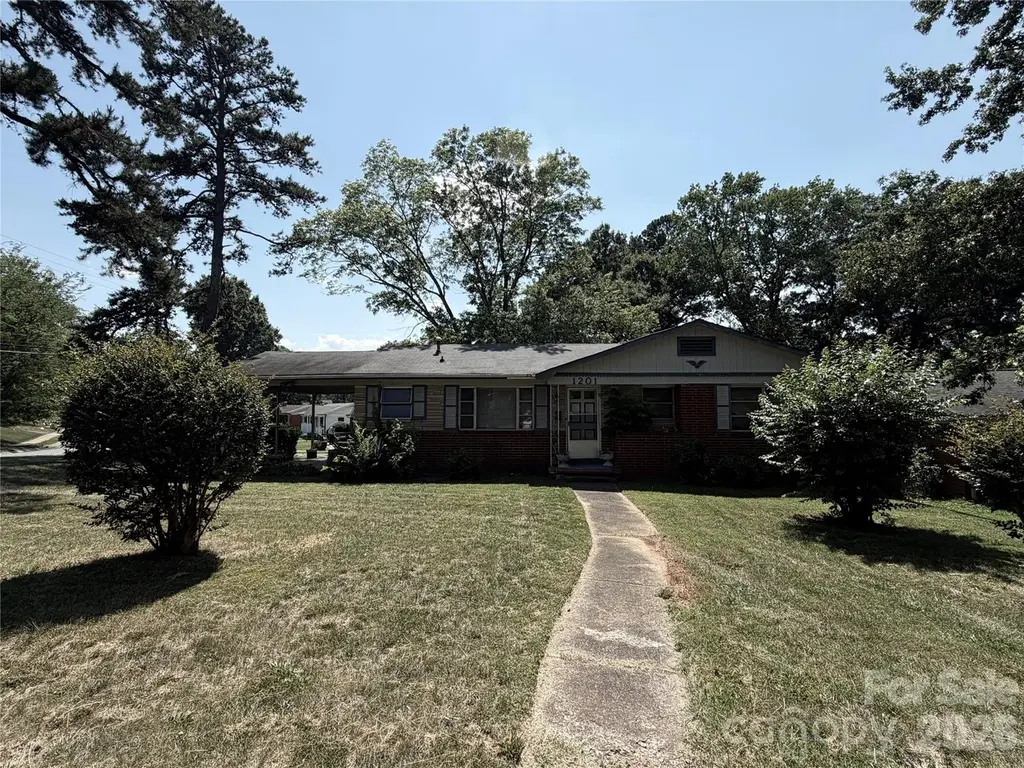
1201 Clanton Rd · Charlotte, NC
Flood risk 1/10 · Minimal
- FEMA flood zone
- X (unshaded)
- Chance of flooding over 30 yrs
- 0.0%
- Est. flood insurance / yr
- $507 – $1,088
Fire risk 1/10 · Minimal
- Est. fire insurance / yr
- $906 – $1,684
Heat risk 6/10 · Moderate
- Hot days now (above 103°F)
- 7 days/yr
- Hot days in 30 yrs
- 17 days/yr
Wind risk 6/10 · Moderate
- Chance of severe wind over 30 yrs
- 27.0%
Air-quality risk 3/10 · Minor
- Unhealthy air days now
- 3 days/yr
- Unhealthy air days in 30 yrs
- 4 days/yr
Risk factors via First Street. Map © Google.
Why this score? — see what drove the D+ grade
The composite is a weighted blend of 9 inputs, each scored 0–100. Each bar is that input's sub-score; the figure is the points it added to the 100-point composite (weight × sub-score).
- ARV discount +15.0/15.0
- Cash flow +13.2/30.0
- DSCR +4.0/10.0
- Livability +3.9/5.0
- Schools +3.8/10.0
- 1% rule +3.0/10.0
- Rent growth +2.5/5.0
- Condition / age +2.5/5.0
- Appreciation +0.0/10.0
$225,000
🖨 Deal sheet 📄 Offer letter ✓ Due diligence
Listing remarks
Investor Special in Prime Charlotte Location! Opportunity awaits at 1201 Clanton Road! This all-brick ranch sits on a desirable corner lot in one of Charlotte’s rapidly growing areas, just minutes from South End, Uptown, and major employment centers. Currently configured as a 2-bedroom, 1-bath home, the property offers excellent potential to be reimagined into a 3-bedroom, 2-bath residence through a complete renovation. Whether you’re an investor, builder, or homeowner looking for your next project, this property presents the chance to create significant value in a highly sought-after location. The solid brick construction provides a strong foundation for renovation, while the
Key facts
- Generous corner lot
- All brick ranch
- Enhanced curb appeal
Tags
Property features AI
Finance
- HOA & community: No HOA dues
Exterior
- Parking: Attached carport; Driveway parking; 1 covered space; 2 open parking spaces
- Utilities: City water; Public sewer
- Home design: Single-family residence; Residential property; One story; Site-built construction; N1-B zoning
- Construction: Brick partial exterior; Composition roof; Crawl space foundation
- Exterior features: Corner lot; Chain link and partial fencing; Asphalt/paved public road access
Interior
- Kitchen: No appliances listed
- Bedrooms: 2 bedrooms (main level)
- Bathrooms: 1 full bathroom (main level)
- Heating & cooling: Natural gas heating; No cooling
- Interior features: One living room (1 room total); No built-in appliances listed
- Laundry & utility: Utility room for laundry
Neighborhood map
What this means for you Summary
Snapshot
- This is a 2-bed/1.0-bath single-family listed at $225k.
Deal economics
- At list price, monthly cash flow is $-4 ($-49/yr) — negative.
- To cash-flow at today's rent, offer at most $224k (0.3% below list).
- To meet the 1% rule (rent ≥ 1% of price), the offer needs to be $180k (20.0% below list).
- Recommended offer: $180k (20.0% below list) — sets the bar for 1% rule.
- Cap rate 6.3% vs local median 3.1% in Charlotte — top-decile yield for the area; either an underpriced asset or a hidden risk that comps aren't pricing in. Stress-test before assuming the spread holds.
Location & tenants
- Location reads 78/100 on livability (#26 in NC, #2,502 nationally) — a middle-class / working-renter tenant base. Strengths: amenities A+, commute A+, housing A+; Watch: schools D+, crime F.
- Charlotte-Mecklenburg Schools (urban): math 42% / reading 46% proficiency, ranked #85 of 178 in NC (top 48%) — families likely to look elsewhere, expect single-tenant / working-renter base with shorter leases.
- Market conditions: Rents flat; 177 active listings in the ZIP; 40 comparable units currently listed for rent nearby; rentals leasing fast (median 8d on market — plan ~1-2 weeks tenant-placement turnaround); 11,969 units permitted in Mecklenburg County in 2024 (5,377 in 5+ unit buildings).
- This rent runs 34% of the median local income ($64k/yr) — at the standard rent-burdened threshold; future hikes will face affordability resistance.
Forward outlook
- Local home prices are declining (-3.0%/yr); year-one equity from $2k of loan paydown is wiped out by about $7k of value loss. Plan a longer hold.
- Mecklenburg County population projected at +53% by 2050 — long-run rental-demand tailwind backs the buy-and-hold thesis.
Negotiation context
- Only 4 days on market — expect competitive offers; lowballing is unlikely to land.
- Current owner paid $55k; list at $225k implies a 309% gain — meaningful room to come down on a strong offer.
Risks & watch-outs
- Watch-outs: built in 1958 — expect roof / HVAC / electrical / plumbing capex.
- Climate carrying-cost: major wind risk, 27% chance of damaging wind over 30y; extreme-heat days projected 7→17/yr by 2055 (HVAC capex compounding) — expect insurance premiums to compound above CPI over the hold.
Questions for the listing agent
- What do current leases actually rent for vs. the listed asking? Can we see a recent rent roll and the last 12 months of T-12 income?
- Built in 1958 — when were the roof, HVAC, electrical panel, plumbing, and water heater last replaced?
- Is there a deadline driving the sale (1031 exchange, divorce, estate, relocation)? That informs how much negotiation room exists.
- Schools are D-rated, which usually means shorter tenancies and higher turnover. Who's the typical renter profile here, and what's been the actual vacancy rate?
- Crime grade is F in this area — have there been break-ins, vandalism, or insurance claims at this property in the last 3 years? What carrier currently insures it and at what premium?
- The area grade is low — what's the realistic commute time and amenity access for the typical tenant pool here? Any planned neighborhood developments (good or bad) we should know about?
- What's the average days-on-market for RENTAL listings here right now (not sales)? A rising rental-DOM trend means longer vacancies and softer asking-rent achievability than the comps imply.
- What's the recent tenant-quality profile in this submarket — average credit score on applications, eviction rate, late-payment / NSF rate, and stable-employment percentage? A property-management company in the area should have these aggregated.
- How much new for-sale + rental construction is in the pipeline within 1–3 miles? Heavy new supply typically softens prices + rents 12–24 months out; constrained supply supports both.
Investment metrics
- 1% rule
- 0.80% ✗
- Cap rate
- 6.27%
- Cash-on-cash
- -0.08%
- DSCR
- 1.00
- GRM
- 10.4
CMA / ARV
- ARV (on-the-fly)
- $329,840
- Comps found
- 12
Show comp detail 12 sales within ~0.75 mi
| Address | Dist | Beds/Ba | Sqft | Sold | Price | $/sf | Match |
|---|---|---|---|---|---|---|---|
| 1100 Rollingwood Dr | 0.18mi | 3/1.0 (+1) | 1,069 (-2%) | 4mo | $325,000 | $304 | 81 |
| 1221 Rollingwood Dr | 0.14mi | 3/2.0 (+1) | 1,096 (+1%) | 3mo | $365,000 | $333 | 80 |
| 3701 Lynette Ct | 0.09mi | 3/2.0 (+1) | 1,119 (+3%) | 2mo | $357,000 | $319 | 80 |
| 1033 Rollingwood Dr | 0.22mi | 3/1.5 (+1) | 1,055 (-3%) | 10mo | $260,000 | $246 | 70 |
| 3774 Seaman Dr | 0.14mi | 3/1.0 (+1) | 1,005 (-7%) | 11mo | $245,000 | $244 | 66 |
| 3514 Archer Ave | 0.23mi | 3/2.0 (+1) | 1,033 (-5%) | 8mo | $330,500 | $320 | 66 |
| 3915 Crestridge Dr | 0.33mi | 3/1.0 (+1) | 1,044 (-4%) | 9mo | $330,000 | $316 | 66 |
| 1026 Rollingwood Dr | 0.22mi | 3/2.0 (+1) | 1,191 (+10%) | 1mo | $431,000 | $362 | 64 |
| 1527 Wickham Ln | 0.54mi | 3/1.0 (+1) | 1,125 (+4%) | 9mo | $200,000 | $178 | 57 |
| 2984 Shady Ln | 0.65mi | 3/1.0 (+1) | 1,147 (+6%) | 2mo | $271,000 | $236 | 54 |
| 3720 Blandwood Dr | 0.32mi | 3/2.0 (+1) | 1,183 (+9%) | 10mo | $225,000 | $190 | 53 |
| 2942 Reid Ave | 0.61mi | 3/1.0 (+1) | 1,160 (+7%) | 8mo | $130,000 | $112 | 48 |
Match score weights: distance 35% · size 25% · config 20% · recency 20%. Top-matched comps best support the ARV.
Projected returns pro-forma
-3.0% appreciation · 0.04% rent growth · sell at horizon
- IRR
- -19.6%
- Equity multiple
- 0.33×
- Total profit
- $-41,980
- Equity at exit
- $33,548
- IRR
- -19.5%
- Equity multiple
- 0.09×
- Total profit
- $-57,242
- Equity at exit
- $19,454
Cash invested: $63,000 (down + closing). Projections, not guarantees.
Landlord ↔ Tenant lean methodology
- Overall (STATE)
- 85 Strongly Landlord-Friendly
- State North Carolina
- 85 Strongly Landlord-Friendly · R+3
- County
- — inherits STATE
- City
- — inherits STATE
ZIP-level market 28217
- Home prices YoY
- -14.8%
- Rents YoY
- 0.0%
- Active inventory
- 177
- Price-to-rent
- 10.4×
Monthly cashflow live
- Estimated rent
- $1,800 high interval (Pro) →
- Mortgage (P&I)
- −$1,180
- Tax from tax record
- −$152 /mo · $1,829/yr
- Insurance
- −$94
- HOA
- −$0
- Vacancy / Maint / Mgmt
- −$378
- Net cashflow
- $-4
Break-even live
UW: 25.0% down · 7.5% · 30yr · 1.5% tax · 5.0% vac · 8.0% maint · 8.0% mgmt
Financing live
Cash to close
- Down payment
- $56,250
- Closing costs
- $6,750
- Reserves months
- —
- Total cash needed
- —
Loan-product check · same deal, 3 products live
Conventional
25% down · 7.5% · 30yr
- Down + closing
- —
- Monthly P&I
- —
- Monthly cashflow
- —
- DSCR
- —
- Eligible?
- —
Personal DTI + credit; lowest rate.
DSCR
20% down · 8.5% · 30yr
- Down + closing
- —
- Monthly P&I
- —
- Monthly cashflow
- —
- DSCR
- —
- Eligible?
- —
No personal income docs; deal must DSCR.
Hard money
10% down · 12.0% · 12mo
- Down + closing
- —
- Monthly P&I
- —
- Monthly cashflow
- —
- DSCR
- —
- Eligible?
- —
Short-term bridge; refi at stabilization.
Rent comps 40 comps
| Address | Beds | Baths | Sqft | Rent | $/sqft | DOM | Units | Dist |
|---|---|---|---|---|---|---|---|---|
| 1040 Clanton Rd Charlotte, NC | 3.0 | 1.0 | 1025 | $1,900 | $1.85 | 7d | 1 | 0.15mi |
| 3924 Broadview Dr Charlotte, NC | 3.0 | 1.0 | 1253 | $1,795 | $1.43 | 14d | 1 | 0.25mi |
| 3103 Ross Ave Charlotte, NC | 3.0 | 2.0 | 1400 | $1,800 | $1.29 | 16d | 1 | 0.40mi |
| 3128 Ridge Ave Charlotte, NC | 2.0 | 1.0 | 704 | $1,350 | $1.92 | 23d | 1 | 0.47mi |
| 1227 Pressley Rd Charlotte, NC | 1.0–3.0 | 1.0 | 657 | $1,280 | $1.95 | 3d | 19 | 0.56mi |
| 2942 Reid Ave Charlotte, NC | 3.0 | 2.0 | 1142 | $2,000 | $1.75 | 17d | 1 | 0.64mi |
| 2909 Burgess Dr Unit 2917-2 Charlotte, NC | 2.0 | 1.5 | 954 | $1,300 | $1.36 | 14d | 1 | 0.78mi |
| 2909 Burgess Dr Unit 2909-4 Charlotte, NC | 2.0 | 1.5 | 954 | $1,295 | $1.36 | 23d | 1 | 0.78mi |
| 2909 Burgess Dr Unit 2917-1 Charlotte, NC | 2.0 | 1.5 | 954 | $1,195 | $1.25 | 23d | 1 | 0.78mi |
| 2805 McCombs St Charlotte, NC | 2.0 | 1.0 | 884 | $1,700 | $1.92 | 17d | 1 | 0.82mi |
| 2005 Empire St Charlotte, NC | 2.0 | 1.0–2.0 | 875 | $2,439 | $2.79 | 4d | 104 | 0.88mi |
| 3310 S Tryon St Charlotte, NC | 1.0–3.0 | 1.0–2.0 | 1045 | $2,170 | $2.08 | 2d | 16 | 1.00mi |
| 1601 Dewberry Ter Charlotte, NC | 3.0–4.0 | 1.0–1.5 | 1100 | $1,349 | $1.23 | 3d | 11 | 1.03mi |
| 1701 West Blvd Charlotte, NC | 3.0 | 1.5 | 864 | $1,375 | $1.59 | 23d | 1 | 1.03mi |
| 1701 West Blvd Unit V3 Charlotte, NC | 2.0 | 1.5 | 765 | $1,323 | $1.73 | 23d | 1 | 1.03mi |
| 3405 S Tryon St Charlotte, NC | 1.0–3.0 | 1.0–2.0 | 1056 | $2,208 | $2.09 | 2d | 66 | 1.05mi |
| 1425 Remount Rd Charlotte, NC | 1.0 | 1.0 | 825 | $875 | $1.06 | 16d | 1 | 1.09mi |
| 3615 Tryclan Dr Charlotte, NC | 2.0 | 1.0–2.0 | 993 | $3,528 | $3.55 | 1d | 31 | 1.09mi |
| 2317 Rebecca Ave Unit B Charlotte, NC | 2.0 | 1.0 | 780 | $1,100 | $1.41 | 16d | 1 | 1.13mi |
| 2317 Rebecca Ave Charlotte, NC | 3.0 | 1.0 | 997 | $1,400 | $1.40 | 23d | 1 | 1.13mi |
| 2633 Brentwood Pl Charlotte, NC | 3.0 | 2.0 | 1348 | $1,999 | $1.48 | 23d | 1 | 1.14mi |
| 2104 Cascade Pointe Blvd Charlotte, NC | 3.0 | 1.0–2.5 | 1123 | $1,943 | $1.73 | 2d | 41 | 1.14mi |
| 2425 Kingspark Dr Charlotte, NC | 2.0 | 1.0 | 757 | $1,099 | $1.45 | 23d | 6 | 1.16mi |
| 4520 Charlotte Park Dr Charlotte, NC | 3.0 | 1.0–2.0 | 996 | $2,100 | $2.11 | 3d | 51 | 1.17mi |
| 4520 Charlotte Park Dr Charlotte, NC | 2.0 | 2.0 | 1153 | $1,980 | $1.72 | 23d | 1 | 1.17mi |
| 2565 Brentwood Pl Charlotte, NC | 3.0 | 1.0 | 927 | $1,200 | $1.29 | 23d | 1 | 1.19mi |
| 300 E Peterson Dr Charlotte, NC | 2.0 | 2.0 | 910 | $1,895 | $2.08 | 4d | 1 | 1.19mi |
| 307 E Peterson Dr Charlotte, NC | 1.0 | 1.0 | 816 | $2,100 | $2.57 | 12d | 1 | 1.21mi |
| 205 Foster Ave Charlotte, NC | 4.0 | 1.0–2.0 | 641 | $2,982 | $4.65 | 2d | 36 | 1.22mi |
| 4312 Yancey Rd Charlotte, NC | 2.0 | 1.0–2.0 | 835 | $2,624 | $3.14 | 2d | 42 | 1.22mi |
| 3441 South Blvd Charlotte, NC | 2.0 | 1.0–2.0 | 868 | $2,470 | $2.84 | 1d | 9 | 1.28mi |
| 3305 South Blvd Charlotte, NC | 2.0 | 1.0–2.5 | 945 | $3,665 | $3.88 | 3d | 19 | 1.29mi |
| 2520 Brentwood Pl Charlotte, NC | 2.0 | 1.0 | 929 | $1,695 | $1.82 | 3d | 1 | 1.31mi |
| 462 New Bern Station Ct Charlotte, NC | 2.0 | 2.0 | 1088 | $1,950 | $1.79 | 23d | 1 | 1.33mi |
| 506 New Bern Station Ct Charlotte, NC | 2.0 | 2.5 | 1062 | $2,600 | $2.45 | 2d | 1 | 1.34mi |
| 2546 Perimeter Pointe Pkwy Charlotte, NC | 1.0–2.0 | 1.0–2.0 | 996 | $2,139 | $2.15 | 2d | 34 | 1.37mi |
| 7030 Parkway Commons DR Charlotte, NC | 1.0–3.0 | 1.0–2.0 | 1055 | $1,841 | $1.74 | 1d | 72 | 1.37mi |
| 4612 Gilead St Charlotte, NC | 2.0 | 1.0–2.5 | 900 | $2,683 | $2.98 | 3d | 48 | 1.39mi |
| 4015 South Blvd Charlotte, NC | 2.0 | 1.0–2.0 | 957 | $2,624 | $2.74 | 1d | 74 | 1.40mi |
| 120 Hollis Rd Charlotte, NC | 3.0 | 1.0–3.0 | 1155 | $2,946 | $2.55 | 2d | 28 | 1.41mi |
Listing history 6 events
-
2026-06-17status $225,000 Pending 4 DOM
-
2026-06-16days on market $225,000 Active 4 DOM
-
2026-06-16price $225,000 Active 3 DOM
-
2026-06-15days on market $199,990 Active 3 DOM
-
2026-06-13remarks 687-char remark
-
2026-06-13$199,990 Active 1 DOM
ⓘ Source: listings_history table (triggers on properties + properties_extension) + one-shot
backfill from property_details.listing_events for pre-trigger history.
Tax reassessment forecast NC · Resets to sale price
- Current annual tax
- $1,829 · $152/mo
- Projected year-2 tax
- $1,845 · $154/mo
- Expected delta
- +$16/yr (+$1/mo · 0.9%)
ⓘ Screening estimate from a state-policy table — verify with the county assessor before closing.
Climate risk First Street
- Flood 1/10 Low FEMA zone X (unshaded) · 0% chance over 30 yrs
- Wildfire 1/10 Low
- Heat 6/10 Major 7 d/yr ≥103°F today · 17 d/yr by 30 yrs out
- Wind 6/10 Major 27% chance of damaging wind over 30 yrs
- Air quality 3/10 Moderate 3 unhealthy d/yr today · 4 by 30 yrs out
Nearby sold comps map
Loading sold comps map…
Walkable amenities ~0.75 mi
Loading nearby amenities…
Taxation est. · year 1
- Rental income
- $21,599
- − Mortgage interest
- −$12,603
- − Property taxes
- −$1,829
- − Insurance
- −$1,125
- − Repairs & maintenance
- −$1,728
- − Management
- −$1,728
- − Depreciation
- −$6,545
- Taxable loss
- −$3,959
- Est. tax savings @ 24.0%
- +$950
- After-tax cash flow
- $901/yr
For passive investors: Depreciation is non-cash, so a rental often shows a tax loss while cash-flowing — sheltering income. Rental losses are passive: they offset passive income freely, and up to $25,000/yr can offset ordinary (W-2) income if you actively participate and your MAGI is under $100k (phasing out to $0 by $150k); unused losses carry forward. On sale, claimed depreciation is recaptured at up to 25%, and gains may owe capital-gains tax (a 1031 exchange can defer both). Figures are a year-1 estimate at your 24.0% rate — not tax advice; consult a CPA.
Schools (NCES district)
- District
- Charlotte-Mecklenburg Schools
- NCES district ID
- 3702970
- Math proficiency
- 42% ▼ -6.00%
- Reading proficiency
- 46% ▲ 1.00%
- Median HH income
- $57,175
- Composite
- 38.49/100
- National rank
- #4183
- State rank
- #85 of 178 in NC
Livability — Charlotte
- Score
- 78/100
- State rank
- #26
- US rank
- #2502
Category grades
Schools grade is shown separately in the Schools card above.
Census & demographics
- Census place
- Charlotte, NC
- County
- Mecklenburg County · 1,167,319 people
- City population
- 920,422
- Metro
- Charlotte-Concord-Gastonia, NC-SC
- Population (ZIP)
- 32,064
- Household income
- $64,028
- Rent vs Own
- Severe rent burden
- 2144.0
Population outlook (Mecklenburg County) Hauer SSP2
- Today (2025)
- 1,305,740 people
- By 2030
- 1,442,752 · +10.5%
- By 2040
- 1,722,441 · +31.9%
- By 2050
- 1,999,450 · +53.1%
- By 2075
- 2,642,495 · +102.4%
- By 2100
- 3,106,755 · +137.9%
Race, ethnicity, and origin ACS 2023
- Neighborhood character
- Highly diverse neighborhood (Simpson 0.71)
- Race & ethnicity
- Hispanic / Latino 37% Black 35% Two or more races 19% White 17% Asian 8%
- Hispanic origin (detail)
- Mexican 7% Dominican 2%
- Common ancestry
- Swiss 2% Italian 1% Slovak 1%
- Foreign-born
- 34% · Canada, Jamaica, Vietnam
- Languages at home
- 58% English-only · Spanish 35% Other Indo-European 2% Other Asian/Pacific 2%
Political lean MEDSL · Mecklenburg
- 2024 margin
- Solid D (+32.9) · D 65.6% · R 32.7% · Other 1.6%
- 2008→2024 swing
- +8.5pp toward D · 2008: 24.4pp · 2024: 32.9pp
- All cycles
- 2024: D+32.9 2020: D+35.1 2016: D+29.9 2012: D+22.5 2008: D+24.4
Not yet ingested
- Civics
- —
Market trends
- HPI YoY
- ▼ -57.23%
- Current HPI
- 330.7033
- Rent YoY
- ▬ 0.04%
- Metro
- Charlotte-Concord-Gastonia, NC-SC
- State GDP YoY
- ▲ 3.28%
- F500 in state
- 26
Industry mix (Fortune 500 HQ in NC)
| Industry | F500 HQs | Revenue |
|---|---|---|
| Financial Services | 2 | $213B |
|
||
| Retail | 2 | $95B |
|
||
| Industrial Conglomerate | 1 | $38B |
|
||
| Metals / Steel | 1 | $35B |
|
||
| Utilities | 1 | $30B |
|
||
| Industrial Machinery | 1 | $19B |
|
||
Price history
+534.9% since first listed5 events — show timeline
- 2026-06-12 Price Changed $199,990 CANOPYMLS as Distributed by MLS Grid
- 2026-06-12 Listed $19,999 CANOPYMLS as Distributed by MLS Grid
- 2018-04-13 Sold (Public Records) $55,000 Public Records
- 1988-05-01 Sold (Public Records) $42,500 Public Records
- 1982-03-01 Sold (Public Records) $31,500 Public Records
Property tax history
+5.1%/yrLatest (2025): $1,829 · +2.3% YoY. Source: county tax records.
Cash-flow waterfall
monthlySold comps — $/sqft
last 12 mo · ≤1 miLoading sold comps…