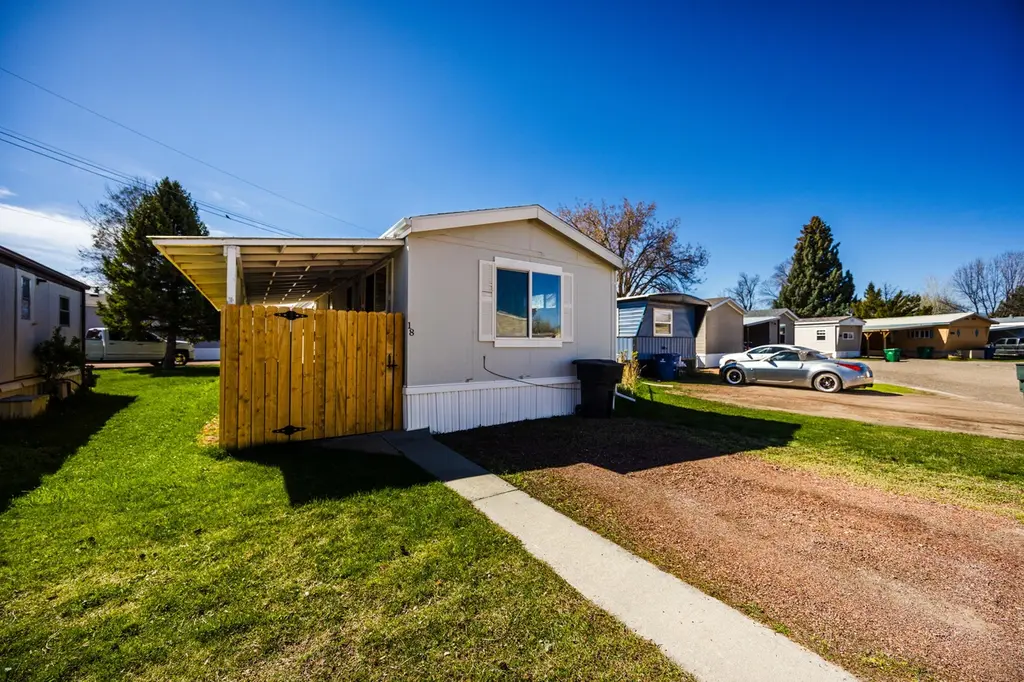
808 Avoca Ave #18 · Sheridan, WY
Flood risk 5/10 · Moderate
- FEMA flood zone
- X (unshaded)
- Chance of flooding over 30 yrs
- 0.24%
- Est. flood insurance / yr
- $507 – $1,088
Fire risk 6/10 · Moderate
- Est. fire insurance / yr
- $564 – $1,046
Heat risk 3/10 · Minor
- Hot days now (above 93°F)
- 7 days/yr
- Hot days in 30 yrs
- 16 days/yr
Wind risk 1/10 · Minimal
- Chance of severe wind over 30 yrs
- —
Air-quality risk 3/10 · Minor
- Unhealthy air days now
- 3 days/yr
- Unhealthy air days in 30 yrs
- 4 days/yr
Risk factors via First Street. Map © Google.
Why this score? — see what drove the B grade
The composite is a weighted blend of 9 inputs, each scored 0–100. Each bar is that input's sub-score; the figure is the points it added to the 100-point composite (weight × sub-score).
- Cash flow +30.0/30.0
- 1% rule +10.0/10.0
- DSCR +10.0/10.0
- ARV discount +9.2/15.0
- Schools +5.9/10.0
- Livability +4.0/5.0
- Rent growth +2.5/5.0
- Condition / age +2.2/5.0
- Appreciation +0.0/10.0
$69,000
🖨 Deal sheet (PDF) 📄 Offer letter ✓ Due diligence
Listing remarks MLS
Beautiful, clean and move in ready! Offering 2 bedrooms and one bath, this mobile home has received numerous recent updates including a new roof and is centrally located to downtown Sheridan and Coffeen Avenue. All measurements approximate.
Key facts
- Built 2002
- Listed 54 days
Neighborhood map
What this means for you Summary
Snapshot
- This is a 2-bed/1.0-bath single-family listed at $69k. Condition is rated fair.
Deal economics
- At list price, monthly cash flow is $746 ($9k/yr) — positive.
- The deal already cash-flows at list — no discount required.
- Meets the 1% rule at list price ($2k rent vs $69k).
- Recommended offer: $67k (3.0% below list) — sets the bar for market timing.
- Cap rate 19.3% vs local median 2.4% in Sheridan — top-decile yield for the area; either an underpriced asset or a hidden risk that comps aren't pricing in. Stress-test before assuming the spread holds.
Location & tenants
- Location reads 79/100 on livability (#7 in WY, #2,337 nationally) — a middle-class / working-renter tenant base. Strengths: cost of living A+, health & safety A+, crime A; Watch: amenities C-, employment C-, commute F.
- Sheridan County School District #2 (town): math 68% / reading 72% proficiency, ranked #1 of 41 in WY (top 2%) — strong family-tenant draw, lease renewals of 3-5y typical.
- Market conditions: 509 active listings in the ZIP; 309 units permitted in Sheridan County in 2024 (92 in 5+ unit buildings).
Forward outlook
- Local home prices are declining (-3.0%/yr); year-one equity from $477 of loan paydown is wiped out by about $2k of value loss. Plan a longer hold.
- Sheridan County population projected at +8% by 2050 — modest demand growth; plan on rents tracking national, not racing it.
- At projected returns (-3.0% appreciation + 3.0% rent growth), your $19k cash investment doubles in ~3 years — after that, you're playing with house money.
Negotiation context
- It's been on market 55 days — a 3% lower offer ($67k) is reasonable based on typical stale-listing flexibility.
- 4 sale attempts since 7y ago with the ask held roughly flat each time — persistent listings suggest the price (not the market) is what's stuck; bring a comps-based counter.
Risks & watch-outs
- Climate carrying-cost: moderate flood risk; major wildfire risk — expect insurance premiums to compound above CPI over the hold.
Questions for the listing agent
- It's been on market 55 days. Have you received any prior offers? Is the seller open to a 3% concession, seller financing, or rate buy-down credit?
- Have any recent inspections been done? Can we get a copy of the seller's disclosures and any deferred-maintenance estimates?
- Is there a deadline driving the sale (1031 exchange, divorce, estate, relocation)? That informs how much negotiation room exists.
- Schools are B-rated — typically a magnet for longer-tenancy family renters. What's the average tenant stay here, and is there a school-zone premium baked into asking?
- What's the average days-on-market for RENTAL listings here right now (not sales)? A rising rental-DOM trend means longer vacancies and softer asking-rent achievability than the comps imply.
- What's the recent tenant-quality profile in this submarket — average credit score on applications, eviction rate, late-payment / NSF rate, and stable-employment percentage? A property-management company in the area should have these aggregated.
- How much new for-sale + rental construction is in the pipeline within 1–3 miles? Heavy new supply typically softens prices + rents 12–24 months out; constrained supply supports both.
Investment metrics
- 1% rule
- 2.24% ✓
- Cap rate
- 19.27%
- Cash-on-cash
- 46.36%
- DSCR
- 3.06
- GRM
- 3.7
CMA / ARV
- ARV (median comp)
- $71,750
- List price
- $69,000
- Delta
- -3.83%
- Verdict
- FAIR
- Comps
- 8 within 1.0 mi
Show comp detail 12 sales within ~0.75 mi
| Address | Dist | Beds/Ba | Sqft | Sold | Price | $/sf | Match |
|---|---|---|---|---|---|---|---|
| 906 S Sheridan Ave | 0.39mi | 2/1.0 | 938 (-2%) | 16mo | $268,900 | $287 | 65 |
| 955 Illinois St | 0.37mi | 2/1.0 | 960 (0%) | 22mo | $322,000 | $335 | 65 |
| 704 Emerson St | 0.58mi | 2/1.0 | 924 (-4%) | 4mo | $260,000 | $281 | 64 |
| 833 Sumner St | 0.54mi | 2/1.0 | 912 (-5%) | 8mo | $135,000 | $148 | 60 |
| 626 Sumner St | 0.69mi | 2/1.0 | 912 (-5%) | 6mo | $257,000 | $282 | 54 |
| 255 Brock Ave | 0.33mi | 3/1.0 (+1) | 1,068 (+11%) | 13mo | $325,000 | $304 | 50 |
| 18 W Nebraska St | 0.66mi | 3/2.0 (+1) | 970 (+1%) | 13mo | $252,000 | $260 | 48 |
| 957 Emerson St | 0.42mi | 2/1.0 | 1,081 (+13%) | 14mo | $295,000 | $273 | 48 |
| 1553 Warren Ave | 0.70mi | 2/1.0 | 864 (-10%) | 4mo | $321,000 | $372 | 48 |
| 660 Canby St | 0.52mi | 3/1.0 (+1) | 1,040 (+8%) | 11mo | $285,000 | $274 | 47 |
| 1120 Illinois St | 0.33mi | 3/1.0 (+1) | 1,092 (+14%) | 12mo | $315,000 | $288 | 47 |
| 1024/1036 S Main St | 0.60mi | 2/2.0 | 855 (-11%) | 12mo | $449,000 | $525 | 39 |
Match score weights: distance 35% · size 25% · config 20% · recency 20%. Top-matched comps best support the ARV.
Projected returns pro-forma
-3.0% appreciation · 3.0% rent growth · sell at horizon
- IRR
- 43.6%
- Equity multiple
- 2.88×
- Total profit
- $36,378
- Equity at exit
- $10,288
- IRR
- 49.6%
- Equity multiple
- 5.81×
- Total profit
- $92,981
- Equity at exit
- $5,966
Cash invested: $19,320 (down + closing). Projections, not guarantees.
Landlord ↔ Tenant lean methodology
- Overall (STATE)
- 90 Strongly Landlord-Friendly
- State Wyoming
- 90 Strongly Landlord-Friendly · R+25
- County
- — inherits STATE
- City
- — inherits STATE
ZIP-level market 82801
- Active inventory
- 509
- Price-to-rent
- 3.7×
Monthly cashflow live
- Estimated rent
- $1,548 medium interval (Pro) →
- Mortgage (P&I)
- −$362
- Tax est. 1.5%
- −$86 /mo · $1,035/yr
- Insurance
- −$29
- HOA
- −$0
- Vacancy / Maint / Mgmt
- −$325
- Net cashflow
- $746
Break-even live
Sensitivity live
| Price | -10% $794 | -5% $770 | +0% $746 | +5% $723 | +10% $699 |
|---|---|---|---|---|---|
| Rent | -10% $624 | -5% $685 | +0% $746 | +5% $808 | +10% $869 |
| Rate | -1.0pp $781 | -0.5pp $764 | base $746 | +0.5pp $728 | +1.0pp $710 |
UW: 25.0% down · 7.5% · 30yr · 1.5% tax · 5.0% vac · 8.0% maint · 8.0% mgmt
Financing live
Cash to close
- Down payment
- $17,250
- Closing costs
- $2,070
- Reserves months
- —
- Total cash needed
- —
Loan-product check · same deal, 3 products live
Conventional
25% down · 7.5% · 30yr
- Down + closing
- —
- Monthly P&I
- —
- Monthly cashflow
- —
- DSCR
- —
- Eligible?
- —
Personal DTI + credit; lowest rate.
DSCR
20% down · 8.5% · 30yr
- Down + closing
- —
- Monthly P&I
- —
- Monthly cashflow
- —
- DSCR
- —
- Eligible?
- —
No personal income docs; deal must DSCR.
Hard money
10% down · 12.0% · 12mo
- Down + closing
- —
- Monthly P&I
- —
- Monthly cashflow
- —
- DSCR
- —
- Eligible?
- —
Short-term bridge; refi at stabilization.
Listing history 19 events
-
2026-06-15days on market $69,000 Active 55 DOM
-
2026-06-14days on market $69,000 Active 53 DOM
-
2026-06-12days on market $69,000 Active 52 DOM
-
2026-06-09days on market $69,000 Active 49 DOM
-
2026-06-08days on market $69,000 Active 48 DOM
-
2026-06-07days on market $69,000 Active 47 DOM
-
2026-06-05days on market $69,000 Active 45 DOM
-
2026-06-03days on market $69,000 Active 43 DOM
-
2026-06-02days on market $69,000 Active 42 DOM
-
2026-06-01days on market $69,000 Active 41 DOM
-
2026-05-31days on market $69,000 Active 40 DOM
-
2026-05-30days on market $69,000 Active 39 DOM
-
2026-04-21$69,000 Active 240-char remark
Show marketing remark (240 chars)
Beautiful, clean and move in ready! Offering 2 bedrooms and one bath, this mobile home has received numerous recent updates including a new roof and is centrally located to downtown Sheridan and Coffeen Avenue. All measurements approximate.
-
2023-04-28soldstatus 371-char remark
Show marketing remark (371 chars)
Well kept 2002 Maro Mobile Home. Two bedroom, one bathroom with appliances. Primary bedroom has two closets! Great location within walking distance to shopping, restaurants, elementary school and much more. NO REAL ESTATE Mobile Home only 2002 Maro 16'x60' VIN H020490. Taxes are for mobile home only. Park manager approval is required. All measurements are approximate.
-
2023-02-27$52,000 371-char remark
Show marketing remark (371 chars)
Well kept 2002 Maro Mobile Home. Two bedroom, one bathroom with appliances. Primary bedroom has two closets! Great location within walking distance to shopping, restaurants, elementary school and much more. NO REAL ESTATE Mobile Home only 2002 Maro 16'x60' VIN H020490. Taxes are for mobile home only. Park manager approval is required. All measurements are approximate.
-
2019-07-08soldstatus
-
2019-06-21$35,000
-
2019-03-13soldstatus
-
2019-02-23$28,000
ⓘ Source: listings_history table (triggers on properties + properties_extension) + one-shot
backfill from property_details.listing_events for pre-trigger history.
Climate risk First Street
- Flood 5/10 Major FEMA zone X (unshaded) · 24% chance over 30 yrs
- Wildfire 6/10 Major
- Heat 3/10 Moderate 7 d/yr ≥93°F today · 16 d/yr by 30 yrs out
- Wind 1/10 Low
- Air quality 3/10 Moderate 3 unhealthy d/yr today · 4 by 30 yrs out
Nearby sold comps map
Loading sold comps map…
Walkable amenities ~0.75 mi
Loading nearby amenities…
Taxation est. · year 1
- Rental income
- $18,580
- − Mortgage interest
- −$3,865
- − Property taxes
- −$1,035
- − Insurance
- −$345
- − Repairs & maintenance
- −$1,486
- − Management
- −$1,486
- − Depreciation
- −$2,007
- Taxable income
- $8,355
- Est. tax owed @ 24.0%
- −$2,005
- After-tax cash flow
- $6,951/yr
For passive investors: Depreciation is non-cash, so a rental often shows a tax loss while cash-flowing — sheltering income. Rental losses are passive: they offset passive income freely, and up to $25,000/yr can offset ordinary (W-2) income if you actively participate and your MAGI is under $100k (phasing out to $0 by $150k); unused losses carry forward. On sale, claimed depreciation is recaptured at up to 25%, and gains may owe capital-gains tax (a 1031 exchange can defer both). Figures are a year-1 estimate at your 24.0% rate — not tax advice; consult a CPA.
Condition & rehab AI · 12 photos
This mobile home requires moderate repairs and maintenance to improve its condition and increase its value.
Repairs flagged
- Minor exterior siding — some wear
- Minor interior walls — light scuff marks
- Minor landscaping — overgrown areas
Value-add opportunities
- Resale paint interior walls — fresh paint enhances curb appeal
- Resale repair exterior siding — improved exterior enhances curb appeal
- Both landscaping — improved landscaping enhances curb appeal and adds value
Renovation cost estimate screening
| Repair item | Severity | Est. cost |
|---|---|---|
| exterior siding · some wear | Minor | $500–3,000 |
| interior walls · light scuff marks | Minor | $500–3,000 |
| landscaping · overgrown areas | Minor | $500–3,000 |
| Total estimated repair cost · 3 items | $1,500–9,000 |
Value-add ROI direction
- Resale paint interior walls — fresh paint enhances curb appeal ↑
- Resale repair exterior siding — improved exterior enhances curb appeal ↑
- Both landscaping — improved landscaping enhances curb appeal and adds value ↑
ⓘ Cost ranges are severity-bucket heuristics (US national rule-of-thumb). Get contractor quotes + a written scope before underwriting a rehab budget.
Schools (NCES district)
- District
- Sheridan County School District #2
- NCES district ID
- 5605695
- Math proficiency
- 68% ▼ -4.00%
- Reading proficiency
- 72% ▼ -3.00%
- Median HH income
- $50,902
- Composite
- 59.44/100
- National rank
- #923
- State rank
- #1 of 41 in WY
Livability — Sheridan
- Score
- 79/100
- State rank
- #7
- US rank
- #2337
Category grades
Schools grade is shown separately in the Schools card above.
Census & demographics
- Census place
- Sheridan, WY
- County
- Sheridan County · 26,310 people
- City population
- 26,310
- Metro
- Sheridan, WY
- Population (ZIP)
- 26,310
- Household income
- $73,213
- Rent vs Own
- Severe rent burden
- 742.0
Population outlook (Sheridan County) Hauer SSP2
- Today (2025)
- 32,048 people
- By 2030
- 32,834 · +2.5%
- By 2040
- 33,843 · +5.6%
- By 2050
- 34,744 · +8.4%
- By 2075
- 37,231 · +16.2%
- By 2100
- 37,261 · +16.3%
Race, ethnicity, and origin ACS 2023
- Neighborhood character
- Predominantly White (88%)
- Race & ethnicity
- White 88% Hispanic / Latino 5% Two or more races 4% Native American 1% Asian 1%
- Hispanic origin (detail)
- Mexican 4%
- Common ancestry
- Portuguese 5% Slovak 4% Italian 2%
- Foreign-born
- 2% · Canada
- Languages at home
- 97% English-only · Spanish 2%
Political lean MEDSL · Sheridan
- 2024 margin
- Solid R (+50.1) · D 24.2% · R 74.2% · Other 1.6%
- 2008→2024 swing
- -11.9pp toward R · 2008: -38.2pp · 2024: -50.1pp
- All cycles
- 2024: R+50.1 2020: R+47.5 2016: R+51.7 2012: R+46.8 2008: R+38.2
Not yet ingested
- Civics
- —
Market trends
- HPI YoY
- ▼ -194.82%
- Current HPI
- 190.3135
- Rent YoY
- —
- Metro
- Sheridan, WY
- State GDP YoY
- —
- F500 in state
- 0
Price history
+146.4% since first listed7 events — show timeline
- 2026-04-21 Listed $69,000 SBORWY
- 2023-04-28 Sold (MLS) — SBORWY
- 2023-02-27 Listed $52,000 SBORWY
- 2019-07-08 Sold (MLS) — SBORWY
- 2019-06-21 Listed $35,000 SBORWY
- 2019-03-13 Sold (MLS) — SBORWY
- 2019-02-23 Listed $28,000 SBORWY
Cash-flow waterfall
monthlySold comps — $/sqft
last 12 mo · ≤1 miLoading sold comps…