3348 Head River Rd · Virginia Beach, VA
Flood risk 7/10 · Major
- FEMA flood zone
- X (unshaded)
- Chance of flooding over 30 yrs
- 0.96%
- Est. flood insurance / yr
- $507 – $1,088
Fire risk 5/10 · Moderate
- Est. fire insurance / yr
- $666 – $1,236
Heat risk 9/10 · Severe
- Hot days now (above 104°F)
- 7 days/yr
- Hot days in 30 yrs
- 17 days/yr
Wind risk 8/10 · Major
- Chance of severe wind over 30 yrs
- 98.0%
Air-quality risk 1/10 · Minimal
- Unhealthy air days now
- 0 days/yr
- Unhealthy air days in 30 yrs
- 0 days/yr
Risk factors via First Street. Map © Google.
Why this score? — see what drove the B grade
The composite is a weighted blend of 9 inputs, each scored 0–100. Each bar is that input's sub-score; the figure is the points it added to the 100-point composite (weight × sub-score).
- Cash flow +30.0/30.0
- 1% rule +10.0/10.0
- DSCR +10.0/10.0
- ARV discount +7.5/15.0
- Schools +6.4/10.0
- Livability +4.2/5.0
- Rent growth +2.5/5.0
- Condition / age +2.5/5.0
- Appreciation +0.0/10.0
$100,000
🖨 Deal sheet 📄 Offer letter ✓ Due diligence
Listing remarks
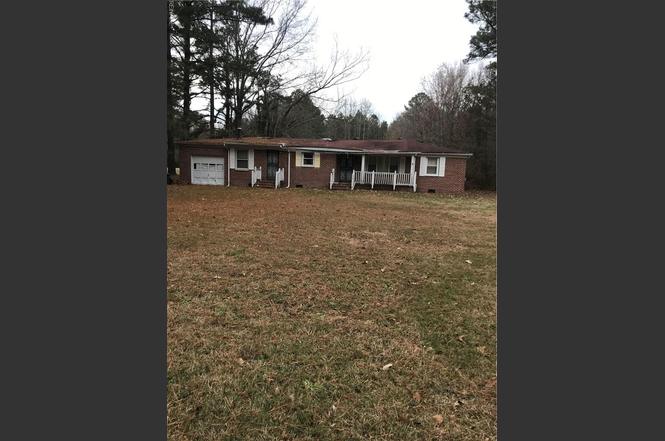
If country living is what you're looking for checkout this 3 bedroom 1 bath brick rancher out. Sitting on 1 acre lot zoned AG2. Fixer upper AS-IS-WHERE-IS Seller to make no repairs.
Key facts
- 1 acre lot
- Garage
- Built 1940
Property features AI
Finance
- Other: Property listed as fixer upper
- HOA & community: No HOA fees
Exterior
- Parking: Driveway spaces; Detached garage (approx. 348 sq ft)
- Utilities: Well water; Septic sewer; Electric water heater
- Home design: Detached home; Ranch/Traditional style; One story with one living level; Crawl foundation
- Construction: Brick siding; Asphalt shingle roof
- Exterior features: Wooded lot
Interior
- Bedrooms: Bedroom and full bathroom on the first floor; Total of 7 rooms
- Flooring: Carpet; Ceramic; Vinyl
- Bathrooms: 1 full bathroom
- Heating & cooling: Oil heating; Central air conditioning
- Interior features: Decorative fireplace
- Laundry & utility: Washer hookup; Dryer hookup
Neighborhood map
What this means for you Summary
Snapshot
- This is a 3-bed/1.0-bath single-family listed at $100k.
Deal economics
- At list price, monthly cash flow is $2k ($20k/yr) — positive.
- The deal already cash-flows at list — no discount required.
- Meets the 1% rule at list price ($3k rent vs $100k).
- Recommended offer: $88k (12.0% below list) — sets the bar for market timing.
- Cap rate 27.3% vs local median 3.5% in Virginia Beach — top-decile yield for the area; either an underpriced asset or a hidden risk that comps aren't pricing in. Stress-test before assuming the spread holds.
Location & tenants
- Location reads 83/100 on livability (#38 in VA, #880 nationally) — a professional / high-income tenant draw. Strengths: amenities A+, employment A+, housing A+; Watch: cost of living C-, commute F.
- Va Beach City Public School District (urban): math 69% / reading 78% proficiency, ranked #10 of 131 in VA (top 8%) — strong family-tenant draw, lease renewals of 3-5y typical.
- Zoned schools: Creeds Elementary (math 62% / reading 87%, grade A, #220 of 1,108 statewide, top 22%, 315 students, 21% FRL); Kempsville High (math 73% / reading 78%, grade A-, #105 of 319 statewide, top 33%, 2,006 students, 42% FRL) — zoned schools at 32% FRL track the district average.
- Market conditions: 63 active listings in the ZIP; 666 units permitted in Virginia Beach city in 2024 (347 in 5+ unit buildings).
Forward outlook
- Local home prices are declining (-3.0%/yr); year-one equity from $691 of loan paydown is wiped out by about $3k of value loss. Plan a longer hold.
- Virginia Beach County population projected at +6% by 2050 — modest demand growth; plan on rents tracking national, not racing it.
- At projected returns (-3.0% appreciation + 3.0% rent growth), your $28k cash investment doubles in ~2 years — after that, you're playing with house money.
Negotiation context
- It's been on market 153 days — a 12% lower offer ($88k) is reasonable based on typical stale-listing flexibility.
Risks & watch-outs
- Watch-outs: flood insurance adds $66/mo; built in 1940 — expect roof / HVAC / electrical / plumbing capex.
- Climate carrying-cost: major flood risk; severe wind risk, 98% chance of damaging wind over 30y; moderate wildfire risk; extreme-heat days projected 7→17/yr by 2055 (HVAC capex compounding) — expect insurance premiums to compound above CPI over the hold.
Questions for the listing agent
- It's been on market 153 days. Have you received any prior offers? Is the seller open to a 12% concession, seller financing, or rate buy-down credit?
- Built in 1940 — when were the roof, HVAC, electrical panel, plumbing, and water heater last replaced?
- What's the actual annual flood-insurance premium (NFIP or private), and is the property in a SFHA with mandatory coverage?
- Why hasn't it sold? Are there any deal-killer items the seller is aware of (foundation, flood, title, zoning, code violations)?
- Is there a deadline driving the sale (1031 exchange, divorce, estate, relocation)? That informs how much negotiation room exists.
- Schools are A-rated — typically a magnet for longer-tenancy family renters. What's the average tenant stay here, and is there a school-zone premium baked into asking?
- What's the average days-on-market for RENTAL listings here right now (not sales)? A rising rental-DOM trend means longer vacancies and softer asking-rent achievability than the comps imply.
- What's the recent tenant-quality profile in this submarket — average credit score on applications, eviction rate, late-payment / NSF rate, and stable-employment percentage? A property-management company in the area should have these aggregated.
- How much new for-sale + rental construction is in the pipeline within 1–3 miles? Heavy new supply typically softens prices + rents 12–24 months out; constrained supply supports both.
Investment metrics
- 1% rule
- 3.09% ✓
- Cap rate
- 27.31%
- Cash-on-cash
- 75.08%
- DSCR
- 4.34
- GRM
- 2.7
CMA / ARV
- ARV (on-the-fly)
- $421,800
- Comps found
- 2
Show comp detail 2 sales within ~0.75 mi
| Address | Dist | Beds/Ba | Sqft | Sold | Price | $/sf | Match |
|---|---|---|---|---|---|---|---|
| 3232 Head River Rd | 0.37mi | 4/2.0 (+1) | 1,435 (+1%) | 3mo | $425,000 | $296 | 70 |
| 3452 Head River Rd | 0.38mi | 3/1.0 | 1,300 (-9%) | 1mo | $140,000 | $108 | 67 |
Match score weights: distance 35% · size 25% · config 20% · recency 20%. Top-matched comps best support the ARV.
Projected returns pro-forma
-3.0% appreciation · 3.0% rent growth · sell at horizon
- IRR
- 71.9%
- Equity multiple
- 4.26×
- Total profit
- $91,221
- Equity at exit
- $14,910
- IRR
- 75.8%
- Equity multiple
- 8.79×
- Total profit
- $217,996
- Equity at exit
- $8,646
Cash invested: $28,000 (down + closing). Projections, not guarantees.
Landlord ↔ Tenant lean methodology
- Overall (STATE)
- 55 Moderately Landlord-Leaning
- State Virginia
- 55 Moderately Landlord-Leaning · D+2
- County
- — inherits STATE
- City
- — inherits STATE
ZIP-level market 23457
- Home prices YoY
- -7.2%
- Active inventory
- 63
- Price-to-rent
- 2.7×
Monthly cashflow live
- Estimated rent
- $3,087 medium interval (Pro) →
- Mortgage (P&I)
- −$524
- Tax from tax record
- −$121 /mo · $1,448/yr
- Insurance
- −$42
- Flood insurance flood zone
- −$66 /mo · $798/yr
- HOA
- −$0
- Vacancy / Maint / Mgmt
- −$648
- Net cashflow
- $1,685
Break-even live
UW: 25.0% down · 7.5% · 30yr · 1.5% tax · 5.0% vac · 8.0% maint · 8.0% mgmt
Financing live
Cash to close
- Down payment
- $25,000
- Closing costs
- $3,000
- Reserves months
- —
- Total cash needed
- —
Loan-product check · same deal, 3 products live
Conventional
25% down · 7.5% · 30yr
- Down + closing
- —
- Monthly P&I
- —
- Monthly cashflow
- —
- DSCR
- —
- Eligible?
- —
Personal DTI + credit; lowest rate.
DSCR
20% down · 8.5% · 30yr
- Down + closing
- —
- Monthly P&I
- —
- Monthly cashflow
- —
- DSCR
- —
- Eligible?
- —
No personal income docs; deal must DSCR.
Hard money
10% down · 12.0% · 12mo
- Down + closing
- —
- Monthly P&I
- —
- Monthly cashflow
- —
- DSCR
- —
- Eligible?
- —
Short-term bridge; refi at stabilization.
Listing history 3 events
-
2026-05-19status Under Contract
-
2025-12-18historical Active Under Contract
-
2025-12-17$100,000 Active
ⓘ Source: listings_history table (triggers on properties + properties_extension) + one-shot
backfill from property_details.listing_events for pre-trigger history.
Tax reassessment forecast VA · Resets to sale price
- Current annual tax
- $1,448 · $121/mo
- Projected year-2 tax
- $1,448 · $121/mo
- Expected delta
- $0/yr ($0/mo · 0.0%)
ⓘ Screening estimate from a state-policy table — verify with the county assessor before closing.
Climate risk First Street
- Flood 7/10 Severe FEMA zone X (unshaded) · 96% chance over 30 yrs
- Wildfire 5/10 Major
- Heat 9/10 Extreme 7 d/yr ≥104°F today · 17 d/yr by 30 yrs out
- Wind 8/10 Severe 98% chance of damaging wind over 30 yrs
- Air quality 1/10 Low 0 unhealthy d/yr today · 0 by 30 yrs out
Nearby sold comps map
Loading sold comps map…
Walkable amenities ~0.75 mi
Loading nearby amenities…
Taxation est. · year 1
- Rental income
- $37,041
- − Mortgage interest
- −$5,602
- − Property taxes
- −$1,448
- − Insurance
- −$1,298
- − Repairs & maintenance
- −$2,963
- − Management
- −$2,963
- − Depreciation
- −$2,909
- Taxable income
- $19,858
- Est. tax owed @ 24.0%
- −$4,766
- After-tax cash flow
- $15,458/yr
For passive investors: Depreciation is non-cash, so a rental often shows a tax loss while cash-flowing — sheltering income. Rental losses are passive: they offset passive income freely, and up to $25,000/yr can offset ordinary (W-2) income if you actively participate and your MAGI is under $100k (phasing out to $0 by $150k); unused losses carry forward. On sale, claimed depreciation is recaptured at up to 25%, and gains may owe capital-gains tax (a 1031 exchange can defer both). Figures are a year-1 estimate at your 24.0% rate — not tax advice; consult a CPA.
Schools (NCES district)
- District
- Va Beach City Public School District
- NCES district ID
- 5103840
- Math proficiency
- 69% ▼ -19.00%
- Reading proficiency
- 78% ▼ -7.00%
- Median HH income
- $66,452
- Composite
- 63.81/100
- National rank
- #594
- State rank
- #10 of 131 in VA
Livability — Virginia Beach
- Score
- 83/100
- State rank
- #38
- US rank
- #880
Category grades
Schools grade is shown separately in the Schools card above.
Census & demographics
- Census place
- Virginia Beach, VA
- City population
- 448,227
- Population (ZIP)
- 4,927
Population outlook (Virginia Beach County) Hauer SSP2
- Today (2025)
- 480,401 people
- By 2030
- 491,221 · +2.3%
- By 2040
- 504,882 · +5.1%
- By 2050
- 508,847 · +5.9%
- By 2075
- 504,831 · +5.1%
- By 2100
- 465,867 · -3.0%
Race, ethnicity, and origin ACS 2023
- Neighborhood character
- Predominantly White (88%)
- Race & ethnicity
- White 88% Black 5% Two or more races 5% Hispanic / Latino 3%
- Common ancestry
- Serbian 5% Portuguese 4% Romanian 4%
- Foreign-born
- 2% · Canada
- Languages at home
- 98% English-only · Spanish 1%
Political lean MEDSL · Virginia Beach
- 2024 margin
- Toss-up / Even · D 50.7% · R 48.0% · Other 1.3%
- 2008→2024 swing
- +3.4pp toward D · 2008: -0.7pp · 2024: 2.6pp
- All cycles
- 2024: D+2.6 2020: D+5.4 2016: R+4.5 2012: R+2.5 2008: R+0.7
Not yet ingested
- Civics
- —
Market trends
- HPI YoY
- ▼ -29.19%
- Current HPI
- 377.4116
- Rent YoY
- —
- Metro
- —
- State GDP YoY
- ▲ 2.40%
- F500 in state
- 50
Industry mix (Fortune 500 HQ in VA)
| Industry | F500 HQs | Revenue |
|---|---|---|
| Aerospace / Defense | 4 | $236B |
|
||
| Technology / Defense | 3 | $32B |
|
||
| Financial Services | 2 | $176B |
|
||
| Utilities | 2 | $27B |
|
||
| Insurance | 2 | $25B |
|
||
| Technology | 2 | $15B |
|
||
Price history
3 events — show timeline
- 2026-05-19 Pending — REINMLS
- 2025-12-18 Contingent — REINMLS
- 2025-12-17 Listed $100,000 REINMLS
Cash-flow waterfall
monthlySold comps — $/sqft
last 12 mo · ≤1 miLoading sold comps…