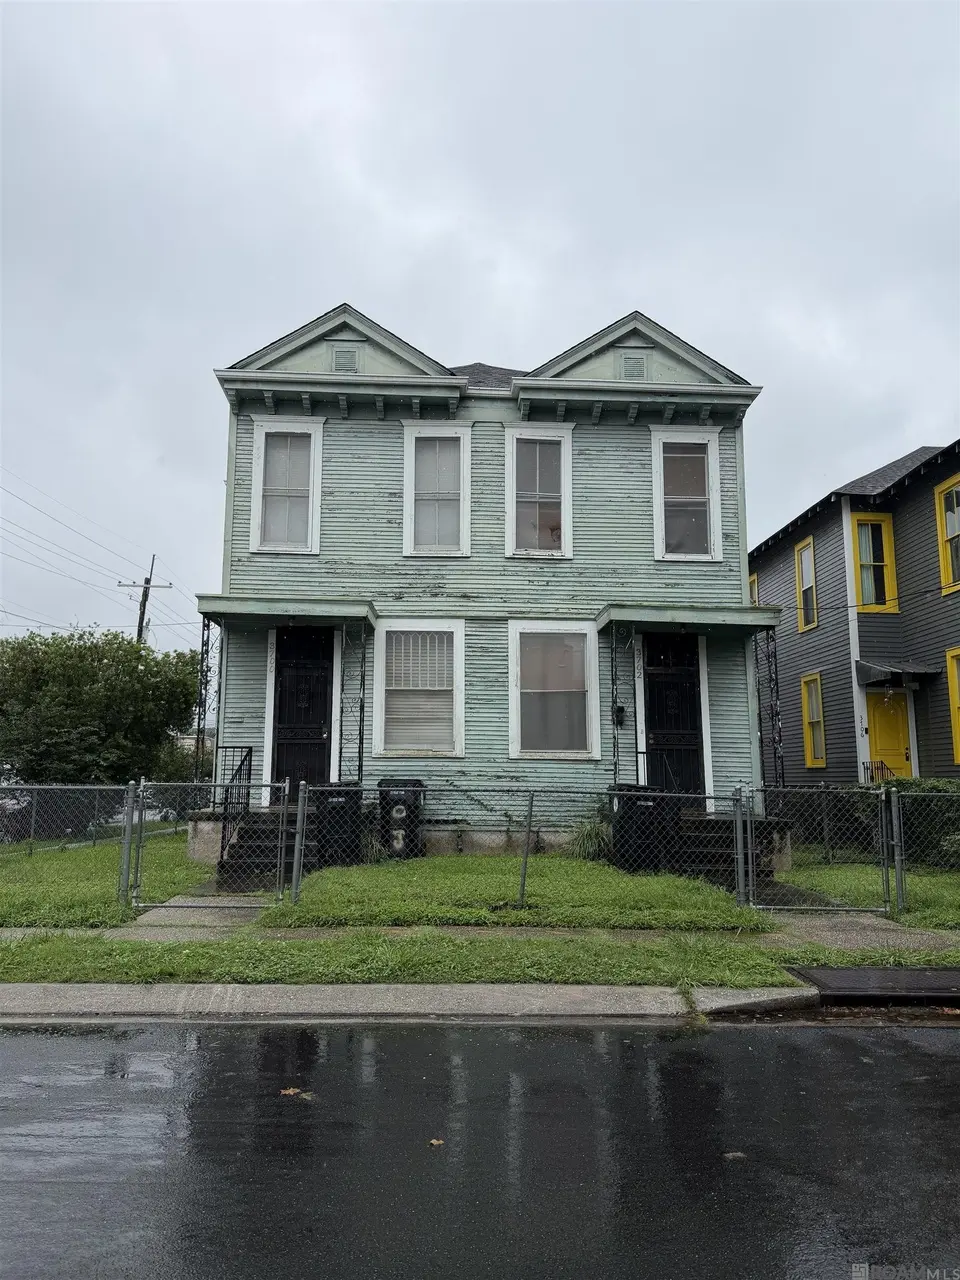
 Duplex
3700 S Saratoga St · New Orleans, LA
Flood risk 8/10 · Major
- FEMA flood zone
- X (shaded)
- Chance of flooding over 30 yrs
- 0.6%
- Est. flood insurance / yr
- $507 – $1,088
Fire risk 1/10 · Minimal
- Est. fire insurance / yr
- $1,269 – $2,357
Heat risk 10/10 · Severe
- Hot days now (above 108°F)
- 7 days/yr
- Hot days in 30 yrs
- 21 days/yr
Wind risk 10/10 · Severe
- Chance of severe wind over 30 yrs
- 99.0%
Air-quality risk 3/10 · Minor
- Unhealthy air days now
- 3 days/yr
- Unhealthy air days in 30 yrs
- 4 days/yr
Risk factors via First Street. Map © Google.
Why this score? — see what drove the C+ grade
The composite is a weighted blend of 9 inputs, each scored 0–100. Each bar is that input's sub-score; the figure is the points it added to the 100-point composite (weight × sub-score).
- Cash flow +25.2/30.0
- ARV discount +15.0/15.0
- DSCR +8.3/10.0
- 1% rule +6.2/10.0
- Livability +4.0/5.0
- Condition / age +2.5/5.0
- Rent growth +2.1/5.0
- Schools +1.6/10.0
- Appreciation +0.0/10.0
$375,000
🖨 Deal sheet 📄 Offer letter ✓ Due diligence
Multi-family units
County records classify this as Multi-Family (2-4 Unit). Listing-text estimate: 2 units. confirmed
Listing remarks MLS
Opportunity knocks at 3700 S. Saratoga Street in the heart of New Orleans! This spacious duplex is ready for a full renovation and offers tremendous upside for investors, contractors, or visionaries looking to add value in a growing area. With good bones and a solid footprint, this property is a blank canvas waiting to be transformed. Situated on three lots, the oversized parcel provides rare flexibility and opens the door to possibilities, expanded outdoor living space, additional improvements, or future development opportunities (buyer to verify all zoning and permitted uses). Whether you're looking to restore its charm, create strong rental income, or pursue a value-add investment strategy, this property offers the space and potential to make it happen. Bring your contractor and your imagination--properties with this much land and opportunity don't come along often. Sold as-is. Appointment required, book all appointments through ShowingTime online. Pre-approval letter must be submitted with all offers. Measurements are not warranted by broker/Realtor. Home to be sold "As Is, Where Is", please check appropriate box on purchase agreement. Deposit to be held by title company.
Key facts
- Oversized parcel
- Full renovation
- 0.9 acre lot
Tags
Property features AI
Exterior
- Parking: No designated parking
- Utilities: Public water; Public sewer
- Home design: Residential income property — duplex
- Construction: Built with other construction materials; Pillar/post/pier foundation
- Exterior features: Front porch; Chain link fencing; Corner lot
Interior
- Kitchen: Refrigerator
- Flooring: Wood flooring
- Heating & cooling: No central heating; No central cooling
- Interior features: Refrigerator provided; Wood flooring
Neighborhood map
What this means for you Summary
Snapshot
- This is a 2 × 2-bed/1-bath units multifamily listed at $375k.
Deal economics
- At list price, monthly cash flow is $770 ($9k/yr) — positive. Per door: $385/mo.
- The deal already cash-flows at list — no discount required.
- Meets the 1% rule at list price ($4k rent vs $375k).
- Cap rate 9.0% vs local median 4.4% in New Orleans — top-decile yield for the area; either an underpriced asset or a hidden risk that comps aren't pricing in. Stress-test before assuming the spread holds.
Location & tenants
- Location reads 81/100 on livability (#3 in LA, #1,383 nationally) — a professional / high-income tenant draw. Strengths: amenities A+, commute A+, health & safety A+; Watch: crime C-, employment D.
- Orleans Parish (urban): math 11% / reading 27% proficiency, ranked #69 of 98 in LA (top 70%) — low school quality limits family demand, transient renter base, plan for 1-2y turnover; 68% free/reduced lunch — lower-income household profile, screen leases tightly.
- Market conditions: Rents soft (-1.4%/yr); 278 active listings in the ZIP; 22 comparable units currently listed for rent nearby; rentals at typical pace (median 24d on market — plan ~3-4 weeks tenant-placement turnaround); 41% of comp listings sitting > 30 days — soft ceiling on asking rent; solid renter incomes; 710 units permitted in Orleans Parish in 2024 (244 in 5+ unit buildings).
- At $4,189/mo this rent would consume 56% of the median local household income ($90k/yr) (locally 1756% of renters already pay >50% of income on rent) — very limited rent-growth headroom before tenants either downsize or default.
Forward outlook
- Local home prices are declining (-3.0%/yr); year-one equity from $3k of loan paydown is wiped out by about $11k of value loss. Plan a longer hold.
- Orleans County population projected at +61% by 2050 — long-run rental-demand tailwind backs the buy-and-hold thesis.
Negotiation context
- Only 14 days on market — expect competitive offers; lowballing is unlikely to land.
- 2 sale attempts with the ask held roughly flat each time — persistent listings suggest the price (not the market) is what's stuck; bring a comps-based counter.
- Current owner paid $90k; list at $375k implies a 317% gain — meaningful room to come down on a strong offer.
Risks & watch-outs
- Watch-outs: flood insurance adds $66/mo; built in 1930 — expect roof / HVAC / electrical / plumbing capex.
- Climate carrying-cost: severe flood risk; severe wind risk, 99% chance of damaging wind over 30y; extreme-heat days projected 7→21/yr by 2055 (HVAC capex compounding) — expect insurance premiums to compound above CPI over the hold.
Questions for the listing agent
- Can we see the unit-by-unit rent roll, current vacancy, and any below-market leases? What's the average tenancy length?
- What capital expenditures (roof, boiler, parking lot, exteriors) have been made in the last 5 years, and what's planned in the next 2?
- Built in 1930 — when were the roof, HVAC, electrical panel, plumbing, and water heater last replaced?
- What's the actual annual flood-insurance premium (NFIP or private), and is the property in a SFHA with mandatory coverage?
- Is there a deadline driving the sale (1031 exchange, divorce, estate, relocation)? That informs how much negotiation room exists.
- What's the average days-on-market for RENTAL listings here right now (not sales)? A rising rental-DOM trend means longer vacancies and softer asking-rent achievability than the comps imply.
- What's the recent tenant-quality profile in this submarket — average credit score on applications, eviction rate, late-payment / NSF rate, and stable-employment percentage? A property-management company in the area should have these aggregated.
- How much new apartment / multifamily construction is in the pipeline within 1–3 miles? Heavy new supply (>2% of stock underway) typically softens rents 12–24 months out; light construction supports rent growth.
Investment metrics
- 1% rule
- 1.12% ✓
- Cap rate
- 8.97%
- Cash-on-cash
- 9.56%
- DSCR
- 1.43
- GRM
- 7.5
CMA / ARV
- ARV (on-the-fly)
- $574,816
- Comps found
- 4
Show comp detail 4 sales within ~0.75 mi
| Address | Dist | Beds/Ba | Sqft | Sold | Price | $/sf | Match |
|---|---|---|---|---|---|---|---|
| 2525 27 Marengo St | 0.34mi | 4/2.5 | 2,991 (-8%) | 1mo | $525,000 | $176 | 67 |
| 2510-12 Peniston St | 0.31mi | 4/3.5 | 3,190 (-2%) | 15mo | $169,000 | $53 | 63 |
| 2323 and 2323 1/2 Peniston St | 0.19mi | 4/2.0 | 2,840 (-13%) | 19mo | $150,000 | $53 | 54 |
| 1300 04 General Pershing St | 0.57mi | 5/4.0 (+1) | 3,513 (+8%) | 7mo | $985,000 | $280 | 42 |
Match score weights: distance 35% · size 25% · config 20% · recency 20%. Top-matched comps best support the ARV.
Projected returns pro-forma
-3.0% appreciation · 0.0% rent growth · sell at horizon
- IRR
- -6.4%
- Equity multiple
- 0.77×
- Total profit
- $-23,979
- Equity at exit
- $55,914
- IRR
- -0.8%
- Equity multiple
- 0.95×
- Total profit
- $-5,059
- Equity at exit
- $32,423
Cash invested: $105,000 (down + closing). Projections, not guarantees.
Landlord ↔ Tenant lean methodology
- Overall (STATE)
- 90 Strongly Landlord-Friendly
- State Louisiana
- 90 Strongly Landlord-Friendly · R+12
- County
- — inherits STATE
- City
- — inherits STATE
ZIP-level market 70115
- Rents YoY
- -1.4%
- Active inventory
- 278
- Price-to-rent
- 14.9×
Monthly cashflow live
- Estimated rent
- $4,189 high interval (Pro) →
- Mortgage (P&I)
- −$1,967
- Tax from tax record
- −$350 /mo · $4,202/yr
- Insurance
- −$156
- Flood insurance flood zone
- −$66 /mo · $798/yr
- HOA
- −$0
- Vacancy / Maint / Mgmt
- −$880
- Net cashflow
- $770
Break-even live
2-unit breakdown (identical units grouped — click to expand)
| Units | Beds | Baths | Est. rent |
|---|---|---|---|
| 2× units | 2 | 1 | $4,190 |
| #1 | 2 | 1 | $2,095 |
| #2 | 2 | 1 | $2,095 |
| Total (2 units) | $4,189 | ||
UW: 25.0% down · 7.5% · 30yr · 1.5% tax · 5.0% vac · 8.0% maint · 8.0% mgmt
Financing live
Cash to close
- Down payment
- $93,750
- Closing costs
- $11,250
- Reserves months
- —
- Total cash needed
- —
Loan-product check · same deal, 3 products live
Conventional
25% down · 7.5% · 30yr
- Down + closing
- —
- Monthly P&I
- —
- Monthly cashflow
- —
- DSCR
- —
- Eligible?
- —
Personal DTI + credit; lowest rate.
DSCR
20% down · 8.5% · 30yr
- Down + closing
- —
- Monthly P&I
- —
- Monthly cashflow
- —
- DSCR
- —
- Eligible?
- —
No personal income docs; deal must DSCR.
Hard money
10% down · 12.0% · 12mo
- Down + closing
- —
- Monthly P&I
- —
- Monthly cashflow
- —
- DSCR
- —
- Eligible?
- —
Short-term bridge; refi at stabilization.
Rent comps 22 comps
| Address | Beds | Baths | Sqft | Rent | $/sqft | DOM | Units | Dist |
|---|---|---|---|---|---|---|---|---|
| 3314 Carondelet St Unit A New Orleans, LA | 3.0 | 2.0 | 3500 | $3,000 | $0.86 | 23d | 1 | 0.35mi |
| 2600 Peniston St New Orleans, LA | 4.0 | 2.0 | 2342 | $3,500 | $1.49 | 43d | 1 | 0.36mi |
| 1927 Napoleon Ave New Orleans, LA | 5.0 | 2.0 | 3350 | $3,600 | $1.07 | 43d | 1 | 0.39mi |
| 1907 Napoleon Ave New Orleans, LA | 4.0 | 2.0 | 2500 | $2,800 | $1.12 | 17d | 1 | 0.39mi |
| 2308 Jena St New Orleans, LA | 3.0 | 2.5 | 2550 | $3,300 | $1.29 | 43d | 1 | 0.51mi |
| 4027 S Derbigny St New Orleans, LA | 3.0 | 2.0 | 2950 | $1,950 | $0.66 | 23d | 1 | 0.72mi |
| 4818 Carondelet St New Orleans, LA | 3.0 | 2.0 | 2400 | $3,600 | $1.50 | 23d | 1 | 0.77mi |
| 3200 Washington Ave Unit NA New Orleans, LA | 4.0 | 3.0 | 2490 | $3,400 | $1.37 | 3d | 1 | 0.84mi |
| 2217 Jefferson Ave Unit none New Orleans, LA | 3.0 | 2.0 | 2500 | $2,500 | $1.00 | 43d | 1 | 0.92mi |
| 3112 Upperline St New Orleans, LA | 5.0 | 3.5 | 2800 | $3,650 | $1.30 | 23d | 1 | 0.96mi |
| 4442 S Johnson St Unit 4442 New Orleans, LA | 4.0 | 4.5 | 3000 | $4,500 | $1.50 | 11d | 1 | 0.97mi |
| 5516 S Robertson St Unit A New Orleans, LA | 3.0 | 2.5 | 3614 | $2,800 | $0.77 | 43d | 1 | 1.04mi |
| 1021 1st St New Orleans, LA | 4.0 | 4.0 | 2621 | $4,500 | $1.72 | 3d | 1 | 1.07mi |
| 5533 Atlanta St New Orleans, LA | 3.0 | 3.0 | 2310 | $7,000 | $3.03 | 3d | 1 | 1.21mi |
| 2028 Magazine St New Orleans, LA | 3.0 | 2.5 | 2600 | $7,000 | $2.69 | 17d | 1 | 1.26mi |
| 4 Cromwell Pl New Orleans, LA | 5.0 | 2.0 | 2600 | $7,000 | $2.69 | 43d | 1 | 1.31mi |
| 5533 S Tonti St New Orleans, LA | 4.0 | 4.0 | 3000 | $3,000 | $1.00 | 14d | 1 | 1.32mi |
| 2703 Palmer Ave New Orleans, LA | 5.0 | 2.0 | 2349 | $5,500 | $2.34 | 43d | 1 | 1.32mi |
| 1435 Euterpe St New Orleans, LA | 4.0 | 3.5 | 2825 | $16,000 | $5.66 | 16d | 1 | 1.32mi |
| 2107 Calhoun St New Orleans, LA | 3.0 | 2.0 | 3300 | $2,790 | $0.85 | 43d | 1 | 1.38mi |
| 2432 Calhoun St New Orleans, LA | 4.0 | 2.0 | 3300 | $4,400 | $1.33 | 17d | 1 | 1.39mi |
| 2616 Calhoun St New Orleans, LA | 4.0 | 2.5 | 2850 | $2,500 | $0.88 | 43d | 1 | 1.40mi |
Listing history 12 events
-
2026-06-18price $375,000 Active 14 DOM
-
2026-06-18days on market $385,000 Active 14 DOM
-
2026-06-17days on market $385,000 Active 13 DOM
-
2026-06-16days on market $385,000 Active 12 DOM
-
2026-06-15days on market $385,000 Active 11 DOM
-
2026-06-13days on market $385,000 Active 9 DOM
-
2026-06-10days on market $385,000 Active 6 DOM
-
2026-06-09days on market $385,000 Active 5 DOM
-
2026-06-08days on market $385,000 Active 4 DOM
-
2026-06-07days on market $385,000 Active 3 DOM
-
2026-06-05remarks 699-char remark
-
2026-06-05$385,000 Active 1 DOM
ⓘ Source: listings_history table (triggers on properties + properties_extension) + one-shot
backfill from property_details.listing_events for pre-trigger history.
Tax reassessment forecast LA · Resets to sale price
- Current annual tax
- $4,202 · $350/mo
- Projected year-2 tax
- $4,202 · $350/mo
- Expected delta
- $0/yr ($0/mo · 0.0%)
ⓘ Screening estimate from a state-policy table — verify with the county assessor before closing.
Climate risk First Street
- Flood 8/10 Severe FEMA zone X (shaded) · 60% chance over 30 yrs
- Wildfire 1/10 Low
- Heat 10/10 Extreme 7 d/yr ≥108°F today · 21 d/yr by 30 yrs out
- Wind 10/10 Extreme 99% chance of damaging wind over 30 yrs
- Air quality 3/10 Moderate 3 unhealthy d/yr today · 4 by 30 yrs out
Nearby sold comps map
Loading sold comps map…
Walkable amenities ~0.75 mi
Loading nearby amenities…
Taxation est. · year 1
- Rental income
- $50,268
- − Mortgage interest
- −$21,006
- − Property taxes
- −$4,202
- − Insurance
- −$2,672
- − Repairs & maintenance
- −$4,021
- − Management
- −$4,021
- − Depreciation
- −$10,909
- Taxable income
- $3,435
- Est. tax owed @ 24.0%
- −$824
- After-tax cash flow
- $8,414/yr
For passive investors: Depreciation is non-cash, so a rental often shows a tax loss while cash-flowing — sheltering income. Rental losses are passive: they offset passive income freely, and up to $25,000/yr can offset ordinary (W-2) income if you actively participate and your MAGI is under $100k (phasing out to $0 by $150k); unused losses carry forward. On sale, claimed depreciation is recaptured at up to 25%, and gains may owe capital-gains tax (a 1031 exchange can defer both). Figures are a year-1 estimate at your 24.0% rate — not tax advice; consult a CPA.
Schools (NCES district)
- District
- Orleans Parish
- NCES district ID
- 2201170
- Math proficiency
- 11% ▼ -52.00%
- Reading proficiency
- 27% ▼ -46.00%
- Median HH income
- $37,011
- Composite
- 15.78/100
- National rank
- #9271
- State rank
- #69 of 98 in LA
Livability — New Orleans
- Score
- 81/100
- State rank
- #3
- US rank
- #1383
Category grades
Schools grade is shown separately in the Schools card above.
Census & demographics
- Census place
- New Orleans, LA
- County
- Orleans Parish · 338,817 people
- City population
- 338,817
- Metro
- New Orleans-Metairie, LA
- Population (ZIP)
- 31,183
- Household income
- $90,182
- Rent vs Own
- Severe rent burden
- 1756.0
Population outlook (Orleans County) Hauer SSP2
- Today (2025)
- 513,025 people
- By 2030
- 575,781 · +12.2%
- By 2040
- 700,174 · +36.5%
- By 2050
- 826,541 · +61.1%
- By 2075
- 1,123,374 · +119.0%
- By 2100
- 1,355,609 · +164.2%
Race, ethnicity, and origin ACS 2023
- Neighborhood character
- Diverse neighborhood (Simpson 0.58)
- Race & ethnicity
- White 59% Black 26% Two or more races 8% Hispanic / Latino 7% Asian 3%
- Hispanic origin (detail)
- Mexican 1%
- Common ancestry
- Lithuanian 8% Italian 3% Slovak 3%
- Foreign-born
- 5% · Canada, China
- Languages at home
- 91% English-only · Spanish 4% French/Haitian/Cajun 2% Other Indo-European 1%
Political lean MEDSL · Orleans
- 2024 margin
- Solid D (+67.0) · D 82.2% · R 15.2% · Other 2.7%
- 2008→2024 swing
- +6.7pp toward D · 2008: 60.3pp · 2024: 67.0pp
- All cycles
- 2024: D+67.0 2020: D+68.2 2016: D+66.2 2012: D+62.5 2008: D+60.3
Not yet ingested
- Civics
- —
Market trends
- HPI YoY
- ▼ -272.08%
- Current HPI
- 287.2138
- Rent YoY
- ▼ -1.42%
- Metro
- New Orleans-Metairie, LA
- State GDP YoY
- ▲ 3.29%
- F500 in state
- 10
Industry mix (Fortune 500 HQ in LA)
| Industry | F500 HQs | Revenue |
|---|---|---|
| Telecommunications | 2 | $23B |
|
||
| Utilities | 1 | $12B |
|
||
| Wholesale / Distribution | 1 | $5B |
|
||
| Advertising | 1 | $2B |
|
||
Price history
+327.8% since first listed3 events — show timeline
- 2026-05-28 Listed $385,000 AcadianaMLS
- 2026-05-28 Listed $385,000 GBRMLS
- 2006-07-28 Sold (Public Records) $90,000 Public Records
Property tax history
+10.0%/yrLatest (2026): $4,202 · -3.5% YoY. Source: county tax records.
Cash-flow waterfall
monthlySold comps — $/sqft
last 12 mo · ≤1 miLoading sold comps…