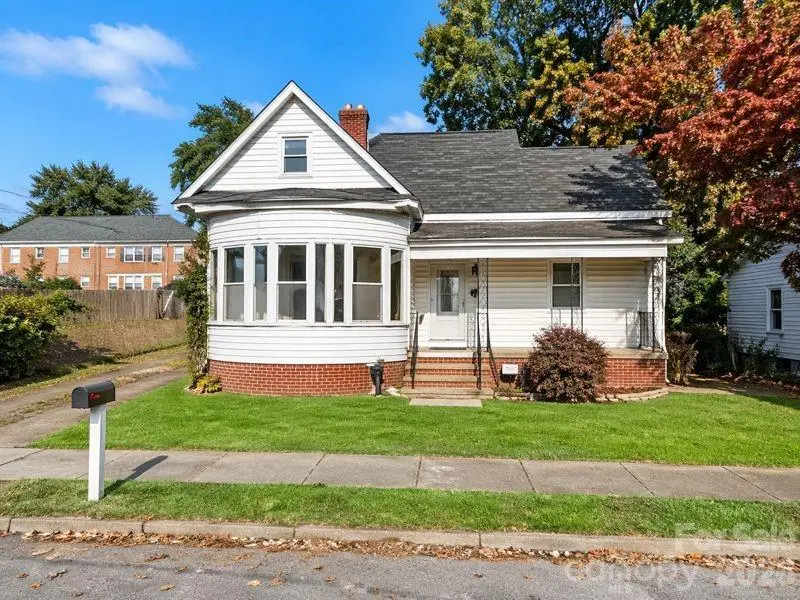
1015 Clark St · Rocky Mount, NC
Flood risk 1/10 · Minimal
- FEMA flood zone
- X (unshaded)
- Chance of flooding over 30 yrs
- 0.0%
- Est. flood insurance / yr
- $507 – $1,088
Fire risk 2/10 · Minimal
- Est. fire insurance / yr
- $906 – $1,684
Heat risk 8/10 · Major
- Hot days now (above 107°F)
- 7 days/yr
- Hot days in 30 yrs
- 16 days/yr
Wind risk 6/10 · Moderate
- Chance of severe wind over 30 yrs
- 73.0%
Air-quality risk 2/10 · Minimal
- Unhealthy air days now
- 1 days/yr
- Unhealthy air days in 30 yrs
- 2 days/yr
Risk factors via First Street. Map © Google.
Why this score? — see what drove the B- grade
The composite is a weighted blend of 9 inputs, each scored 0–100. Each bar is that input's sub-score; the figure is the points it added to the 100-point composite (weight × sub-score).
- Cash flow +26.2/30.0
- ARV discount +15.0/15.0
- DSCR +8.9/10.0
- 1% rule +5.8/10.0
- Livability +3.5/5.0
- Rent growth +2.5/5.0
- Condition / age +2.5/5.0
- Schools +2.0/10.0
- Appreciation +0.0/10.0
$129,900
🖨 Deal sheet (PDF) 📄 Offer letter ✓ Due diligence
Listing remarks
Great investment opportunity in Rocky Mount! This property offers excellent potential for investors looking to add to their portfolio. The building shown in the second picture contains both garages, providing valuable storage or additional rental possibilities. Conveniently located just minutes from downtown Rocky Mount, the property benefits from close proximity to employment centers, shopping, dining, entertainment venues, and everyday amenities. Its prime location also offers quick access to US-64 and other major commuting routes, making it attractive for tenants who need an easy commute. With strong rental appeal and a desirable location, this property presents a solid opportunity for i
Key facts
- Valuable storage
- 7,840 sq ft lot
- 2 garage spots
Tags
Property features AI
Finance
- HOA & community: No HOA
Exterior
- Parking: Detached 2-car garage; Has garage
- Utilities: City water; Public sewer
- Home design: Single family residence; Site-built construction; Partial brick exterior; One story; Entry level: Main
- Construction: Site-built construction; Partial brick exterior; Crawl space foundation; Built as a single-story
- Exterior features: Asphalt and concrete road access; Publicly maintained road
Interior
- Kitchen: No appliances included
- Bedrooms: 3 bedrooms on the main level
- Bathrooms: 1 full bathroom on the main level
- Heating & cooling: Natural gas heating; Central air conditioning
- Interior features: Single-level living; Crawl space foundation
- Laundry & utility: Indoor laundry
Neighborhood map
What this means for you Summary
Snapshot
- This is a 3-bed/1.0-bath single-family listed at $130k.
Deal economics
- At list price, monthly cash flow is $332 ($4k/yr) — positive.
- The deal already cash-flows at list — no discount required.
- Meets the 1% rule at list price ($1k rent vs $130k).
- Recommended offer: $118k (9.0% below list) — sets the bar for market timing.
- Cap rate 9.4% vs local median 4.5% in Rocky Mount — top-decile yield for the area; either an underpriced asset or a hidden risk that comps aren't pricing in. Stress-test before assuming the spread holds.
Location & tenants
- Location reads 70/100 on livability (#134 in NC) — a middle-class / working-renter tenant base. Strengths: cost of living A+, housing A+, health & safety A+; Watch: schools F, crime F, amenities F.
- Edgecombe County Public Schools (rural): math 21% / reading 27% proficiency, ranked #163 of 178 in NC (top 92%) — low school quality limits family demand, transient renter base, plan for 1-2y turnover; 74% free/reduced lunch — lower-income household profile, screen leases tightly.
- Market conditions: 133 active listings in the ZIP; lower-income renter base — watch delinquency; 50 units permitted in Edgecombe County in 2024 (5 in 5+ unit buildings).
- This rent runs 37% of the median local income ($45k/yr) — at the standard rent-burdened threshold; future hikes will face affordability resistance.
Forward outlook
- Local home prices are declining (-3.0%/yr); year-one equity from $898 of loan paydown is wiped out by about $4k of value loss. Plan a longer hold.
- Edgecombe County population projected at -34% by 2050 — secular population decline; favor cash flow + early exit over multi-decade hold.
- At projected returns (-3.0% appreciation + 3.0% rent growth), your $36k cash investment doubles in ~10 years — after that, you're playing with house money.
Negotiation context
- It's been on market 92 days — a 9% lower offer ($118k) is reasonable based on typical stale-listing flexibility.
- 2 sale attempts since 11y ago; this cycle's ask has dropped $10k (7%) from the opening price — seller is motivated, your offer sets the floor, not the list.
Risks & watch-outs
- Watch-outs: built in 1915 — expect roof / HVAC / electrical / plumbing capex.
- Climate carrying-cost: major wind risk, 73% chance of damaging wind over 30y; extreme-heat days projected 7→16/yr by 2055 (HVAC capex compounding) — expect insurance premiums to compound above CPI over the hold.
Questions for the listing agent
- It's been on market 92 days. Have you received any prior offers? Is the seller open to a 9% concession, seller financing, or rate buy-down credit?
- Built in 1915 — when were the roof, HVAC, electrical panel, plumbing, and water heater last replaced?
- Why hasn't it sold? Are there any deal-killer items the seller is aware of (foundation, flood, title, zoning, code violations)?
- Is there a deadline driving the sale (1031 exchange, divorce, estate, relocation)? That informs how much negotiation room exists.
- Schools are F-rated, which usually means shorter tenancies and higher turnover. Who's the typical renter profile here, and what's been the actual vacancy rate?
- Crime grade is F in this area — have there been break-ins, vandalism, or insurance claims at this property in the last 3 years? What carrier currently insures it and at what premium?
- What's the average days-on-market for RENTAL listings here right now (not sales)? A rising rental-DOM trend means longer vacancies and softer asking-rent achievability than the comps imply.
- What's the recent tenant-quality profile in this submarket — average credit score on applications, eviction rate, late-payment / NSF rate, and stable-employment percentage? A property-management company in the area should have these aggregated.
- How much new for-sale + rental construction is in the pipeline within 1–3 miles? Heavy new supply typically softens prices + rents 12–24 months out; constrained supply supports both.
Investment metrics
- 1% rule
- 1.08% ✓
- Cap rate
- 9.36%
- Cash-on-cash
- 10.95%
- DSCR
- 1.49
- GRM
- 7.7
CMA / ARV
- ARV (on-the-fly)
- $157,768
- Comps found
- 12
Show comp detail 12 sales within ~0.75 mi
| Address | Dist | Beds/Ba | Sqft | Sold | Price | $/sf | Match |
|---|---|---|---|---|---|---|---|
| 1201 Cypress St | 0.28mi | 4/2.0 (+1) | 1,533 (+1%) | 4mo | $179,900 | $117 | 73 |
| 612 Short St | 0.10mi | 3/2.0 | 1,689 (+11%) | 4mo | $135,000 | $80 | 69 |
| 1313 Old Wilson Rd | 0.41mi | 3/2.0 | 1,440 (-5%) | 2mo | $128,000 | $89 | 67 |
| 715 Clark St | 0.26mi | 4/1.0 (+1) | 1,378 (-9%) | 3mo | $40,000 | $29 | 65 |
| 1124 S Church St | 0.53mi | 3/1.0 | 1,539 (+2%) | 10mo | $120,000 | $78 | 65 |
| 923 Belvedere St | 0.62mi | 3/1.5 | 1,502 (-1%) | 4mo | $125,000 | $83 | 64 |
| 621 Clark St | 0.35mi | 3/1.0 | 1,401 (-8%) | 9mo | $45,000 | $32 | 64 |
| 1136 Hill St | 0.67mi | 3/2.0 | 1,504 (-1%) | 4mo | $185,000 | $123 | 60 |
| 906 Arlington St | 0.20mi | 4/2.0 (+1) | 1,326 (-13%) | 1mo | $180,000 | $136 | 60 |
| 1510 Old Wilson Rd | 0.50mi | 3/2.0 | 1,454 (-4%) | 9mo | $151,500 | $104 | 58 |
| 508 Buena Vista Ave | 0.42mi | 3/2.0 | 1,375 (-9%) | 10mo | $171,900 | $125 | 52 |
| 1100 Long Ave | 0.55mi | 3/2.0 | 1,670 (+10%) | 9mo | $210,000 | $126 | 46 |
Match score weights: distance 35% · size 25% · config 20% · recency 20%. Top-matched comps best support the ARV.
Projected returns pro-forma
-3.0% appreciation · 3.0% rent growth · sell at horizon
- IRR
- 0.0%
- Equity multiple
- 1.00×
- Total profit
- $41
- Equity at exit
- $19,369
- IRR
- 9.6%
- Equity multiple
- 1.74×
- Total profit
- $27,038
- Equity at exit
- $11,231
Cash invested: $36,372 (down + closing). Projections, not guarantees.
Landlord ↔ Tenant lean methodology
- Overall (STATE)
- 85 Strongly Landlord-Friendly
- State North Carolina
- 85 Strongly Landlord-Friendly · R+3
- County
- — inherits STATE
- City
- — inherits STATE
ZIP-level market 27801
- Home prices YoY
- -5.6%
- Active inventory
- 133
- Price-to-rent
- 7.7×
Monthly cashflow live
- Estimated rent
- $1,398 medium interval (Pro) →
- Mortgage (P&I)
- −$681
- Tax from tax record
- −$37 /mo · $442/yr
- Insurance
- −$54
- HOA
- −$0
- Vacancy / Maint / Mgmt
- −$294
- Net cashflow
- $332
Break-even live
Sensitivity live
| Price | -10% $406 | -5% $369 | +0% $332 | +5% $295 | +10% $258 |
|---|---|---|---|---|---|
| Rent | -10% $222 | -5% $277 | +0% $332 | +5% $387 | +10% $442 |
| Rate | -1.0pp $397 | -0.5pp $365 | base $332 | +0.5pp $298 | +1.0pp $264 |
UW: 25.0% down · 7.5% · 30yr · 1.5% tax · 5.0% vac · 8.0% maint · 8.0% mgmt
Financing live
Cash to close
- Down payment
- $32,475
- Closing costs
- $3,897
- Reserves months
- —
- Total cash needed
- —
Loan-product check · same deal, 3 products live
Conventional
25% down · 7.5% · 30yr
- Down + closing
- —
- Monthly P&I
- —
- Monthly cashflow
- —
- DSCR
- —
- Eligible?
- —
Personal DTI + credit; lowest rate.
DSCR
20% down · 8.5% · 30yr
- Down + closing
- —
- Monthly P&I
- —
- Monthly cashflow
- —
- DSCR
- —
- Eligible?
- —
No personal income docs; deal must DSCR.
Hard money
10% down · 12.0% · 12mo
- Down + closing
- —
- Monthly P&I
- —
- Monthly cashflow
- —
- DSCR
- —
- Eligible?
- —
Short-term bridge; refi at stabilization.
Listing history 19 events
-
2026-06-18days on market $129,900 Active 92 DOM
-
2026-06-17days on market $129,900 Active 91 DOM
-
2026-06-16days on market $129,900 Active 90 DOM
-
2026-06-15days on market $129,900 Active 89 DOM
-
2026-06-14days on market $129,900 Active 87 DOM
-
2026-06-13days on market $129,900 Active 86 DOM
-
2026-06-10days on market $129,900 Active 84 DOM
-
2026-06-09days on market $129,900 Active 83 DOM
-
2026-06-08days on market $129,900 Active 82 DOM
-
2026-06-07days on market $129,900 Active 81 DOM
-
2026-06-03days on market $129,900 Active 77 DOM
-
2026-06-02days on market $129,900 Active 76 DOM
-
2026-06-01days on market $129,900 Active 75 DOM
-
2026-05-31days on market $129,900 Active 74 DOM
-
2026-05-30days on market $129,900 Active 73 DOM
-
2026-05-06price $129,900
-
2026-03-18$140,000 Active
-
2015-08-31historical
-
2015-02-23$20,000
ⓘ Source: listings_history table (triggers on properties + properties_extension) + one-shot
backfill from property_details.listing_events for pre-trigger history.
Tax reassessment forecast NC · Resets to sale price
- Current annual tax
- $442 · $37/mo
- Projected year-2 tax
- $1,065 · $89/mo
- Expected delta
- +$623/yr (+$52/mo · 141.1%)
ⓘ Screening estimate from a state-policy table — verify with the county assessor before closing.
Climate risk First Street
- Flood 1/10 Low FEMA zone X (unshaded) · 0% chance over 30 yrs
- Wildfire 2/10 Low
- Heat 8/10 Severe 7 d/yr ≥107°F today · 16 d/yr by 30 yrs out
- Wind 6/10 Major 73% chance of damaging wind over 30 yrs
- Air quality 2/10 Low 1 unhealthy d/yr today · 2 by 30 yrs out
Nearby sold comps map
Loading sold comps map…
Walkable amenities ~0.75 mi
Loading nearby amenities…
Taxation est. · year 1
- Rental income
- $16,772
- − Mortgage interest
- −$7,276
- − Property taxes
- −$442
- − Insurance
- −$650
- − Repairs & maintenance
- −$1,342
- − Management
- −$1,342
- − Depreciation
- −$3,779
- Taxable income
- $1,942
- Est. tax owed @ 24.0%
- −$466
- After-tax cash flow
- $3,518/yr
For passive investors: Depreciation is non-cash, so a rental often shows a tax loss while cash-flowing — sheltering income. Rental losses are passive: they offset passive income freely, and up to $25,000/yr can offset ordinary (W-2) income if you actively participate and your MAGI is under $100k (phasing out to $0 by $150k); unused losses carry forward. On sale, claimed depreciation is recaptured at up to 25%, and gains may owe capital-gains tax (a 1031 exchange can defer both). Figures are a year-1 estimate at your 24.0% rate — not tax advice; consult a CPA.
Schools (NCES district)
- District
- Edgecombe County Public Schools
- NCES district ID
- 3701320
- Math proficiency
- 21% ▼ -2.00%
- Reading proficiency
- 27% ▲ 2.00%
- Median HH income
- $35,711
- Composite
- 19.85/100
- National rank
- #8696
- State rank
- #163 of 178 in NC
Livability — Rocky Mount
- Score
- 70/100
- State rank
- #134
- US rank
- #7692
Category grades
Schools grade is shown separately in the Schools card above.
Census & demographics
- Census place
- Rocky Mount, NC
- County
- Edgecombe County · 37,913 people
- City population
- 70,300
- Metro
- Rocky Mount, NC
- Population (ZIP)
- 19,532
- Household income
- $44,884
- Rent vs Own
- Severe rent burden
- 900.0
Population outlook (Edgecombe County) Hauer SSP2
- Today (2025)
- 47,800 people
- By 2030
- 44,396 · -7.1%
- By 2040
- 37,562 · -21.4%
- By 2050
- 31,495 · -34.1%
- By 2075
- 20,943 · -56.2%
- By 2100
- 13,674 · -71.4%
Race, ethnicity, and origin ACS 2023
- Neighborhood character
- Predominantly Black (70%)
- Race & ethnicity
- Black 70% White 24% Two or more races 3% Hispanic / Latino 1%
- Common ancestry
- Romanian 1%
- Foreign-born
- 1% · Canada
- Languages at home
- 97% English-only · Spanish 2%
Political lean MEDSL · Edgecombe
- 2024 margin
- Strong D (+22.7) · D 61.0% · R 38.3%
- 2008→2024 swing
- -11.8pp toward R · 2008: 34.5pp · 2024: 22.7pp
- All cycles
- 2024: D+22.7 2020: D+27.0 2016: D+32.2 2012: D+36.4 2008: D+34.5
Not yet ingested
- Civics
- —
Market trends
- HPI YoY
- ▼ -17.65%
- Current HPI
- 296.3428
- Rent YoY
- —
- Metro
- Rocky Mount, NC
- State GDP YoY
- ▲ 3.28%
- F500 in state
- 26
Industry mix (Fortune 500 HQ in NC)
| Industry | F500 HQs | Revenue |
|---|---|---|
| Financial Services | 2 | $213B |
|
||
| Retail | 2 | $95B |
|
||
| Industrial Conglomerate | 1 | $38B |
|
||
| Metals / Steel | 1 | $35B |
|
||
| Utilities | 1 | $30B |
|
||
| Industrial Machinery | 1 | $19B |
|
||
Price history
+549.5% since first listed4 events — show timeline
- 2026-05-06 Price Changed $129,900 CANOPYMLS as Distributed by MLS Grid
- 2026-03-18 Listed $140,000 CANOPYMLS as Distributed by MLS Grid
- 2015-08-31 Listing Removed — Hive MLS
- 2015-02-23 Listed $20,000 Hive MLS
Property tax history
+1.7%/yrLatest (2025): $442 · +0.0% YoY. Source: county tax records.
Cash-flow waterfall
monthlySold comps — $/sqft
last 12 mo · ≤1 miLoading sold comps…