 Multi-family
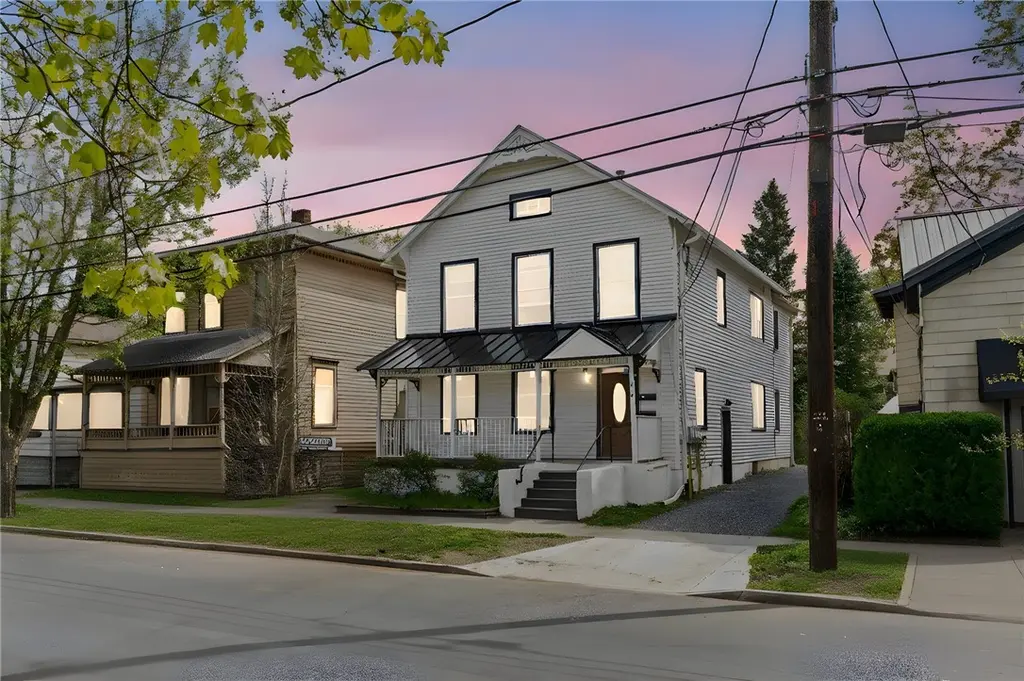
419 N Albany St · Ithaca, NY
Flood risk 7/10 · Major
- FEMA flood zone
- X
- Chance of flooding over 30 yrs
- 0.93%
- Est. flood insurance / yr
- $473 – $860
Fire risk 1/10 · Minimal
- Est. fire insurance / yr
- $691 – $1,283
Heat risk 4/10 · Minor
- Hot days now (above 94°F)
- 8 days/yr
- Hot days in 30 yrs
- 17 days/yr
Wind risk 1/10 · Minimal
- Chance of severe wind over 30 yrs
- 1.0%
Air-quality risk 2/10 · Minimal
- Unhealthy air days now
- 0 days/yr
- Unhealthy air days in 30 yrs
- 1 days/yr
Risk factors via First Street. Map © Google.
Why this score? — see what drove the B+ grade
The composite is a weighted blend of 9 inputs, each scored 0–100. Each bar is that input's sub-score; the figure is the points it added to the 100-point composite (weight × sub-score).
- Cash flow +29.7/30.0
- ARV discount +12.4/15.0
- DSCR +10.0/10.0
- 1% rule +8.7/10.0
- Schools +5.4/10.0
- Livability +3.9/5.0
- Rent growth +3.8/5.0
- Condition / age +2.5/5.0
- Appreciation +0.0/10.0
$499,000
🖨 Deal sheet 📄 Offer letter ✓ Due diligence
Multi-family units
County records classify this as Multi-Family (2-4 Unit). Listing-text estimate: 1 unit. estimate disagrees with records
Listing remarks MLS
Investment Opportunity! Well-maintained duplex in the heart of downtown Ithaca, offering 2 spacious 3-bedroom units and valuable off-street parking. Entire house was gutted in 1984 and remodeled including all plumbing and electric. Only 1 mile to Cornell, ½ mi to The Commons and the Farmers Market on Cayuga Lake. Both units are currently rented at $2100 and $1900/month (a bit under market). Strong opportunity for future income. Tenants are friendly, reliable, and responsible, allowing a smooth transition for the next owner. Directly across from a beautiful 3-acre city park complete with a public pool and basketball courts. An elementary school and community center are 1 block away, adding to the neighborhood’s appeal. Whether you're looking to expand your rental portfolio or live in one unit while generating income from the other, this duplex is a fantastic opportunity. Owner in the process of getting transferable C of C. Don't miss the virtual tour!
Key facts
- Gutted and remodeled
- 1 mile to cornell
- 3,960 sq ft lot
Tags
Neighborhood map
What this means for you Summary
Snapshot
- This is a 6-bed/2.0-bath multifamily listed at $499k.
Deal economics
- At list price, monthly cash flow is $2k ($21k/yr) — positive.
- The deal already cash-flows at list — no discount required.
- Meets the 1% rule at list price ($7k rent vs $499k).
- Recommended offer: $469k (6.0% below list) — sets the bar for market timing.
- Cap rate 10.7% vs local median 5.3% in Ithaca — top-decile yield for the area; either an underpriced asset or a hidden risk that comps aren't pricing in. Stress-test before assuming the spread holds.
Location & tenants
- Location reads 77/100 on livability (#210 in NY, #3,240 nationally) — a middle-class / working-renter tenant base. Strengths: amenities A+, commute A+, health & safety A+; Watch: housing C-, employment D+, cost of living D.
- Ithaca City School District (urban): math 57% / reading 71% proficiency, ranked #195 of 590 in NY (top 33%) — acceptable for families but not a draw, mixed tenant base, ~2y average lease.
- Market conditions: Rents rising fast (+5.2%/yr); 327 active listings in the ZIP; 382 units permitted in Tompkins County in 2024 (208 in 5+ unit buildings).
- At $6,849/mo this rent would consume 115% of the median local household income ($71k/yr) (locally 5169% of renters already pay >50% of income on rent) — very limited rent-growth headroom before tenants either downsize or default.
Forward outlook
- Local home prices are declining (-3.0%/yr); year-one equity from $3k of loan paydown is wiped out by about $15k of value loss. Plan a longer hold.
- Tompkins County population projected at +17% by 2050 — long-run rental-demand tailwind backs the buy-and-hold thesis.
- At projected returns (-3.0% appreciation + 5.2% rent growth), your $140k cash investment doubles in ~7 years — after that, you're playing with house money.
Negotiation context
- It's been on market 66 days — a 6% lower offer ($469k) is reasonable based on typical stale-listing flexibility.
- 3 sale attempts since 6y ago with the ask held roughly flat each time — persistent listings suggest the price (not the market) is what's stuck; bring a comps-based counter.
- Current owner paid $175k; list at $499k implies a 185% gain — meaningful room to come down on a strong offer.
Risks & watch-outs
- Watch-outs: flood insurance adds $56/mo; built in 1890 — expect roof / HVAC / electrical / plumbing capex.
- Climate carrying-cost: major flood risk — expect insurance premiums to compound above CPI over the hold.
Questions for the listing agent
- It's been on market 66 days. Have you received any prior offers? Is the seller open to a 6% concession, seller financing, or rate buy-down credit?
- Built in 1890 — when were the roof, HVAC, electrical panel, plumbing, and water heater last replaced?
- What's the actual annual flood-insurance premium (NFIP or private), and is the property in a SFHA with mandatory coverage?
- Why hasn't it sold? Are there any deal-killer items the seller is aware of (foundation, flood, title, zoning, code violations)?
- Is there a deadline driving the sale (1031 exchange, divorce, estate, relocation)? That informs how much negotiation room exists.
- Schools are A-rated — typically a magnet for longer-tenancy family renters. What's the average tenant stay here, and is there a school-zone premium baked into asking?
- What's the average days-on-market for RENTAL listings here right now (not sales)? A rising rental-DOM trend means longer vacancies and softer asking-rent achievability than the comps imply.
- What's the recent tenant-quality profile in this submarket — average credit score on applications, eviction rate, late-payment / NSF rate, and stable-employment percentage? A property-management company in the area should have these aggregated.
- How much new apartment / multifamily construction is in the pipeline within 1–3 miles? Heavy new supply (>2% of stock underway) typically softens rents 12–24 months out; light construction supports rent growth.
Investment metrics
- 1% rule
- 1.37% ✓
- Cap rate
- 10.67%
- Cash-on-cash
- 15.64%
- DSCR
- 1.70
- GRM
- 6.1
CMA / ARV
- ARV (median comp)
- $559,733
- List price
- $499,000
- Delta
- -10.85%
- Verdict
- UNDERPRICED
- Comps
- 20 within 1.0 mi
Show comp detail 12 sales within ~0.75 mi
| Address | Dist | Beds/Ba | Sqft | Sold | Price | $/sf | Match |
|---|---|---|---|---|---|---|---|
| 206 Third St | 0.23mi | 6/2.0 | 2,600 (-3%) | 12mo | $415,000 | $160 | 74 |
| 203 Prospect St | 0.55mi | 6/2.0 | 2,656 (-1%) | 5mo | $380,000 | $143 | 68 |
| 402 University Ave | 0.52mi | 5/3.0 (-1) | 2,661 (-1%) | 2mo | $445,000 | $167 | 64 |
| 135 Linn St | 0.38mi | 7/3.0 (+1) | 2,666 (-1%) | 10mo | $580,000 | $218 | 64 |
| 325-327 Cascadilla St | 0.11mi | 6/2.0 | 2,988 (+11%) | 20mo | $495,000 | $166 | 59 |
| 817-819 N Cayuga St | 0.44mi | 6/3.0 | 2,482 (-8%) | 10mo | $529,000 | $213 | 54 |
| 842 N Aurora St | 0.54mi | 5/2.0 (-1) | 2,408 (-10%) | 9mo | $465,000 | $193 | 46 |
| 512 University Ave | 0.60mi | 6/3.0 | 2,535 (-6%) | 17mo | $570,000 | $225 | 44 |
| 506-508 S Albany St | 0.66mi | 6/3.5 | 2,652 (-1%) | 22mo | $580,000 | $219 | 43 |
| 403 S Cayuga St | 0.60mi | 5/3.0 (-1) | 2,804 (+4%) | 15mo | $380,000 | $136 | 43 |
| 607 N Cayuga St | 0.26mi | 5/4.0 (-1) | 2,296 (-14%) | 10mo | $495,000 | $216 | 43 |
| 310-312 Turner Pl | 0.56mi | 5/4.0 (-1) | 3,080 (+15%) | 4mo | $505,000 | $164 | 33 |
Match score weights: distance 35% · size 25% · config 20% · recency 20%. Top-matched comps best support the ARV.
Projected returns pro-forma
-3.0% appreciation · 5.22% rent growth · sell at horizon
- IRR
- 8.4%
- Equity multiple
- 1.34×
- Total profit
- $47,420
- Equity at exit
- $74,403
- IRR
- 19.5%
- Equity multiple
- 2.82×
- Total profit
- $254,111
- Equity at exit
- $43,144
Cash invested: $139,720 (down + closing). Projections, not guarantees.
Landlord ↔ Tenant lean methodology
- Overall (STATE)
- 15 Strongly Tenant-Friendly
- State New York
- 15 Strongly Tenant-Friendly · D+10
- County
- — inherits STATE
- City
- — inherits STATE
ZIP-level market 14850
- Rents YoY
- 5.2%
- Active inventory
- 327
- Price-to-rent
- 12.1×
Monthly cashflow live
- Estimated rent
- $6,849 high interval (Pro) →
- Mortgage (P&I)
- −$2,617
- Tax from tax record
- −$765 /mo · $9,185/yr
- Insurance
- −$208
- Flood insurance flood zone
- −$56 /mo · $666/yr
- HOA
- −$0
- Vacancy / Maint / Mgmt
- −$1,438
- Net cashflow
- $1,765
Break-even live
2-unit breakdown (identical units grouped — click to expand)
| Units | Beds | Baths | Est. rent |
|---|---|---|---|
| 2× units | 3 | 1 | $6,850 |
| #1 | 3 | 1 | $3,425 |
| #2 | 3 | 1 | $3,425 |
| Total (2 units) | $6,849 | ||
UW: 25.0% down · 7.5% · 30yr · 1.5% tax · 5.0% vac · 8.0% maint · 8.0% mgmt
Financing live
Cash to close
- Down payment
- $124,750
- Closing costs
- $14,970
- Reserves months
- —
- Total cash needed
- —
Loan-product check · same deal, 3 products live
Conventional
25% down · 7.5% · 30yr
- Down + closing
- —
- Monthly P&I
- —
- Monthly cashflow
- —
- DSCR
- —
- Eligible?
- —
Personal DTI + credit; lowest rate.
DSCR
20% down · 8.5% · 30yr
- Down + closing
- —
- Monthly P&I
- —
- Monthly cashflow
- —
- DSCR
- —
- Eligible?
- —
No personal income docs; deal must DSCR.
Hard money
10% down · 12.0% · 12mo
- Down + closing
- —
- Monthly P&I
- —
- Monthly cashflow
- —
- DSCR
- —
- Eligible?
- —
Short-term bridge; refi at stabilization.
Listing history 23 events
-
2026-06-19days on market $499,000 Active 66 DOM
-
2026-06-18days on market $499,000 Active 65 DOM
-
2026-06-17days on market $499,000 Active 64 DOM
-
2026-06-16days on market $499,000 Active 63 DOM
-
2026-06-15days on market $499,000 Active 62 DOM
-
2026-06-14days on market $499,000 Active 60 DOM
-
2026-06-13days on market $499,000 Active 59 DOM
-
2026-06-10days on market $499,000 Active 57 DOM
-
2026-06-09days on market $499,000 Active 56 DOM
-
2026-06-08days on market $499,000 Active 55 DOM
-
2026-06-07days on market $499,000 Active 54 DOM
-
2026-06-05days on market $499,000 Active 51 DOM
-
2026-06-02days on market $499,000 Active 49 DOM
-
2026-06-01days on market $499,000 Active 48 DOM
-
2026-05-31days on market $499,000 Active 47 DOM
-
2026-05-30days on market $499,000 Active 46 DOM
-
2026-05-13price $499,000 977-char remark
Show marketing remark (977 chars)
Investment Opportunity! Well-maintained duplex in the heart of downtown Ithaca, offering 2 spacious 3-bedroom units and valuable off-street parking. Entire house was gutted in 1984 and remodeled including all plumbing and electric. Only 1 mile to Cornell, ½ mi to The Commons and the Farmers Market on Cayuga Lake. Both units are currently rented at $2100 and $1900/month (a bit under market). Strong opportunity for future income. Tenants are friendly, reliable, and responsible, allowing a smooth transition for the next owner. Directly across from a beautiful 3-acre city park complete with a public pool and basketball courts. An elementary school and community center are 1 block away, adding to the neighborhood’s appeal. Whether you're looking to expand your rental portfolio or live in one unit while generating income from the other, this duplex is a fantastic opportunity. Owner in the process of getting transferable C of C. Don't miss the virtual tour!
-
2026-04-14$519,000 Active 977-char remark
Show marketing remark (977 chars)
Investment Opportunity! Well-maintained duplex in the heart of downtown Ithaca, offering 2 spacious 3-bedroom units and valuable off-street parking. Entire house was gutted in 1984 and remodeled including all plumbing and electric. Only 1 mile to Cornell, ½ mi to The Commons and the Farmers Market on Cayuga Lake. Both units are currently rented at $2100 and $1900/month (a bit under market). Strong opportunity for future income. Tenants are friendly, reliable, and responsible, allowing a smooth transition for the next owner. Directly across from a beautiful 3-acre city park complete with a public pool and basketball courts. An elementary school and community center are 1 block away, adding to the neighborhood’s appeal. Whether you're looking to expand your rental portfolio or live in one unit while generating income from the other, this duplex is a fantastic opportunity. Owner in the process of getting transferable C of C. Don't miss the virtual tour!
-
2026-04-13$519,000 Active 977-char remark
Show marketing remark (977 chars)
Investment Opportunity! Well-maintained duplex in the heart of downtown Ithaca, offering 2 spacious 3-bedroom units and valuable off-street parking. Entire house was gutted in 1984 and remodeled including all plumbing and electric. Only 1 mile to Cornell, ½ mi to The Commons and the Farmers Market on Cayuga Lake. Both units are currently rented at $2100 and $1900/month (a bit under market). Strong opportunity for future income. Tenants are friendly, reliable, and responsible, allowing a smooth transition for the next owner. Directly across from a beautiful 3-acre city park complete with a public pool and basketball courts. An elementary school and community center are 1 block away, adding to the neighborhood’s appeal. Whether you're looking to expand your rental portfolio or live in one unit while generating income from the other, this duplex is a fantastic opportunity. Owner in the process of getting transferable C of C. Don't miss the virtual tour!
-
2020-02-25$369,000
-
2013-04-01soldstatus $175,000
-
1998-09-21soldstatus $80,000
ⓘ Source: listings_history table (triggers on properties + properties_extension) + one-shot
backfill from property_details.listing_events for pre-trigger history.
Tax reassessment forecast NY · Partial reset (capped growth)
- Current annual tax
- $9,185 · $765/mo
- Projected year-2 tax
- $9,185 · $765/mo
- Expected delta
- $0/yr ($0/mo · 0.0%)
ⓘ Screening estimate from a state-policy table — verify with the county assessor before closing.
Climate risk First Street
- Flood 7/10 Severe FEMA zone X · 93% chance over 30 yrs
- Wildfire 1/10 Low
- Heat 4/10 Moderate 8 d/yr ≥94°F today · 17 d/yr by 30 yrs out
- Wind 1/10 Low 100% chance of damaging wind over 30 yrs
- Air quality 2/10 Low 0 unhealthy d/yr today · 1 by 30 yrs out
Nearby sold comps map
Loading sold comps map…
Walkable amenities ~0.75 mi
Loading nearby amenities…
Taxation est. · year 1
- Rental income
- $82,188
- − Mortgage interest
- −$27,952
- − Property taxes
- −$9,185
- − Insurance
- −$3,162
- − Repairs & maintenance
- −$6,575
- − Management
- −$6,575
- − Depreciation
- −$14,516
- Taxable income
- $14,224
- Est. tax owed @ 24.0%
- −$3,414
- After-tax cash flow
- $17,767/yr
For passive investors: Depreciation is non-cash, so a rental often shows a tax loss while cash-flowing — sheltering income. Rental losses are passive: they offset passive income freely, and up to $25,000/yr can offset ordinary (W-2) income if you actively participate and your MAGI is under $100k (phasing out to $0 by $150k); unused losses carry forward. On sale, claimed depreciation is recaptured at up to 25%, and gains may owe capital-gains tax (a 1031 exchange can defer both). Figures are a year-1 estimate at your 24.0% rate — not tax advice; consult a CPA.
Schools (NCES district)
- District
- Ithaca City School District
- NCES district ID
- 3615570
- Math proficiency
- 57% ▼ -5.00%
- Reading proficiency
- 71% ▲ 11.00%
- Median HH income
- $46,528
- Composite
- 54.01/100
- National rank
- #1397
- State rank
- #195 of 590 in NY
Livability — Ithaca
- Score
- 77/100
- State rank
- #210
- US rank
- #3240
Category grades
Schools grade is shown separately in the Schools card above.
Census & demographics
- Census place
- Ithaca, NY
- County
- Tompkins County · 68,610 people
- City population
- 68,610
- Metro
- Ithaca, NY
- Population (ZIP)
- 68,610
- Household income
- $71,445
- Rent vs Own
- Severe rent burden
- 5169.0
Population outlook (Tompkins County) Hauer SSP2
- Today (2025)
- 113,958 people
- By 2030
- 118,774 · +4.2%
- By 2040
- 125,927 · +10.5%
- By 2050
- 133,599 · +17.2%
- By 2075
- 156,759 · +37.6%
- By 2100
- 169,896 · +49.1%
Race, ethnicity, and origin ACS 2023
- Neighborhood character
- Predominantly White (68%)
- Race & ethnicity
- White 68% Asian 13% Hispanic / Latino 8% Two or more races 8% Black 4%
- Hispanic origin (detail)
- Mexican 2% Puerto Rican 2%
- Common ancestry
- Romanian 3% Italian 3% Scotch-Irish 2%
- Foreign-born
- 18% · China, Canada, South Korea
- Languages at home
- 79% English-only · Chinese 5% Spanish 4% Other Indo-European 4%
Political lean MEDSL · Tompkins
- 2024 margin
- Solid D (+50.6) · D 75.3% · R 24.7%
- 2008→2024 swing
- +8.6pp toward D · 2008: 42.1pp · 2024: 50.6pp
- All cycles
- 2024: D+50.6 2020: D+49.2 2016: D+42.1 2012: D+39.8 2008: D+42.1
Not yet ingested
- Civics
- —
Market trends
- HPI YoY
- ▼ -276.59%
- Current HPI
- 389.7215
- Rent YoY
- ▲ 5.22%
- Metro
- Ithaca, NY
- State GDP YoY
- ▲ 2.60%
- F500 in state
- 92
Industry mix (Fortune 500 HQ in NY)
| Industry | F500 HQs | Revenue |
|---|---|---|
| Financial Services | 10 | $950B |
|
||
| Consumer Goods | 9 | $162B |
|
||
| Insurance | 4 | $225B |
|
||
| Telecommunications | 2 | $144B |
|
||
| Pharmaceuticals | 2 | $112B |
|
||
| Media / Entertainment | 2 | $69B |
|
||
Price history
+523.8% since first listed7 events — show timeline
- 2026-05-13 Price Changed $499,000 IBRMLS
- 2026-05-13 Price Changed $499,000 IBRMLS
- 2026-04-14 Listed $519,000 IBRMLS
- 2026-04-13 Listed $519,000 IBRMLS
- 2020-02-25 Listed $369,000 IBRMLS
- 2013-04-01 Sold (Public Records) $175,000 Public Records
- 1998-09-21 Sold (Public Records) $80,000 Public Records
Property tax history
+2.0%/yrLatest (2025): $9,185 · +2.3% YoY. Source: county tax records.
Cash-flow waterfall
monthlySold comps — $/sqft
last 12 mo · ≤1 miLoading sold comps…