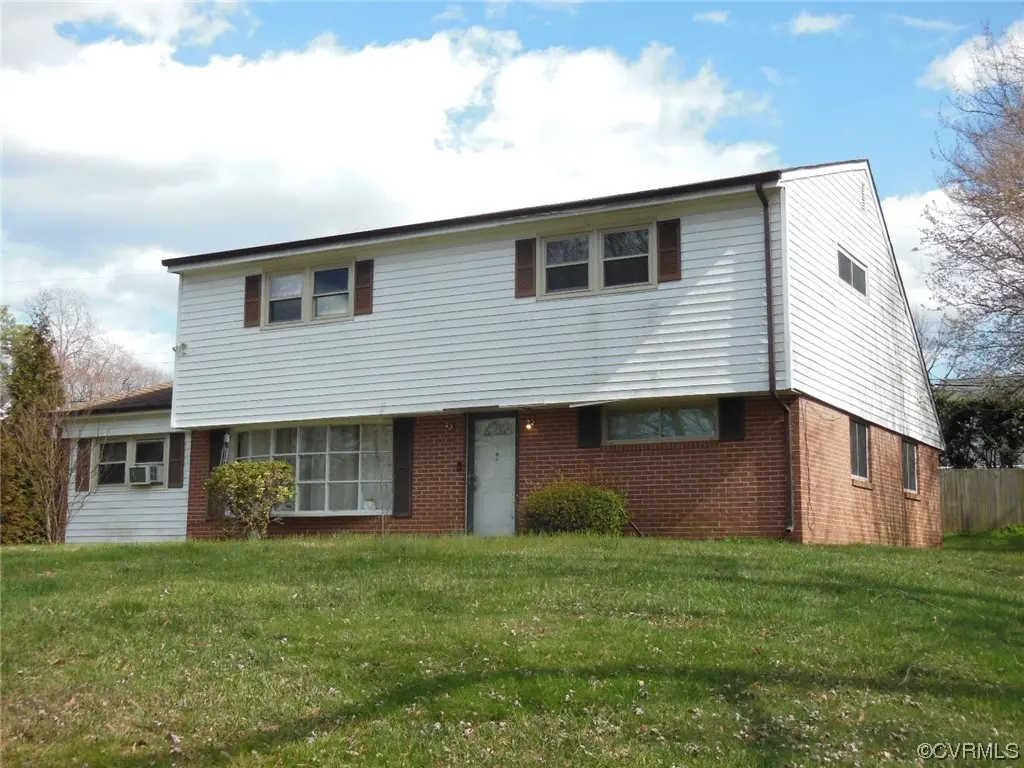
1305 Mormac Rd · Tuckahoe, VA
Flood risk 1/10 · Minimal
- FEMA flood zone
- X (unshaded)
- Chance of flooding over 30 yrs
- 0.0%
- Est. flood insurance / yr
- $507 – $1,088
Fire risk 1/10 · Minimal
- Est. fire insurance / yr
- $666 – $1,236
Heat risk 7/10 · Major
- Hot days now (above 104°F)
- 7 days/yr
- Hot days in 30 yrs
- 17 days/yr
Wind risk 5/10 · Moderate
- Chance of severe wind over 30 yrs
- 25.0%
Air-quality risk 2/10 · Minimal
- Unhealthy air days now
- 1 days/yr
- Unhealthy air days in 30 yrs
- 1 days/yr
Risk factors via First Street. Map © Google.
Why this score? — see what drove the C- grade
The composite is a weighted blend of 9 inputs, each scored 0–100. Each bar is that input's sub-score; the figure is the points it added to the 100-point composite (weight × sub-score).
- Cash flow +18.4/30.0
- ARV discount +8.8/15.0
- DSCR +5.8/10.0
- Schools +4.9/10.0
- 1% rule +4.2/10.0
- Livability +3.8/5.0
- Rent growth +3.3/5.0
- Condition / age +2.5/5.0
- Appreciation +0.0/10.0
$355,000
🖨 Deal sheet (PDF) 📄 Offer letter ✓ Due diligence
Listing remarks MLS
Property is placed in an upcoming AUCTION. * * * * OCCUPANTS ARE ABSOLUTELY NOT TO BE DISTURBED !! * * SOLD SIGHT UNSEEN * * NO SHOWINGS * * NO INTERIOR ACCESS * * Price Adjustment!!! List price basis per BPOs and/or appraisal. No offers will be accepted prior to the event dates. Property is being sold occupied with any and all occupants in AS IS/WHERE IS condition. Neither the seller nor the listing broker can verify the existence of any lease agreement, either written or verbal, nor any rental amount being paid, due or owing. Buyer is assuming ALL responsibility for any necessary eviction action. Listing broker & seller assume no responsibility and make no guarantees, warranties or representations as to the availability or accuracy of information herein. All info must be verified by the purchaser
Key facts
- 0.26 acre lot
- Parking
- Built 1959
Neighborhood map
What this means for you Summary
Snapshot
- This is a 4-bed/2.0-bath single-family listed at $355k.
Deal economics
- At list price, monthly cash flow is $330 ($4k/yr) — positive.
- The deal already cash-flows at list — no discount required.
- To meet the 1% rule (rent ≥ 1% of price), the offer needs to be $325k (8.5% below list).
- Recommended offer: $312k (12.0% below list) — sets the bar for market timing.
- Cap rate 7.4% vs local median 2.6% in Tuckahoe — top-decile yield for the area; either an underpriced asset or a hidden risk that comps aren't pricing in. Stress-test before assuming the spread holds.
Location & tenants
- Location reads 75/100 on livability (#128 in VA, #4,108 nationally) — a middle-class / working-renter tenant base. Strengths: employment A+, housing A+, crime A; Watch: amenities D+, cost of living D, commute F.
- Henrico County Public School District (suburban): math 49% / reading 64% proficiency, ranked #68 of 131 in VA (top 52%) — acceptable for families but not a draw, mixed tenant base, ~2y average lease.
- Zoned schools: Pinchbeck Elementary (math 33% / reading 44%, grade F, #924 of 1,108 statewide, top 84%, 522 students, 50% FRL); Quioccasin Middle (math 36% / reading 52%, grade D, #282 of 342 statewide, top 83%, 1,040 students, 89% FRL); Douglas S. Freeman High (math 63% / reading 89%, grade A-, #102 of 319 statewide, top 32%, 1,860 students, 40% FRL) — zoned schools average 60% FRL vs 34% district-wide (25 pts higher); higher-poverty schools than district average — tighter screening recommended.
- Market conditions: Rents rising (+3.1%/yr); 154 active listings in the ZIP; 6 comparable units currently listed for rent nearby; rentals at typical pace (median 16d on market — plan ~3-4 weeks tenant-placement turnaround); solid renter incomes; 1,826 units permitted in Henrico County in 2024 (785 in 5+ unit buildings).
- This rent runs 36% of the median local income ($108k/yr) — at the standard rent-burdened threshold; future hikes will face affordability resistance.
Forward outlook
- Local home prices are declining (-3.0%/yr); year-one equity from $2k of loan paydown is wiped out by about $11k of value loss. Plan a longer hold.
- Henrico County population projected at +21% by 2050 — long-run rental-demand tailwind backs the buy-and-hold thesis.
Negotiation context
- It's been on market 832 days — a 12% lower offer ($312k) is reasonable based on typical stale-listing flexibility.
- Current owner paid $170k; list at $355k implies a 109% gain — meaningful room to come down on a strong offer.
Risks & watch-outs
- Watch-outs: built in 1959 — expect roof / HVAC / electrical / plumbing capex.
- Climate carrying-cost: moderate wind risk, 25% chance of damaging wind over 30y; extreme-heat days projected 7→17/yr by 2055 (HVAC capex compounding) — expect insurance premiums to compound above CPI over the hold.
Questions for the listing agent
- It's been on market 832 days. Have you received any prior offers? Is the seller open to a 12% concession, seller financing, or rate buy-down credit?
- Built in 1959 — when were the roof, HVAC, electrical panel, plumbing, and water heater last replaced?
- Why hasn't it sold? Are there any deal-killer items the seller is aware of (foundation, flood, title, zoning, code violations)?
- Is there a deadline driving the sale (1031 exchange, divorce, estate, relocation)? That informs how much negotiation room exists.
- Schools are B-rated — typically a magnet for longer-tenancy family renters. What's the average tenant stay here, and is there a school-zone premium baked into asking?
- What's the average days-on-market for RENTAL listings here right now (not sales)? A rising rental-DOM trend means longer vacancies and softer asking-rent achievability than the comps imply.
- What's the recent tenant-quality profile in this submarket — average credit score on applications, eviction rate, late-payment / NSF rate, and stable-employment percentage? A property-management company in the area should have these aggregated.
- How much new for-sale + rental construction is in the pipeline within 1–3 miles? Heavy new supply typically softens prices + rents 12–24 months out; constrained supply supports both.
Investment metrics
- 1% rule
- 0.92% ✗
- Cap rate
- 7.41%
- Cash-on-cash
- 3.99%
- DSCR
- 1.18
- GRM
- 9.1
CMA / ARV
- ARV (median comp)
- $365,911
- List price
- $355,000
- Delta
- -2.98%
- Verdict
- FAIR
- Comps
- 20 within 1.0 mi
Show comp detail 12 sales within ~0.75 mi
| Address | Dist | Beds/Ba | Sqft | Sold | Price | $/sf | Match |
|---|---|---|---|---|---|---|---|
| 1300 Elon Rd | 0.23mi | 4/2.0 | 2,228 (0%) | 2mo | $435,000 | $195 | 88 |
| 9303 Farmington Dr | 0.25mi | 4/2.0 | 2,228 (0%) | 4mo | $382,000 | $171 | 85 |
| 1304 Grumman Dr | 0.08mi | 4/2.0 | 1,953 (-12%) | 1mo | $453,000 | $232 | 74 |
| 1220 Condover Rd | 0.10mi | 4/2.0 | 2,001 (-10%) | 8mo | $433,500 | $217 | 72 |
| 9208 Gayton Rd | 0.31mi | 3/2.5 (-1) | 2,330 (+5%) | 5mo | $466,000 | $200 | 67 |
| 1303 Elon Rd | 0.19mi | 5/3.0 (+1) | 2,540 (+14%) | 0mo | $490,000 | $193 | 59 |
| 1305 Barnard Dr | 0.41mi | 4/2.0 | 1,950 (-12%) | 3mo | $360,000 | $185 | 57 |
| 9215 Venetian Way | 0.46mi | 4/2.5 | 2,468 (+11%) | 3mo | $612,700 | $248 | 56 |
| 8708 Wytheland Rd | 0.65mi | 4/2.5 | 2,292 (+3%) | 10mo | $385,000 | $168 | 55 |
| 9417 Farmington Dr | 0.48mi | 4/2.5 | 2,068 (-7%) | 11mo | $345,000 | $167 | 55 |
| 9515 Lester Ln | 0.61mi | 4/2.0 | 1,953 (-12%) | 7mo | $399,900 | $205 | 45 |
| 9609 Della Dr | 0.64mi | 4/3.0 | 2,000 (-10%) | 9mo | $475,000 | $238 | 42 |
Match score weights: distance 35% · size 25% · config 20% · recency 20%. Top-matched comps best support the ARV.
Projected returns pro-forma
-3.0% appreciation · 3.11% rent growth · sell at horizon
- IRR
- -10.0%
- Equity multiple
- 0.64×
- Total profit
- $-36,223
- Equity at exit
- $52,932
- IRR
- -0.5%
- Equity multiple
- 0.97×
- Total profit
- $-3,329
- Equity at exit
- $30,694
Cash invested: $99,400 (down + closing). Projections, not guarantees.
Landlord ↔ Tenant lean methodology
- Overall (STATE)
- 55 Moderately Landlord-Leaning
- State Virginia
- 55 Moderately Landlord-Leaning · D+2
- County
- — inherits STATE
- City
- — inherits STATE
ZIP-level market 23229
- Rents YoY
- 3.1%
- Active inventory
- 154
- Price-to-rent
- 9.1×
Monthly cashflow live
- Estimated rent
- $3,248 high interval (Pro) →
- Mortgage (P&I)
- −$1,862
- Tax from tax record
- −$227 /mo · $2,718/yr
- Insurance
- −$148
- HOA
- −$0
- Vacancy / Maint / Mgmt
- −$682
- Net cashflow
- $330
Break-even live
Sensitivity live
| Price | -10% $531 | -5% $431 | +0% $330 | +5% $230 | +10% $129 |
|---|---|---|---|---|---|
| Rent | -10% $74 | -5% $202 | +0% $330 | +5% $458 | +10% $587 |
| Rate | -1.0pp $509 | -0.5pp $420 | base $330 | +0.5pp $238 | +1.0pp $145 |
UW: 25.0% down · 7.5% · 30yr · 1.5% tax · 5.0% vac · 8.0% maint · 8.0% mgmt
Financing live
Cash to close
- Down payment
- $88,750
- Closing costs
- $10,650
- Reserves months
- —
- Total cash needed
- —
Loan-product check · same deal, 3 products live
Conventional
25% down · 7.5% · 30yr
- Down + closing
- —
- Monthly P&I
- —
- Monthly cashflow
- —
- DSCR
- —
- Eligible?
- —
Personal DTI + credit; lowest rate.
DSCR
20% down · 8.5% · 30yr
- Down + closing
- —
- Monthly P&I
- —
- Monthly cashflow
- —
- DSCR
- —
- Eligible?
- —
No personal income docs; deal must DSCR.
Hard money
10% down · 12.0% · 12mo
- Down + closing
- —
- Monthly P&I
- —
- Monthly cashflow
- —
- DSCR
- —
- Eligible?
- —
Short-term bridge; refi at stabilization.
Rent comps 6 comps
| Address | Beds | Baths | Sqft | Rent | $/sqft | DOM | Units | Dist |
|---|---|---|---|---|---|---|---|---|
| 1303 Barnard Dr Henrico, VA | 5.0 | 2.0 | 1950 | $3,200 | $1.64 | 16d | 1 | 0.41mi |
| 100 Chase Gayton Dr Henrico, VA | 1.0–3.0 | 1.0–2.0 | 1090 | $2,278 | $2.09 | 3d | 22 | 0.85mi |
| 9621 Peppertree Dr Henrico, VA | 5.0 | 2.5 | 2352 | $5,850 | $2.49 | 45d | 1 | 1.02mi |
| 8602 Warrenton Dr Henrico, VA | 3.0 | 2.0 | 1800 | $3,600 | $2.00 | 45d | 1 | 1.19mi |
| 9609 University Blvd Henrico, VA | 4.0 | 1.5 | 1717 | $2,500 | $1.46 | 4d | 1 | 1.25mi |
| 10002 Castile Ct Henrico, VA | 1.0–3.0 | 1.0–2.5 | 1329 | $2,634 | $1.98 | 3d | 40 | 1.37mi |
Listing history 19 events
-
2026-06-21days on market $355,000 Active 832 DOM
-
2026-06-18days on market $355,000 Active 829 DOM
-
2026-06-17days on market $355,000 Active 828 DOM
-
2026-06-16days on market $355,000 Active 827 DOM
-
2026-06-15days on market $355,000 Active 826 DOM
-
2026-06-13days on market $355,000 Active 824 DOM
-
2026-06-09days on market $355,000 Active 820 DOM
-
2026-06-08days on market $355,000 Active 819 DOM
-
2026-06-07days on market $355,000 Active 818 DOM
-
2026-06-05days on market $355,000 Active 815 DOM
-
2026-06-03days on market $355,000 Active 814 DOM
-
2026-06-02days on market $355,000 Active 813 DOM
-
2026-06-01days on market $355,000 Active 812 DOM
-
2026-05-31days on market $355,000 Active 811 DOM
-
2025-10-01price $355,000 825-char remark
Show marketing remark (825 chars)
Property is placed in an upcoming AUCTION. * * * * OCCUPANTS ARE ABSOLUTELY NOT TO BE DISTURBED !! * * SOLD SIGHT UNSEEN * * NO SHOWINGS * * NO INTERIOR ACCESS * * Price Adjustment!!! List price basis per BPOs and/or appraisal. No offers will be accepted prior to the event dates. Property is being sold occupied with any and all occupants in AS IS/WHERE IS condition. Neither the seller nor the listing broker can verify the existence of any lease agreement, either written or verbal, nor any rental amount being paid, due or owing. Buyer is assuming ALL responsibility for any necessary eviction action. Listing broker & seller assume no responsibility and make no guarantees, warranties or representations as to the availability or accuracy of information herein. All info must be verified by the purchaser
-
2024-03-11$374,900 Active 825-char remark
Show marketing remark (825 chars)
Property is placed in an upcoming AUCTION. * * * * OCCUPANTS ARE ABSOLUTELY NOT TO BE DISTURBED !! * * SOLD SIGHT UNSEEN * * NO SHOWINGS * * NO INTERIOR ACCESS * * Price Adjustment!!! List price basis per BPOs and/or appraisal. No offers will be accepted prior to the event dates. Property is being sold occupied with any and all occupants in AS IS/WHERE IS condition. Neither the seller nor the listing broker can verify the existence of any lease agreement, either written or verbal, nor any rental amount being paid, due or owing. Buyer is assuming ALL responsibility for any necessary eviction action. Listing broker & seller assume no responsibility and make no guarantees, warranties or representations as to the availability or accuracy of information herein. All info must be verified by the purchaser
-
2006-01-27soldstatus $170,000
-
1996-09-01soldstatus $105,500
-
1996-05-01soldstatus $76,000
ⓘ Source: listings_history table (triggers on properties + properties_extension) + one-shot
backfill from property_details.listing_events for pre-trigger history.
Tax reassessment forecast VA · Resets to sale price
- Current annual tax
- $2,718 · $227/mo
- Projected year-2 tax
- $2,911 · $243/mo
- Expected delta
- +$193/yr (+$16/mo · 7.1%)
ⓘ Screening estimate from a state-policy table — verify with the county assessor before closing.
Climate risk First Street
- Flood 1/10 Low FEMA zone X (unshaded) · 0% chance over 30 yrs
- Wildfire 1/10 Low
- Heat 7/10 Severe 7 d/yr ≥104°F today · 17 d/yr by 30 yrs out
- Wind 5/10 Major 25% chance of damaging wind over 30 yrs
- Air quality 2/10 Low 1 unhealthy d/yr today · 1 by 30 yrs out
Nearby sold comps map
Loading sold comps map…
Walkable amenities ~0.75 mi
Loading nearby amenities…
Taxation est. · year 1
- Rental income
- $38,981
- − Mortgage interest
- −$19,886
- − Property taxes
- −$2,718
- − Insurance
- −$1,775
- − Repairs & maintenance
- −$3,118
- − Management
- −$3,118
- − Depreciation
- −$10,327
- Taxable loss
- −$1,962
- Est. tax savings @ 24.0%
- +$471
- After-tax cash flow
- $4,433/yr
For passive investors: Depreciation is non-cash, so a rental often shows a tax loss while cash-flowing — sheltering income. Rental losses are passive: they offset passive income freely, and up to $25,000/yr can offset ordinary (W-2) income if you actively participate and your MAGI is under $100k (phasing out to $0 by $150k); unused losses carry forward. On sale, claimed depreciation is recaptured at up to 25%, and gains may owe capital-gains tax (a 1031 exchange can defer both). Figures are a year-1 estimate at your 24.0% rate — not tax advice; consult a CPA.
Schools (NCES district)
- District
- Henrico County Public School District
- NCES district ID
- 5101890
- Math proficiency
- 49% ▼ -32.00%
- Reading proficiency
- 64% ▼ -12.00%
- Median HH income
- $61,854
- Composite
- 49.25/100
- National rank
- #2031
- State rank
- #68 of 131 in VA
Livability — Tuckahoe
- Score
- 75/100
- State rank
- #128
- US rank
- #4108
Category grades
Schools grade is shown separately in the Schools card above.
Census & demographics
- Census place
- Tuckahoe, VA
- County
- Henrico County · 334,490 people
- City population
- 26,050
- Metro
- Richmond, VA
- Population (ZIP)
- 35,689
- Household income
- $107,854
- Rent vs Own
- Severe rent burden
- 998.0
Population outlook (Henrico County) Hauer SSP2
- Today (2025)
- 365,885 people
- By 2030
- 384,255 · +5.0%
- By 2040
- 416,688 · +13.9%
- By 2050
- 442,376 · +20.9%
- By 2075
- 488,037 · +33.4%
- By 2100
- 487,430 · +33.2%
Race, ethnicity, and origin ACS 2023
- Neighborhood character
- Predominantly White (73%)
- Race & ethnicity
- White 73% Hispanic / Latino 9% Two or more races 7% Asian 7% Black 6%
- Hispanic origin (detail)
- Mexican 2%
- Common ancestry
- Slovak 4% Italian 3% Serbian 3%
- Foreign-born
- 16% · Canada, Vietnam, China
- Languages at home
- 80% English-only · Spanish 8% Other Indo-European 4% Arabic 3%
Political lean MEDSL · Henrico
- 2024 margin
- Strong D (+28.9) · D 63.7% · R 34.8% · Other 1.5%
- 2008→2024 swing
- +16.6pp toward D · 2008: 12.2pp · 2024: 28.9pp
- All cycles
- 2024: D+28.9 2020: D+29.0 2016: D+21.0 2012: D+11.7 2008: D+12.2
Not yet ingested
- Civics
- —
Market trends
- HPI YoY
- ▼ -316.94%
- Current HPI
- 361.1207
- Rent YoY
- ▲ 3.11%
- Metro
- Richmond, VA
- State GDP YoY
- ▲ 2.40%
- F500 in state
- 50
Industry mix (Fortune 500 HQ in VA)
| Industry | F500 HQs | Revenue |
|---|---|---|
| Aerospace / Defense | 4 | $236B |
|
||
| Technology / Defense | 3 | $32B |
|
||
| Financial Services | 2 | $176B |
|
||
| Utilities | 2 | $27B |
|
||
| Insurance | 2 | $25B |
|
||
| Technology | 2 | $15B |
|
||
Price history
+367.1% since first listed5 events — show timeline
- 2025-10-01 Price Changed $355,000 CVRMLS
- 2024-03-11 Listed $374,900 CVRMLS
- 2006-01-27 Sold (Public Records) $170,000 Public Records
- 1996-09-01 Sold (Public Records) $105,500 Public Records
- 1996-05-01 Sold (Public Records) $76,000 Public Records
Property tax history
+6.0%/yrLatest (2025): $2,718 · +5.9% YoY. Source: county tax records.
Cash-flow waterfall
monthlySold comps — $/sqft
last 12 mo · ≤1 miLoading sold comps…