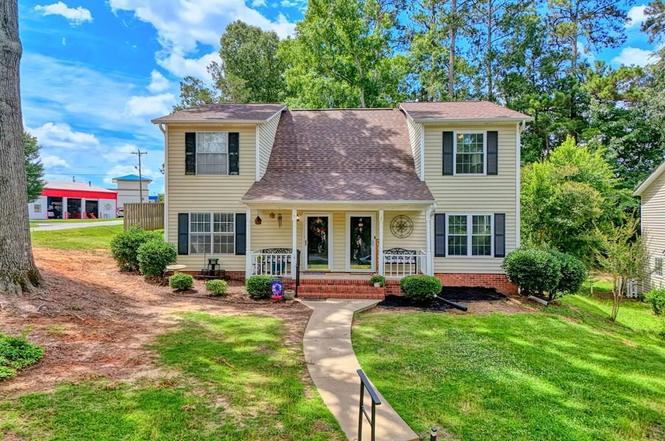
1225 Mathis Rd Ut2 Rd · Greenwood, SC
Flood risk 4/10 · Minor
- FEMA flood zone
- X (unshaded)
- Chance of flooding over 30 yrs
- 0.2%
- Est. flood insurance / yr
- $507 – $1,088
Fire risk 2/10 · Minimal
- Est. fire insurance / yr
- $783 – $1,453
Heat risk 6/10 · Moderate
- Hot days now (above 106°F)
- 7 days/yr
- Hot days in 30 yrs
- 18 days/yr
Wind risk 6/10 · Moderate
- Chance of severe wind over 30 yrs
- 27.0%
Air-quality risk 4/10 · Minor
- Unhealthy air days now
- 4 days/yr
- Unhealthy air days in 30 yrs
- 4 days/yr
Risk factors via First Street. Map © Google.
Why this score? — see what drove the B- grade
The composite is a weighted blend of 9 inputs, each scored 0–100. Each bar is that input's sub-score; the figure is the points it added to the 100-point composite (weight × sub-score).
- Cash flow +25.9/30.0
- ARV discount +13.0/15.0
- DSCR +8.7/10.0
- 1% rule +8.0/10.0
- Livability +3.2/5.0
- Schools +2.9/10.0
- Rent growth +2.5/5.0
- Condition / age +2.5/5.0
- Appreciation +0.0/10.0
$177,000
🖨 Deal sheet 📄 Offer letter ✓ Due diligence
Listing remarks MLS
3 bedroom, 2 bath condo with family room, kitchen with dining area, separate laundry room, & sun porch. One bedroom and full bath downstairs. Large master bedroom upstairs with lots of storage space. Also upstairs is an additional bedroom and full bath.
Key facts
- Thermopane windows
- Granite counter tops
- 1,292 sq ft lot
Tags
Property features AI
Finance
- Other: Property backs up to Regency Park; Subdivision: GREEN POINTE; Directions: Mathis Rd across from Brewster's Ice Cream Parlor
- HOA & community: Homeowners association with a $150 monthly fee; HOA fee includes insurance and grounds maintenance; Community has street lights
Exterior
- Security: Smoke detectors
- Utilities: Natural gas connected; Public sewer connected; Public water connected
- Home design: Single-family residence; Residential property
- Construction: Vinyl siding; Slab foundation; Built with vinyl materials
- Exterior features: Covered front porch; Shed; Rolling slope lot; County road frontage (publicly maintained)
Interior
- Kitchen: Dishwasher; Electric range; Microwave; Refrigerator; Electric water heater
- Flooring: Vinyl flooring
- Bathrooms: 2 full bathrooms
- Heating & cooling: Heat pump heating; Central electric cooling; Ceiling fans
- Interior features: Eat-in kitchen; Cathedral ceilings; Ceiling fans; Granite countertops; Insulated windows
- Laundry & utility: Dryer
Neighborhood map
What this means for you Summary
Snapshot
- This is a 3-bed/2.0-bath single-family listed at $177k.
Deal economics
- At list price, monthly cash flow is $438 ($5k/yr) — positive.
- The deal already cash-flows at list — no discount required.
- Meets the 1% rule at list price ($2k rent vs $177k).
- Cap rate 9.3% vs local median 3.6% in Greenwood — top-decile yield for the area; either an underpriced asset or a hidden risk that comps aren't pricing in. Stress-test before assuming the spread holds.
Location & tenants
- Location reads 63/100 on livability (#167 in SC) — a middle-class / working-renter tenant base. Strengths: cost of living A+, health & safety A+, housing A; Watch: amenities D, schools F, crime F.
- Greenwood 50 (town): math 31% / reading 39% proficiency, ranked #43 of 80 in SC (top 54%) — families likely to look elsewhere, expect single-tenant / working-renter base with shorter leases.
- Market conditions: 253 active listings in the ZIP; 4 comparable units currently listed for rent nearby; rentals at typical pace (median 24d on market — plan ~3-4 weeks tenant-placement turnaround); 193 units permitted in Greenwood County in 2024 (0 in 5+ unit buildings).
- At $2,292/mo this rent would consume 50% of the median local household income ($55k/yr) (locally 566% of renters already pay >50% of income on rent) — very limited rent-growth headroom before tenants either downsize or default.
Forward outlook
- Local home prices are declining (-3.0%/yr); year-one equity from $1k of loan paydown is wiped out by about $5k of value loss. Plan a longer hold.
- Greenwood County population projected to shrink 8% by 2050 — rents likely to lag national; underwrite the cash flow, not the appreciation.
Negotiation context
- Only 3 days on market — expect competitive offers; lowballing is unlikely to land.
- 15 sale attempts since 20y ago with the ask held roughly flat each time — persistent listings suggest the price (not the market) is what's stuck; bring a comps-based counter.
Risks & watch-outs
- Climate carrying-cost: major wind risk, 27% chance of damaging wind over 30y; extreme-heat days projected 7→18/yr by 2055 (HVAC capex compounding) — expect insurance premiums to compound above CPI over the hold.
Questions for the listing agent
- What does the HOA fee cover, when was the last increase, and are there any pending special assessments or reserve-fund shortfalls?
- Is there a deadline driving the sale (1031 exchange, divorce, estate, relocation)? That informs how much negotiation room exists.
- Schools are F-rated, which usually means shorter tenancies and higher turnover. Who's the typical renter profile here, and what's been the actual vacancy rate?
- Crime grade is F in this area — have there been break-ins, vandalism, or insurance claims at this property in the last 3 years? What carrier currently insures it and at what premium?
- What's the average days-on-market for RENTAL listings here right now (not sales)? A rising rental-DOM trend means longer vacancies and softer asking-rent achievability than the comps imply.
- What's the recent tenant-quality profile in this submarket — average credit score on applications, eviction rate, late-payment / NSF rate, and stable-employment percentage? A property-management company in the area should have these aggregated.
- How much new for-sale + rental construction is in the pipeline within 1–3 miles? Heavy new supply typically softens prices + rents 12–24 months out; constrained supply supports both.
Investment metrics
- 1% rule
- 1.30% ✓
- Cap rate
- 9.26%
- Cash-on-cash
- 10.60%
- DSCR
- 1.47
- GRM
- 6.4
CMA / ARV
- ARV (on-the-fly)
- $201,600
- Comps found
- 5
Show comp detail 5 sales within ~0.75 mi
| Address | Dist | Beds/Ba | Sqft | Sold | Price | $/sf | Match |
|---|---|---|---|---|---|---|---|
| 109 Shortleaf Ct | 0.53mi | 3/2.0 | 1,244 (+4%) | 1mo | $235,000 | $189 | 68 |
| 1411 Mathis Rd | 0.47mi | 3/2.0 | 1,130 (-6%) | 19mo | $190,000 | $168 | 52 |
| 227 Loblolly Cir | 0.48mi | 3/2.0 | 1,344 (+12%) | 10mo | $219,000 | $163 | 49 |
| 112 Eastman St | 0.68mi | 2/1.0 (-1) | 1,184 (-1%) | 14mo | $210,000 | $177 | 45 |
| 138 Country Vlg | 0.53mi | 2/1.5 (-1) | 1,020 (-15%) | 14mo | $97,000 | $95 | 31 |
Match score weights: distance 35% · size 25% · config 20% · recency 20%. Top-matched comps best support the ARV.
Projected returns pro-forma
-3.0% appreciation · 3.0% rent growth · sell at horizon
- IRR
- -0.4%
- Equity multiple
- 0.99×
- Total profit
- $-679
- Equity at exit
- $26,391
- IRR
- 9.4%
- Equity multiple
- 1.72×
- Total profit
- $35,819
- Equity at exit
- $15,304
Cash invested: $49,560 (down + closing). Projections, not guarantees.
Landlord ↔ Tenant lean methodology
- Overall (STATE)
- 90 Strongly Landlord-Friendly
- State South Carolina
- 90 Strongly Landlord-Friendly · R+6
- County
- — inherits STATE
- City
- — inherits STATE
ZIP-level market 29649
- Active inventory
- 253
- Price-to-rent
- 6.4×
Monthly cashflow live
- Estimated rent
- $2,292 medium interval (Pro) →
- Mortgage (P&I)
- −$928
- Tax est. 1.5%
- −$221 /mo · $2,655/yr
- Insurance
- −$74
- HOA
- −$150
- Vacancy / Maint / Mgmt
- −$481
- Net cashflow
- $438
Break-even live
UW: 25.0% down · 7.5% · 30yr · 1.5% tax · 5.0% vac · 8.0% maint · 8.0% mgmt
Financing live
Cash to close
- Down payment
- $44,250
- Closing costs
- $5,310
- Reserves months
- —
- Total cash needed
- —
Loan-product check · same deal, 3 products live
Conventional
25% down · 7.5% · 30yr
- Down + closing
- —
- Monthly P&I
- —
- Monthly cashflow
- —
- DSCR
- —
- Eligible?
- —
Personal DTI + credit; lowest rate.
DSCR
20% down · 8.5% · 30yr
- Down + closing
- —
- Monthly P&I
- —
- Monthly cashflow
- —
- DSCR
- —
- Eligible?
- —
No personal income docs; deal must DSCR.
Hard money
10% down · 12.0% · 12mo
- Down + closing
- —
- Monthly P&I
- —
- Monthly cashflow
- —
- DSCR
- —
- Eligible?
- —
Short-term bridge; refi at stabilization.
Rent comps 4 comps
| Address | Beds | Baths | Sqft | Rent | $/sqft | DOM | Units | Dist |
|---|---|---|---|---|---|---|---|---|
| 210 Woodhaven Ct Unit 210 Greenwood, SC | 2.0 | 2.0 | 1305 | $2,500 | $1.92 | 23d | 1 | 0.80mi |
| 218 Woodhaven Ct Unit 218 Greenwood, SC | 2.0 | 2.0 | 1218 | $2,600 | $2.13 | 14d | 1 | 0.83mi |
| 218 Woodhaven Ct Greenwood, SC | 2.0 | 2.0 | 1218 | $2,600 | $2.13 | 23d | 1 | 0.83mi |
| 104 Woodhaven Ct Unit 104 Greenwood, SC | 2.0 | 2.0 | 1305 | $2,500 | $1.92 | 23d | 1 | 0.86mi |
HOA detail
- Monthly dues
- $150 · $1,800/yr
Listing history 4 events
-
2026-06-19days on market $177,000 Active 3 DOM
-
2026-06-18days on market $177,000 Active 2 DOM
-
2026-06-17remarks 569-char remark
-
2026-06-17$177,000 Active 1 DOM
ⓘ Source: listings_history table (triggers on properties + properties_extension) + one-shot
backfill from property_details.listing_events for pre-trigger history.
Climate risk First Street
- Flood 4/10 Moderate FEMA zone X (unshaded) · 20% chance over 30 yrs
- Wildfire 2/10 Low
- Heat 6/10 Major 7 d/yr ≥106°F today · 18 d/yr by 30 yrs out
- Wind 6/10 Major 27% chance of damaging wind over 30 yrs
- Air quality 4/10 Moderate 4 unhealthy d/yr today · 4 by 30 yrs out
Nearby sold comps map
Loading sold comps map…
Walkable amenities ~0.75 mi
Loading nearby amenities…
Taxation est. · year 1
- Rental income
- $27,507
- − Mortgage interest
- −$9,915
- − Property taxes
- −$2,655
- − Insurance
- −$885
- − Repairs & maintenance
- −$2,201
- − Management
- −$2,201
- − HOA
- −$1,800
- − Depreciation
- −$5,149
- Taxable income
- $2,702
- Est. tax owed @ 24.0%
- −$649
- After-tax cash flow
- $4,604/yr
For passive investors: Depreciation is non-cash, so a rental often shows a tax loss while cash-flowing — sheltering income. Rental losses are passive: they offset passive income freely, and up to $25,000/yr can offset ordinary (W-2) income if you actively participate and your MAGI is under $100k (phasing out to $0 by $150k); unused losses carry forward. On sale, claimed depreciation is recaptured at up to 25%, and gains may owe capital-gains tax (a 1031 exchange can defer both). Figures are a year-1 estimate at your 24.0% rate — not tax advice; consult a CPA.
Schools (NCES district)
- District
- Greenwood 50
- NCES district ID
- 4502340
- Math proficiency
- 31% ▼ -4.00%
- Reading proficiency
- 39% ▲ 2.00%
- Median HH income
- $37,663
- Composite
- 29.14/100
- National rank
- #6585
- State rank
- #43 of 80 in SC
Livability — Greenwood
- Score
- 63/100
- State rank
- #167
- US rank
- #15097
Category grades
Schools grade is shown separately in the Schools card above.
Census & demographics
- County
- Greenwood County · 26,275 people
- City population
- 26,275
- Metro
- Greenwood, SC
- Population (ZIP)
- 26,275
- Household income
- $54,585
- Rent vs Own
- Severe rent burden
- 566.0
Population outlook (Greenwood County) Hauer SSP2
- Today (2025)
- 69,627 people
- By 2030
- 68,905 · -1.0%
- By 2040
- 66,640 · -4.3%
- By 2050
- 63,768 · -8.4%
- By 2075
- 55,769 · -19.9%
- By 2100
- 47,293 · -32.1%
Race, ethnicity, and origin ACS 2023
- Neighborhood character
- Predominantly White (65%)
- Race & ethnicity
- White 65% Black 25% Hispanic / Latino 4% Two or more races 4% Asian 2%
- Common ancestry
- Serbian 3% Italian 3% Slovak 3%
- Foreign-born
- 4% · Canada, China
- Languages at home
- 97% English-only · Spanish 2%
Political lean MEDSL · Greenwood
- 2024 margin
- Strong R (+29.0) · D 34.9% · R 63.8% · Other 1.3%
- 2008→2024 swing
- -13.3pp toward R · 2008: -15.7pp · 2024: -29.0pp
- All cycles
- 2024: R+29.0 2020: R+22.8 2016: R+21.8 2012: R+15.4 2008: R+15.7
Not yet ingested
- Civics
- —
Market trends
- HPI YoY
- ▼ -128.00%
- Current HPI
- 167.9262
- Rent YoY
- —
- Metro
- Greenwood, SC
- State GDP YoY
- ▲ 4.51%
- F500 in state
- 2
Industry mix (Fortune 500 HQ in SC)
| Industry | F500 HQs | Revenue |
|---|---|---|
| Packaging | 1 | $7B |
|
||
Price history
+142.5% since first listed31 events — show timeline
- 2026-06-12 Listed $177,000 GAOR
- 2025-02-17 Sold (MLS) $154,900 GAOR
- 2025-01-07 Contingent — GAOR
- 2024-12-20 Listed $154,900 GAOR
- 2024-08-08 Sold (MLS) $154,900 GAOR
- 2024-07-11 Contingent — GAOR
- 2024-07-09 Listed $154,900 GAOR
- 2022-08-01 Sold (MLS) $136,000 GAOR
- 2022-06-07 Sold (MLS) $136,000 GAOR
- 2022-06-06 Listed $140,000 GAOR
- 2022-05-04 Sold (MLS) $130,000 GAOR
- 2022-04-08 Listed $145,000 GAOR
- 2022-02-09 Listed $129,900 GAOR
- 2020-10-16 Sold (MLS) $88,500 GAOR
- 2020-08-20 Listed $85,000 GAOR
- 2015-12-01 Sold (MLS) $64,000 GAOR
- 2015-05-15 Sold (MLS) $75,900 GAOR
- 2015-01-29 Listed $69,900 GAOR
- 2015-01-06 Listed $79,900 GAOR
- 2011-08-11 Sold (MLS) $69,500 GAOR
- 2010-11-21 Listed $74,900 GAOR
- 2010-02-11 Sold (MLS) $67,000 GAOR
- 2009-12-08 Sold (MLS) $74,000 GAOR
- 2009-09-01 Listed $73,900 GAOR
- 2009-07-29 Listed $74,000 GAOR
- 2009-07-08 Sold (MLS) $74,000 GAOR
- 2008-10-31 Listed $78,900 GAOR
- 2007-09-21 Sold (MLS) $74,000 GAOR
- 2007-05-28 Listed $74,500 GAOR
- 2006-09-13 Sold (MLS) $70,000 GAOR
- 2006-07-28 Listed $73,000 GAOR
Cash-flow waterfall
monthlySold comps — $/sqft
last 12 mo · ≤1 miLoading sold comps…