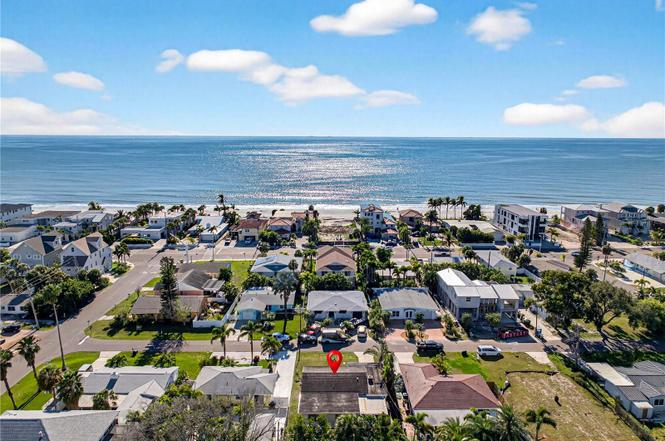
16105 1st St E · Redington Beach, FL
Flood risk 10/10 · Severe
- FEMA flood zone
- AE
- Chance of flooding over 30 yrs
- 0.99%
- Est. flood insurance / yr
- $1,737 – $8,500
Fire risk 1/10 · Minimal
- Est. fire insurance / yr
- $947 – $1,759
Heat risk 10/10 · Severe
- Hot days now (above 108°F)
- 8 days/yr
- Hot days in 30 yrs
- 29 days/yr
Wind risk 10/10 · Severe
- Chance of severe wind over 30 yrs
- 99.0%
Air-quality risk 3/10 · Minor
- Unhealthy air days now
- 2 days/yr
- Unhealthy air days in 30 yrs
- 2 days/yr
Risk factors via First Street. Map © Google.
Why this score? — see what drove the C grade
The composite is a weighted blend of 9 inputs, each scored 0–100. Each bar is that input's sub-score; the figure is the points it added to the 100-point composite (weight × sub-score).
- Cash flow +19.5/30.0
- ARV discount +15.0/15.0
- DSCR +6.2/10.0
- 1% rule +4.3/10.0
- Schools +4.3/10.0
- Livability +3.4/5.0
- Condition / age +2.5/5.0
- Rent growth +2.1/5.0
- Appreciation +0.0/10.0
$425,000
🖨 Deal sheet (PDF) 📄 Offer letter ✓ Due diligence
Listing remarks
Under contract-accepting backup offers. LOCATION, LOCATION, LOCATION! Just one block from the sugar-sand beaches of Redington Beach, this solid block home offers an incredible opportunity to create your own coastal retreat. Featuring 2 bedrooms, 2 bathrooms, a spacious living room and family room, plus a screened rear porch, the layout provides flexibility with room to reimagine. The home has been professionally remediated and is ready for its new owner, providing a solid starting point for your vision. With plenty of space for a pool, the possibilities are endless—repair, renovate, or rebuild to suit your needs. Whether you’re seeking a short-term rental, vacation getaway, or p
Key facts
- Screened rear porch
- Space for a pool
- Investment potential
Tags
Property features AI
Finance
- Other: Property listed as unfurnished
- HOA & community: No HOA/association
Exterior
- Parking: Carport (1 space)
- Utilities: Electricity available; Water available; Sewer available; Private sewer
- Home design: Single-family residence; One-story; Faces west; Residential property
- Construction: Block construction; Concrete and tile roof; Slab foundation; Built on one level
- Exterior features: Rear screened porch; Asphalt road access
Interior
- Kitchen: No appliances listed
- Bedrooms: 2 bedrooms
- Flooring: Terrazzo flooring
- Bathrooms: 2 full bathrooms
- Heating & cooling: Central heating; Central air conditioning
- Interior features: No interior features listed
- Laundry & utility: Washer hookup; Electric dryer hookup
Neighborhood map
What this means for you Summary
Snapshot
- This is a 2-bed/1.5-bath single-family listed at $425k.
Deal economics
- At list price, monthly cash flow is $55 ($655/yr) — positive.
- The deal already cash-flows at list — no discount required.
- To meet the 1% rule (rent ≥ 1% of price), the offer needs to be $395k (7.1% below list).
- Recommended offer: $387k (9.0% below list) — sets the bar for market timing.
- Cap rate 7.7% vs local median 1.6% in Redington Beach — top-decile yield for the area; either an underpriced asset or a hidden risk that comps aren't pricing in. Stress-test before assuming the spread holds.
Location & tenants
- Location reads 67/100 on livability (#558 in FL) — a middle-class / working-renter tenant base. Strengths: crime A+, employment A+, health & safety A+; Watch: amenities F, cost of living F.
- Pinellas (suburban): math 51% / reading 51% proficiency, ranked #31 of 73 in FL (top 42%) — acceptable for families but not a draw, mixed tenant base, ~2y average lease.
- Zoned schools: Bauder Elementary School (math 80% / reading 73%, grade A, #185 of 2,144 statewide, top 9%, 644 students, 28% FRL); Seminole Middle School (math 55% / reading 53%, grade B-, #196 of 571 statewide, top 36%, 824 students, 49% FRL); Seminole High School (math 26% / reading 47%, grade F, #351 of 667 statewide, top 54%, 1,546 students, 39% FRL).
- Market conditions: Rents soft (-1.8%/yr); 573 active listings in the ZIP; 40 comparable units currently listed for rent nearby; rentals at typical pace (median 19d on market — plan ~3-4 weeks tenant-placement turnaround); solid renter incomes; 2,676 units permitted in Pinellas County in 2024 (1,422 in 5+ unit buildings).
- At $3,948/mo this rent would consume 57% of the median local household income ($82k/yr) (locally 734% of renters already pay >50% of income on rent) — very limited rent-growth headroom before tenants either downsize or default.
Forward outlook
- Local home prices are declining (-3.0%/yr); year-one equity from $3k of loan paydown is wiped out by about $13k of value loss. Plan a longer hold.
- Pinellas County population projected at +14% by 2050 — modest demand growth; plan on rents tracking national, not racing it.
Negotiation context
- It's been on market 95 days — a 9% lower offer ($387k) is reasonable based on typical stale-listing flexibility.
Risks & watch-outs
- Watch-outs: flood insurance adds $427/mo; built in 1957 — expect roof / HVAC / electrical / plumbing capex.
- Climate carrying-cost: in FEMA flood zone AE (mandatory federal flood insurance); severe wind risk, 99% chance of damaging wind over 30y; extreme-heat days projected 8→29/yr by 2055 (HVAC capex compounding) — expect insurance premiums to compound above CPI over the hold.
Questions for the listing agent
- It's been on market 95 days. Have you received any prior offers? Is the seller open to a 9% concession, seller financing, or rate buy-down credit?
- Built in 1957 — when were the roof, HVAC, electrical panel, plumbing, and water heater last replaced?
- What's the actual annual flood-insurance premium (NFIP or private), and is the property in a SFHA with mandatory coverage?
- Why hasn't it sold? Are there any deal-killer items the seller is aware of (foundation, flood, title, zoning, code violations)?
- Is there a deadline driving the sale (1031 exchange, divorce, estate, relocation)? That informs how much negotiation room exists.
- Schools are D-rated, which usually means shorter tenancies and higher turnover. Who's the typical renter profile here, and what's been the actual vacancy rate?
- What's the average days-on-market for RENTAL listings here right now (not sales)? A rising rental-DOM trend means longer vacancies and softer asking-rent achievability than the comps imply.
- What's the recent tenant-quality profile in this submarket — average credit score on applications, eviction rate, late-payment / NSF rate, and stable-employment percentage? A property-management company in the area should have these aggregated.
- How much new for-sale + rental construction is in the pipeline within 1–3 miles? Heavy new supply typically softens prices + rents 12–24 months out; constrained supply supports both.
Investment metrics
- 1% rule
- 0.93% ✗
- Cap rate
- 7.65%
- Cash-on-cash
- 4.85%
- DSCR
- 1.22
- GRM
- 9.0
CMA / ARV
- ARV (on-the-fly)
- $595,680
- Comps found
- 12
Show comp detail 12 sales within ~0.75 mi
| Address | Dist | Beds/Ba | Sqft | Sold | Price | $/sf | Match |
|---|---|---|---|---|---|---|---|
| 16033 Redington Dr | 0.24mi | 3/2.0 (+1) | 1,401 (-4%) | 1mo | $942,500 | $673 | 74 |
| 205 163rd Ave | 0.18mi | 2/1.5 | 1,380 (-6%) | 10mo | $325,000 | $236 | 74 |
| 16104 Redington Dr | 0.11mi | 2/1.0 | 1,358 (-7%) | 10mo | $305,000 | $225 | 73 |
| 15814 3rd St E | 0.25mi | 2/2.0 | 1,530 (+5%) | 7mo | $430,000 | $281 | 73 |
| 16343 Redington Dr | 0.39mi | 2/2.0 | 1,512 (+4%) | 5mo | $815,000 | $539 | 70 |
| 16304 3rd St E | 0.21mi | 3/2.5 (+1) | 1,556 (+7%) | 5mo | $385,000 | $247 | 66 |
| 16214 Redington Dr | 0.17mi | 3/1.5 (+1) | 1,292 (-12%) | 4mo | $600,000 | $464 | 64 |
| 16006 Redington Dr | 0.14mi | 3/2.0 (+1) | 1,280 (-12%) | 2mo | $585,000 | $457 | 64 |
| 15909 1st St E | 0.18mi | 3/2.0 (+1) | 1,540 (+6%) | 14mo | $370,000 | $240 | 64 |
| 16212 1st St E | 0.13mi | 3/2.5 (+1) | 1,629 (+12%) | 9mo | $430,000 | $264 | 58 |
| 16312 Redington Dr | 0.27mi | 3/2.0 (+1) | 1,300 (-11%) | 15mo | $530,000 | $408 | 50 |
| 16018 Redington Dr | 0.19mi | 3/2.0 (+1) | 1,270 (-13%) | 16mo | $695,000 | $547 | 49 |
Match score weights: distance 35% · size 25% · config 20% · recency 20%. Top-matched comps best support the ARV.
Projected returns pro-forma
-3.0% appreciation · 0.0% rent growth · sell at horizon
- IRR
- -19.0%
- Equity multiple
- 0.35×
- Total profit
- $-76,821
- Equity at exit
- $63,369
- IRR
- -19.7%
- Equity multiple
- 0.10×
- Total profit
- $-106,569
- Equity at exit
- $36,746
Cash invested: $119,000 (down + closing). Projections, not guarantees.
Landlord ↔ Tenant lean methodology
- Overall (STATE)
- 87 Strongly Landlord-Friendly
- State Florida
- 87 Strongly Landlord-Friendly · R+3
- County
- — inherits STATE
- City
- — inherits STATE
ZIP-level market 33708
- Rents YoY
- -1.8%
- Active inventory
- 573
- Price-to-rent
- 9.0×
Monthly cashflow live
- Estimated rent
- $3,948 high interval (Pro) →
- Mortgage (P&I)
- −$2,229
- Tax from tax record
- −$232 /mo · $2,782/yr
- Insurance
- −$177
- Flood insurance flood zone
- −$427 /mo · $5,118/yr
- HOA
- −$0
- Vacancy / Maint / Mgmt
- −$829
- Net cashflow
- $55
Break-even live
Sensitivity live
| Price | -10% $295 | -5% $175 | +0% $55 | +5% $-66 | +10% $-186 |
|---|---|---|---|---|---|
| Rent | -10% $-257 | -5% $-101 | +0% $55 | +5% $211 | +10% $367 |
| Rate | -1.0pp $269 | -0.5pp $163 | base $55 | +0.5pp $-56 | +1.0pp $-168 |
UW: 25.0% down · 7.5% · 30yr · 1.5% tax · 5.0% vac · 8.0% maint · 8.0% mgmt
Financing live
Cash to close
- Down payment
- $106,250
- Closing costs
- $12,750
- Reserves months
- —
- Total cash needed
- —
Loan-product check · same deal, 3 products live
Conventional
25% down · 7.5% · 30yr
- Down + closing
- —
- Monthly P&I
- —
- Monthly cashflow
- —
- DSCR
- —
- Eligible?
- —
Personal DTI + credit; lowest rate.
DSCR
20% down · 8.5% · 30yr
- Down + closing
- —
- Monthly P&I
- —
- Monthly cashflow
- —
- DSCR
- —
- Eligible?
- —
No personal income docs; deal must DSCR.
Hard money
10% down · 12.0% · 12mo
- Down + closing
- —
- Monthly P&I
- —
- Monthly cashflow
- —
- DSCR
- —
- Eligible?
- —
Short-term bridge; refi at stabilization.
Rent comps 40 comps
| Address | Beds | Baths | Sqft | Rent | $/sqft | DOM | Units | Dist |
|---|---|---|---|---|---|---|---|---|
| 16109 3rd St E Redington Beach, FL | 3.0 | 2.0 | 1772 | $5,500 | $3.10 | 6d | 1 | 0.06mi |
| 104 163rd Ave Redington Beach, FL | 2.0 | 2.0 | 1108 | $3,200 | $2.89 | 19d | 1 | 0.17mi |
| 16308 Gulf Blvd #408 Redington Beach, FL | 2.0 | 2.0 | 1065 | $5,000 | $4.69 | 6d | 1 | 0.24mi |
| 10 158th Ave Redington Beach, FL | 2.0 | 2.0 | 1700 | $2,975 | $1.75 | 26d | 1 | 0.34mi |
| 16330 Gulf Blvd #304 Redington Beach, FL | 2.0 | 2.0 | 1375 | $6,999 | $5.09 | 6d | 1 | 0.34mi |
| 16613 Gulf Blvd North Redington Beach, FL | 3.0 | 2.0 | 1243 | $5,000 | $4.02 | 26d | 1 | 0.39mi |
| 16450 Gulf Blvd #564 North Redington Beach, FL | 3.0 | 2.0 | 1460 | $9,500 | $6.51 | 6d | 1 | 0.40mi |
| 16500 Gulf Blvd #355 North Redington Beach, FL | 3.0 | 2.0 | 1460 | $9,000 | $6.16 | 6d | 1 | 0.44mi |
| 16550 Gulf Blvd #643 North Redington Beach, FL | 2.0 | 2.0 | 1230 | $8,000 | $6.50 | 26d | 1 | 0.48mi |
| 16550 Gulf Blvd #545 North Redington Beach, FL | 2.0 | 2.0 | 1230 | $4,500 | $3.66 | 16d | 1 | 0.48mi |
| 16700 Gulf Blvd #624 North Redington Beach, FL | 2.0 | 2.0 | 1190 | $7,000 | $5.88 | 26d | 1 | 0.57mi |
| 16700 Gulf Blvd #423 North Redington Beach, FL | 3.0 | 2.0 | 1435 | $9,500 | $6.62 | 26d | 1 | 0.57mi |
| 15565 Gulf Blvd Redington Beach, FL | 3.0 | 2.5 | 1678 | $3,600 | $2.15 | 9d | 1 | 0.58mi |
| 15462 Gulf Blvd #501 Madeira Beach, FL | 2.0 | 2.0 | 1100 | $3,800 | $3.45 | 4d | 1 | 0.71mi |
| 15462 Gulf Blvd #508 Madeira Beach, FL | 2.0 | 2.5 | 1100 | $3,800 | $3.45 | 6d | 1 | 0.71mi |
| 15400 Gulf Blvd Unit 1546427P Madeira Beach, FL | 2.0 | 2.0 | 1184 | $3,742 | $3.16 | 16d | 1 | 0.75mi |
| 15398 2nd St E Madeira Beach, FL | 2.0 | 2.0 | 1296 | $2,795 | $2.16 | 18d | 1 | 0.78mi |
| 17045 Dolphin Dr North Redington Beach, FL | 2.0 | 2.5 | 1176 | $4,000 | $3.40 | 6d | 1 | 0.79mi |
| 17035 Gulf Blvd #104 North Redington Beach, FL | 2.0 | 2.0 | 900 | $3,000 | $3.33 | 22d | 1 | 0.80mi |
| 535 173rd Ave E North Redington Beach, FL | 2.0 | 2.0 | 1189 | $3,895 | $3.28 | 6d | 1 | 0.88mi |
| 5434 Oakhurst Dr Seminole, FL | 3.0 | 2.0 | 1719 | $6,000 | $3.49 | 26d | 1 | 0.88mi |
| 17105 Gulf Blvd North Redington Beach, FL | 1.0–2.0 | 1.0–2.0 | 999 | $2,440 | $2.44 | 0d | 10 | 0.91mi |
| 573 Boca Ciega Point Blvd N Saint Petersburg, FL | 2.0 | 2.0 | 1400 | $3,650 | $2.61 | 26d | 1 | 0.97mi |
| 4750 Cove Cir #302 Saint Petersburg, FL | 2.0 | 2.0 | 1040 | $2,500 | $2.40 | 26d | 1 | 1.01mi |
| 4775 Cove Cir #202 Saint Petersburg, FL | 2.0 | 2.0 | 1050 | $1,850 | $1.76 | 26d | 1 | 1.09mi |
| 4775 Cove Cir #508 Saint Petersburg, FL | 2.0 | 2.0 | 1050 | $2,000 | $1.90 | 25d | 1 | 1.09mi |
| 4775 Cove Cir #1102 Saint Petersburg, FL | 2.0 | 2.0 | 1050 | $1,700 | $1.62 | 9d | 1 | 1.09mi |
| 4775 Cove Cir #1202 Saint Petersburg, FL | 2.0 | 2.0 | 1050 | $3,500 | $3.33 | 26d | 1 | 1.09mi |
| 17400 Gulf Blvd Redington Shores, FL | 2.0 | 2.0 | 1325 | $4,000 | $3.02 | 26d | 1 | 1.11mi |
| 14950 Gulf Blvd #402 Madeira Beach, FL | 2.0 | 2.0 | 1225 | $5,000 | $4.08 | 26d | 1 | 1.13mi |
| 17408 Gulf Blvd Redington Shores, FL | 2.0 | 2.0 | 1450 | $3,200 | $2.21 | 5d | 2 | 1.15mi |
| 4650 Cove Cir #402 Saint Petersburg, FL | 2.0 | 2.0 | 970 | $3,500 | $3.61 | 26d | 1 | 1.15mi |
| 17408 Gulf Blvd #1003 Redington Shores, FL | 2.0 | 2.0 | 1450 | $3,500 | $2.41 | 26d | 1 | 1.15mi |
| 4650 Cove Cir #611 Saint Petersburg, FL | 2.0 | 2.0 | 970 | $2,500 | $2.58 | 6d | 1 | 1.15mi |
| 401 150th Ave #266 Madeira Beach, FL | 2.0 | 2.0 | 1270 | $3,800 | $2.99 | 6d | 1 | 1.16mi |
| 4525 Cove Cir #608 Saint Petersburg, FL | 2.0 | 2.0 | 1060 | $1,950 | $1.84 | 0d | 1 | 1.17mi |
| 401 150th Ave Madeira Beach, FL | 2.0 | 2.0 | 1280 | $3,350 | $2.62 | 26d | 2 | 1.17mi |
| 1 Boca Ciega Point Blvd #115 Saint Petersburg, FL | 2.0 | 2.0 | 920 | $1,900 | $2.07 | 4d | 1 | 1.18mi |
| 4575 Cove Cir #703 Saint Petersburg, FL | 2.0 | 2.0 | 1040 | $2,200 | $2.12 | 6d | 1 | 1.20mi |
| 11235 Kapok Grand Cir Saint Petersburg, FL | 2.0 | 2.5 | 1524 | $2,900 | $1.90 | 26d | 1 | 1.28mi |
Listing history 3 events
-
2026-04-21status Pending
-
2026-02-25price $425,000
-
2026-01-16$445,000 Active
ⓘ Source: listings_history table (triggers on properties + properties_extension) + one-shot
backfill from property_details.listing_events for pre-trigger history.
Tax reassessment forecast FL · Resets to sale price
- Current annual tax
- $2,782 · $232/mo
- Projected year-2 tax
- $3,528 · $294/mo
- Expected delta
- +$745/yr (+$62/mo · 26.8%)
ⓘ Screening estimate from a state-policy table — verify with the county assessor before closing.
Climate risk First Street
- Flood 10/10 Extreme FEMA zone AE · 99% chance over 30 yrs
- Wildfire 1/10 Low
- Heat 10/10 Extreme 8 d/yr ≥108°F today · 29 d/yr by 30 yrs out
- Wind 10/10 Extreme 99% chance of damaging wind over 30 yrs
- Air quality 3/10 Moderate 2 unhealthy d/yr today · 2 by 30 yrs out
Nearby sold comps map
Loading sold comps map…
Walkable amenities ~0.75 mi
Loading nearby amenities…
Taxation est. · year 1
- Rental income
- $47,375
- − Mortgage interest
- −$23,807
- − Property taxes
- −$2,782
- − Insurance
- −$7,244
- − Repairs & maintenance
- −$3,790
- − Management
- −$3,790
- − Depreciation
- −$12,364
- Taxable loss
- −$6,401
- Est. tax savings @ 24.0%
- +$1,536
- After-tax cash flow
- $2,192/yr
For passive investors: Depreciation is non-cash, so a rental often shows a tax loss while cash-flowing — sheltering income. Rental losses are passive: they offset passive income freely, and up to $25,000/yr can offset ordinary (W-2) income if you actively participate and your MAGI is under $100k (phasing out to $0 by $150k); unused losses carry forward. On sale, claimed depreciation is recaptured at up to 25%, and gains may owe capital-gains tax (a 1031 exchange can defer both). Figures are a year-1 estimate at your 24.0% rate — not tax advice; consult a CPA.
Schools (NCES district)
- District
- Pinellas
- NCES district ID
- 1201560
- Math proficiency
- 51% ▼ -5.00%
- Reading proficiency
- 51% ▼ -3.00%
- Median HH income
- $46,270
- Composite
- 43.27/100
- National rank
- #3046
- State rank
- #31 of 73 in FL
Livability — Redington Beach
- Score
- 67/100
- State rank
- #558
- US rank
- #10672
Category grades
Schools grade is shown separately in the Schools card above.
Census & demographics
- Census place
- Redington Beach, FL
- County
- Pinellas County · 939,478 people
- Metro
- Tampa-St. Petersburg-Clearwater, FL
- Population (ZIP)
- 15,060
- Household income
- $82,500
- Rent vs Own
- Severe rent burden
- 734.0
Population outlook (Pinellas County) Hauer SSP2
- Today (2025)
- 1,027,532 people
- By 2030
- 1,063,586 · +3.5%
- By 2040
- 1,125,020 · +9.5%
- By 2050
- 1,168,637 · +13.7%
- By 2075
- 1,265,188 · +23.1%
- By 2100
- 1,260,357 · +22.7%
Race, ethnicity, and origin ACS 2023
- Neighborhood character
- Predominantly White (87%)
- Race & ethnicity
- White 87% Hispanic / Latino 5% Asian 4% Two or more races 4% Black 1%
- Common ancestry
- Romanian 4% Lithuanian 3% Italian 3%
- Foreign-born
- 10% · Canada, Vietnam, Jamaica
- Languages at home
- 89% English-only · Spanish 3% Vietnamese 2% Russian/Polish/Slavic 2%
Political lean MEDSL · Pinellas
- 2024 margin
- Lean R (+5.2) · D 46.9% · R 52.1%
- 2008→2024 swing
- -13.5pp toward R · 2008: 8.3pp · 2024: -5.2pp
- All cycles
- 2024: R+5.2 2020: D+0.2 2016: R+1.1 2012: D+5.6 2008: D+8.3
Not yet ingested
- Civics
- —
Market trends
- HPI YoY
- ▼ -663.41%
- Current HPI
- 317.0675
- Rent YoY
- ▼ -1.77%
- Metro
- Tampa-St. Petersburg-Clearwater, FL
- State GDP YoY
- ▲ 3.28%
- F500 in state
- 36
Industry mix (Fortune 500 HQ in FL)
| Industry | F500 HQs | Revenue |
|---|---|---|
| Industrial Technology | 2 | $29B |
|
||
| Insurance | 2 | $17B |
|
||
| Retail | 1 | $60B |
|
||
| Technology Distribution | 1 | $58B |
|
||
| Homebuilding | 1 | $35B |
|
||
| Technology Manufacturing | 1 | $35B |
|
||
Price history
-4.5% since first listed3 events — show timeline
- 2026-04-21 Pending — Stellar MLS as Distributed by MLS Grid
- 2026-02-25 Price Changed $425,000 Stellar MLS as Distributed by MLS Grid
- 2026-01-16 Listed $445,000 Stellar MLS as Distributed by MLS Grid
Property tax history
+0.5%/yrLatest (2025): $2,782 · -4.9% YoY. Source: county tax records.
Cash-flow waterfall
monthlySold comps — $/sqft
last 12 mo · ≤1 miLoading sold comps…