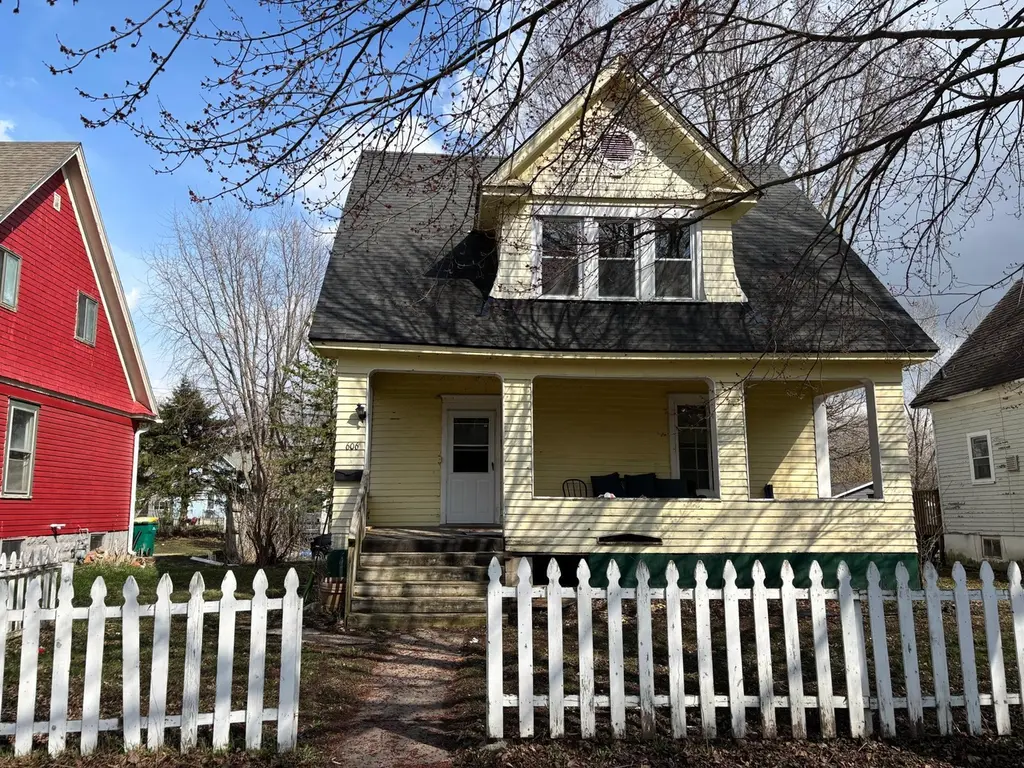
606 Minnesota Ave · Albert Lea, MN
Flood risk 6/10 · Moderate
- FEMA flood zone
- X (unshaded)
- Chance of flooding over 30 yrs
- 0.72%
- Est. flood insurance / yr
- $507 – $1,088
Fire risk 1/10 · Minimal
- Est. fire insurance / yr
- $888 – $1,650
Heat risk 2/10 · Minimal
- Hot days now (above 99°F)
- 7 days/yr
- Hot days in 30 yrs
- 16 days/yr
Wind risk 2/10 · Minimal
- Chance of severe wind over 30 yrs
- —
Air-quality risk 1/10 · Minimal
- Unhealthy air days now
- 0 days/yr
- Unhealthy air days in 30 yrs
- 0 days/yr
Risk factors via First Street. Map © Google.
Why this score? — see what drove the B- grade
The composite is a weighted blend of 9 inputs, each scored 0–100. Each bar is that input's sub-score; the figure is the points it added to the 100-point composite (weight × sub-score).
- Cash flow +28.5/30.0
- DSCR +10.0/10.0
- 1% rule +7.5/10.0
- ARV discount +7.5/15.0
- Livability +3.6/5.0
- Schools +3.0/10.0
- Rent growth +2.5/5.0
- Condition / age +2.5/5.0
- Appreciation +0.0/10.0
$80,000
🖨 Deal sheet 📄 Offer letter ✓ Due diligence
Listing remarks MLS
If you’re looking for a place you can truly make your own, this 3-bedroom, 1-bath home is full of potential. This home offers a great opportunity to build equity with some work. Enjoy the charm of a front porch, a fenced front yard, and a back deck ready to be refreshed. There are hardwood floors, a large dining room and large kitchen as well as a bonus sun room right off the kitchen. Whether you’re an investor or willing to put in some sweat equity, this home is full of potential.
Key facts
- Large dining room
- Front porch
- Large kitchen
Tags
Neighborhood map
What this means for you Summary
Snapshot
- This is a 3-bed/2.0-bath single-family listed at $80k.
Deal economics
- At list price, monthly cash flow is $261 ($3k/yr) — positive.
- The deal already cash-flows at list — no discount required.
- Meets the 1% rule at list price ($999 rent vs $80k).
- Recommended offer: $78k (3.0% below list) — sets the bar for market timing.
- Cap rate 10.2% vs local median 4.0% in Albert Lea — top-decile yield for the area; either an underpriced asset or a hidden risk that comps aren't pricing in. Stress-test before assuming the spread holds.
Location & tenants
- Location reads 72/100 on livability (#274 in MN) — a middle-class / working-renter tenant base. Strengths: cost of living A+, housing A+, health & safety A+; Watch: schools C-, employment D+, amenities F.
- Albert Lea Public School District (town): math 30% / reading 40% proficiency, ranked #258 of 301 in MN (top 86%) — families likely to look elsewhere, expect single-tenant / working-renter base with shorter leases.
- Market conditions: 150 active listings in the ZIP; 3 comparable units currently listed for rent nearby; rentals lingering (median 44d on market — plan ~5-8 weeks vacancy on turnover, expect pricing pressure); 100% of comp listings sitting > 30 days — soft ceiling on asking rent; 16 units permitted in Freeborn County in 2024 (0 in 5+ unit buildings).
- This rent is only 17% of the median local income ($69k/yr) — well below the 30% rent-burden line; pricing power to push rent on renewal without tenant pushback.
Forward outlook
- Local home prices are declining (-3.0%/yr); year-one equity from $553 of loan paydown is wiped out by about $2k of value loss. Plan a longer hold.
- Freeborn County population projected at -11% by 2050 — secular population decline; favor cash flow + early exit over multi-decade hold.
- At projected returns (-3.0% appreciation + 3.0% rent growth), your $22k cash investment doubles in ~9 years — after that, you're playing with house money.
Negotiation context
- It's been on market 51 days — a 3% lower offer ($78k) is reasonable based on typical stale-listing flexibility.
- 9 sale attempts since 23y ago; this cycle's ask has dropped $5k (6%) from the opening price — seller is motivated, your offer sets the floor, not the list.
- Current owner paid $31k; list at $80k implies a 155% gain — meaningful room to come down on a strong offer.
Risks & watch-outs
- Watch-outs: built in 1912 — expect roof / HVAC / electrical / plumbing capex.
- Climate carrying-cost: major flood risk — expect insurance premiums to compound above CPI over the hold.
Questions for the listing agent
- It's been on market 51 days. Have you received any prior offers? Is the seller open to a 3% concession, seller financing, or rate buy-down credit?
- Built in 1912 — when were the roof, HVAC, electrical panel, plumbing, and water heater last replaced?
- Is there a deadline driving the sale (1031 exchange, divorce, estate, relocation)? That informs how much negotiation room exists.
- What's the average days-on-market for RENTAL listings here right now (not sales)? A rising rental-DOM trend means longer vacancies and softer asking-rent achievability than the comps imply.
- What's the recent tenant-quality profile in this submarket — average credit score on applications, eviction rate, late-payment / NSF rate, and stable-employment percentage? A property-management company in the area should have these aggregated.
- How much new for-sale + rental construction is in the pipeline within 1–3 miles? Heavy new supply typically softens prices + rents 12–24 months out; constrained supply supports both.
Investment metrics
- 1% rule
- 1.25% ✓
- Cap rate
- 10.21%
- Cash-on-cash
- 13.99%
- DSCR
- 1.62
- GRM
- 6.7
CMA / ARV
- ARV (median comp)
- $48,762
- List price
- $80,000
- Delta
- 64.06%
- Verdict
- OVERPRICED
- Comps
- 3 within 1.0 mi
Show comp detail 1 sale within ~0.75 mi
| Address | Dist | Beds/Ba | Sqft | Sold | Price | $/sf | Match |
|---|---|---|---|---|---|---|---|
| 608 Saint Peter Ave | 0.36mi | 3/1.0 | 1,085 (-12%) | 22mo | $139,000 | $128 | 41 |
Match score weights: distance 35% · size 25% · config 20% · recency 20%. Top-matched comps best support the ARV.
Projected returns pro-forma
-3.0% appreciation · 3.0% rent growth · sell at horizon
- IRR
- 4.2%
- Equity multiple
- 1.16×
- Total profit
- $3,675
- Equity at exit
- $11,928
- IRR
- 13.7%
- Equity multiple
- 2.10×
- Total profit
- $24,623
- Equity at exit
- $6,917
Cash invested: $22,400 (down + closing). Projections, not guarantees.
Landlord ↔ Tenant lean methodology
- Overall (STATE)
- 46 Balanced
- State Minnesota
- 46 Balanced · D+2
- County
- — inherits STATE
- City
- — inherits STATE
ZIP-level market 56007
- Home prices YoY
- -22.3%
- Active inventory
- 150
- Price-to-rent
- 6.7×
Monthly cashflow live
- Estimated rent
- $999 medium interval (Pro) →
- Mortgage (P&I)
- −$420
- Tax from tax record
- −$75 /mo · $898/yr
- Insurance
- −$33
- HOA
- −$0
- Vacancy / Maint / Mgmt
- −$210
- Net cashflow
- $261
Break-even live
UW: 25.0% down · 7.5% · 30yr · 1.5% tax · 5.0% vac · 8.0% maint · 8.0% mgmt
Financing live
Cash to close
- Down payment
- $20,000
- Closing costs
- $2,400
- Reserves months
- —
- Total cash needed
- —
Loan-product check · same deal, 3 products live
Conventional
25% down · 7.5% · 30yr
- Down + closing
- —
- Monthly P&I
- —
- Monthly cashflow
- —
- DSCR
- —
- Eligible?
- —
Personal DTI + credit; lowest rate.
DSCR
20% down · 8.5% · 30yr
- Down + closing
- —
- Monthly P&I
- —
- Monthly cashflow
- —
- DSCR
- —
- Eligible?
- —
No personal income docs; deal must DSCR.
Hard money
10% down · 12.0% · 12mo
- Down + closing
- —
- Monthly P&I
- —
- Monthly cashflow
- —
- DSCR
- —
- Eligible?
- —
Short-term bridge; refi at stabilization.
Rent comps 3 comps
| Address | Beds | Baths | Sqft | Rent | $/sqft | DOM | Units | Dist |
|---|---|---|---|---|---|---|---|---|
| 139 E William St Albert Lea, MN | 2.0 | 1.0 | 894 | $885 | $0.99 | 44d | 1 | 0.63mi |
| 133 W William St Unit 105 Albert Lea, MN | 2.0 | 1.0 | 775 | $865 | $1.12 | 44d | 1 | 0.73mi |
| 1307 Saint Joseph Ave Albert Lea, MN | 2.0 | 1.0 | 1101 | $1,050 | $0.95 | 44d | 1 | 1.30mi |
Listing history 22 events
-
2026-06-05statusdays on market $80,000 Pending 51 DOM
-
2026-06-03days on market $80,000 Active 50 DOM
-
2026-06-02days on market $80,000 Active 49 DOM
-
2026-06-01days on market $80,000 Active 48 DOM
-
2026-05-31days on market $80,000 Active 47 DOM
-
2026-05-30days on market $80,000 Active 46 DOM
-
2026-05-04price $80,000 498-char remark
Show marketing remark (498 chars)
If you’re looking for a place you can truly make your own, this 3-bedroom, 1-bath home is full of potential. This home offers a great opportunity to build equity with some work. Enjoy the charm of a front porch, a fenced front yard, and a back deck ready to be refreshed. There are hardwood floors, a large dining room and large kitchen as well as a bonus sun room right off the kitchen. Whether you’re an investor or willing to put in some sweat equity, this home is full of potential.
-
2026-04-14$85,000 Active 498-char remark
Show marketing remark (498 chars)
If you’re looking for a place you can truly make your own, this 3-bedroom, 1-bath home is full of potential. This home offers a great opportunity to build equity with some work. Enjoy the charm of a front porch, a fenced front yard, and a back deck ready to be refreshed. There are hardwood floors, a large dining room and large kitchen as well as a bonus sun room right off the kitchen. Whether you’re an investor or willing to put in some sweat equity, this home is full of potential.
-
2018-12-10historical
-
2016-11-28soldstatus $31,350
-
2010-12-28historical
-
2010-06-28$54,900
-
2010-06-15historical
-
2009-12-16$54,900
-
2009-12-16$54,900
-
2009-09-15historical
-
2009-03-03$61,900
-
2008-12-15historical
-
2008-06-17$64,900
-
2008-06-17$61,900
-
2003-01-07$43,000
-
2003-01-07$43,000
ⓘ Source: listings_history table (triggers on properties + properties_extension) + one-shot
backfill from property_details.listing_events for pre-trigger history.
Tax reassessment forecast MN · Partial reset (capped growth)
- Current annual tax
- $898 · $75/mo
- Projected year-2 tax
- $898 · $75/mo
- Expected delta
- $0/yr ($0/mo · 0.0%)
ⓘ Screening estimate from a state-policy table — verify with the county assessor before closing.
Climate risk First Street
- Flood 6/10 Major FEMA zone X (unshaded) · 72% chance over 30 yrs
- Wildfire 1/10 Low
- Heat 2/10 Low 7 d/yr ≥99°F today · 16 d/yr by 30 yrs out
- Wind 2/10 Low
- Air quality 1/10 Low 0 unhealthy d/yr today · 0 by 30 yrs out
Nearby sold comps map
Loading sold comps map…
Walkable amenities ~0.75 mi
Loading nearby amenities…
Taxation est. · year 1
- Rental income
- $11,984
- − Mortgage interest
- −$4,481
- − Property taxes
- −$898
- − Insurance
- −$400
- − Repairs & maintenance
- −$959
- − Management
- −$959
- − Depreciation
- −$2,327
- Taxable income
- $1,960
- Est. tax owed @ 24.0%
- −$470
- After-tax cash flow
- $2,664/yr
For passive investors: Depreciation is non-cash, so a rental often shows a tax loss while cash-flowing — sheltering income. Rental losses are passive: they offset passive income freely, and up to $25,000/yr can offset ordinary (W-2) income if you actively participate and your MAGI is under $100k (phasing out to $0 by $150k); unused losses carry forward. On sale, claimed depreciation is recaptured at up to 25%, and gains may owe capital-gains tax (a 1031 exchange can defer both). Figures are a year-1 estimate at your 24.0% rate — not tax advice; consult a CPA.
Schools (NCES district)
- District
- Albert Lea Public School District
- NCES district ID
- 2702970
- Math proficiency
- 30% ▼ -14.00%
- Reading proficiency
- 40% ▼ -8.00%
- Median HH income
- $42,776
- Composite
- 29.62/100
- National rank
- #6472
- State rank
- #258 of 301 in MN
Livability — Albert Lea
- Score
- 72/100
- State rank
- #274
- US rank
- #5963
Category grades
Schools grade is shown separately in the Schools card above.
Census & demographics
- Census place
- Albert Lea, MN
- County
- Freeborn County · 21,377 people
- City population
- 21,377
- Metro
- Albert Lea, MN
- Population (ZIP)
- 21,377
- Household income
- $68,846
- Rent vs Own
- Severe rent burden
- 483.0
Population outlook (Freeborn County) Hauer SSP2
- Today (2025)
- 29,680 people
- By 2030
- 29,038 · -2.2%
- By 2040
- 27,650 · -6.8%
- By 2050
- 26,387 · -11.1%
- By 2075
- 25,224 · -15.0%
- By 2100
- 23,842 · -19.7%
Race, ethnicity, and origin ACS 2023
- Neighborhood character
- Predominantly White (79%)
- Race & ethnicity
- White 79% Hispanic / Latino 14% Two or more races 8% Asian 4% Black 2%
- Hispanic origin (detail)
- Mexican 11%
- Common ancestry
- Portuguese 23% Iranian 3% Romanian 2%
- Foreign-born
- 4% · Canada, Philippines
- Languages at home
- 90% English-only · Spanish 7% Other Asian/Pacific 3%
Political lean MEDSL · Freeborn
- 2024 margin
- Strong R (+21.3) · D 38.7% · R 60.0% · Other 1.3%
- 2008→2024 swing
- -38.5pp toward R · 2008: 17.1pp · 2024: -21.3pp
- All cycles
- 2024: R+21.3 2020: R+16.0 2016: R+17.4 2012: D+14.2 2008: D+17.1
Not yet ingested
- Civics
- —
Market trends
- HPI YoY
- ▼ -63.40%
- Current HPI
- 220.7963
- Rent YoY
- —
- Metro
- Albert Lea, MN
- State GDP YoY
- ▲ 2.41%
- F500 in state
- 34
Industry mix (Fortune 500 HQ in MN)
| Industry | F500 HQs | Revenue |
|---|---|---|
| Healthcare | 2 | $407B |
|
||
| Retail | 2 | $150B |
|
||
| Consumer Goods | 2 | $32B |
|
||
| Industrial Machinery | 2 | $6B |
|
||
| Agriculture | 1 | $40B |
|
||
| Healthcare / Medical Devices | 1 | $32B |
|
||
Price history
+86.0% since first listed16 events — show timeline
- 2026-05-04 Price Changed $80,000 NORTHSTARMLS as Distributed by MLS Grid
- 2026-04-14 Listed $85,000 NORTHSTARMLS as Distributed by MLS Grid
- 2018-12-10 Listing Removed — NORTHSTARMLS as Distributed by MLS Grid
- 2016-11-28 Sold (Public Records) $31,350 Public Records
- 2010-12-28 Listing Removed — NORTHSTARMLS as Distributed by MLS Grid
- 2010-06-28 Listed $54,900 NORTHSTARMLS as Distributed by MLS Grid
- 2010-06-15 Listing Removed — NORTHSTARMLS as Distributed by MLS Grid
- 2009-12-16 Listed $54,900 NORTHSTARMLS as Distributed by MLS Grid
- 2009-12-16 Listed $54,900 NORTHSTARMLS as Distributed by MLS Grid
- 2009-09-15 Listing Removed — NORTHSTARMLS as Distributed by MLS Grid
- 2009-03-03 Listed $61,900 NORTHSTARMLS as Distributed by MLS Grid
- 2008-12-15 Listing Removed — NORTHSTARMLS as Distributed by MLS Grid
- 2008-06-17 Listed $61,900 NORTHSTARMLS as Distributed by MLS Grid
- 2008-06-17 Listed $64,900 NORTHSTARMLS as Distributed by MLS Grid
- 2003-01-07 Listed $43,000 NORTHSTARMLS as Distributed by MLS Grid
- 2003-01-07 Listed $43,000 NORTHSTARMLS as Distributed by MLS Grid
Property tax history
+2.3%/yrLatest (2025): $898 · -2.8% YoY. Source: county tax records.
Cash-flow waterfall
monthlySold comps — $/sqft
last 12 mo · ≤1 miLoading sold comps…