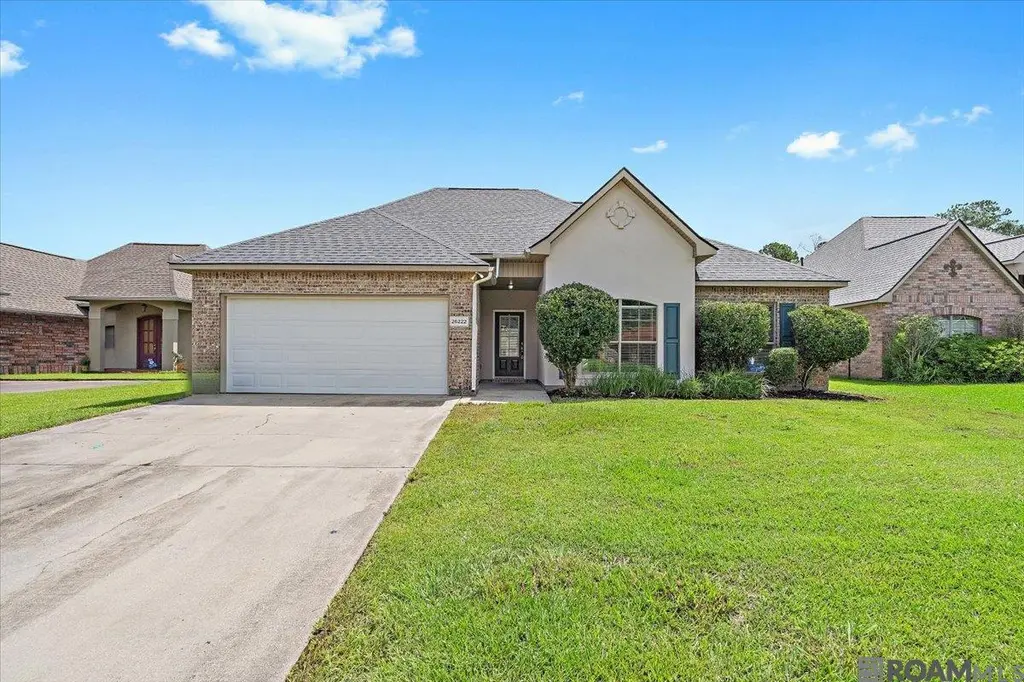
26222 Avoyelles Ave · Denham Springs, LA
Flood risk 1/10 · Minimal
- FEMA flood zone
- X (unshaded)
- Chance of flooding over 30 yrs
- 0.0%
- Est. flood insurance / yr
- $507 – $1,088
Fire risk 3/10 · Minor
- Est. fire insurance / yr
- $1,269 – $2,357
Heat risk 8/10 · Major
- Hot days now (above 108°F)
- 7 days/yr
- Hot days in 30 yrs
- 22 days/yr
Wind risk 9/10 · Severe
- Chance of severe wind over 30 yrs
- 99.0%
Air-quality risk 3/10 · Minor
- Unhealthy air days now
- 2 days/yr
- Unhealthy air days in 30 yrs
- 3 days/yr
Risk factors via First Street. Map © Google.
Why this score? — see what drove the D- grade
The composite is a weighted blend of 9 inputs, each scored 0–100. Each bar is that input's sub-score; the figure is the points it added to the 100-point composite (weight × sub-score).
- Cash flow +12.1/30.0
- ARV discount +7.0/15.0
- Schools +4.0/10.0
- Livability +3.7/5.0
- DSCR +3.6/10.0
- Rent growth +3.5/5.0
- 1% rule +2.9/10.0
- Condition / age +2.5/5.0
- Appreciation +0.0/10.0
$259,900
🖨 Deal sheet 📄 Offer letter ✓ Due diligence
Listing remarks MLS
NO FLOOD INSURANCE REQUIRED on this beautiful home located on serine LAKE LOT. Open split plan features den with fireplace & cathedral ceiling adjacent to updated gourmet kitchen with new granite countertops, new stove and dishwasher & updated lighting and hardware. The den/kitchen area overlooks the spacious backyard on the lake perfect for outdoor living and entertainment. All bedrooms have spacious walk-in closets and the primary has an ensuite bath with double vanities, soaker tub and separate shower. This home is move in ready with new interior paint, and freshly painted exterior trim: the roof and AC were replaced 4 years ago. The property's condition, along with it's location, convenient to Juban Crossing, just off I-12, combine to make this jewel a rare find and one that's sure to sell fast, so don't miss this remarkable opportunity.
Key facts
- 9,147 sq ft lot
- Garage
- Built 2008
Neighborhood map
What this means for you Summary
Snapshot
- This is a 4-bed/2.0-bath single-family listed at $260k.
Deal economics
- At list price, monthly cash flow is $-55 ($-664/yr) — negative.
- To cash-flow at today's rent, offer at most $250k (3.8% below list).
- To meet the 1% rule (rent ≥ 1% of price), the offer needs to be $206k (20.8% below list).
- Recommended offer: $206k (20.8% below list) — sets the bar for 1% rule.
- Cap rate 6.0% vs local median 3.9% in Denham Springs — top-decile yield for the area; either an underpriced asset or a hidden risk that comps aren't pricing in. Stress-test before assuming the spread holds.
Location & tenants
- Location reads 74/100 on livability (#29 in LA, #4,939 nationally) — a middle-class / working-renter tenant base. Strengths: cost of living A+, housing A+, health & safety A+; Watch: crime C-, amenities F, commute F.
- Livingston Parish (suburban): math 40% / reading 52% proficiency, ranked #13 of 98 in LA (top 13%) — families likely to look elsewhere, expect single-tenant / working-renter base with shorter leases.
- Market conditions: Rents rising (+3.8%/yr); 976 active listings in the ZIP; 11 comparable units currently listed for rent nearby; rentals at typical pace (median 24d on market — plan ~3-4 weeks tenant-placement turnaround); solid renter incomes; 794 units permitted in Livingston Parish in 2024 (99 in 5+ unit buildings).
- This rent runs 31% of the median local income ($79k/yr) — at the standard rent-burdened threshold; future hikes will face affordability resistance.
Forward outlook
- Local home prices are declining (-3.0%/yr); year-one equity from $2k of loan paydown is wiped out by about $8k of value loss. Plan a longer hold.
- Livingston County population projected at +27% by 2050 — long-run rental-demand tailwind backs the buy-and-hold thesis.
Negotiation context
- It's been on market 59 days — a 3% lower offer ($252k) is reasonable based on typical stale-listing flexibility.
- 11 sale attempts since 10y ago with the ask held roughly flat each time — persistent listings suggest the price (not the market) is what's stuck; bring a comps-based counter.
Risks & watch-outs
- Climate carrying-cost: severe wind risk, 99% chance of damaging wind over 30y; extreme-heat days projected 7→22/yr by 2055 (HVAC capex compounding) — expect insurance premiums to compound above CPI over the hold.
Questions for the listing agent
- What do current leases actually rent for vs. the listed asking? Can we see a recent rent roll and the last 12 months of T-12 income?
- It's been on market 59 days. Have you received any prior offers? Is the seller open to a 21% concession, seller financing, or rate buy-down credit?
- What does the HOA fee cover, when was the last increase, and are there any pending special assessments or reserve-fund shortfalls?
- Is there a deadline driving the sale (1031 exchange, divorce, estate, relocation)? That informs how much negotiation room exists.
- Schools are B-rated — typically a magnet for longer-tenancy family renters. What's the average tenant stay here, and is there a school-zone premium baked into asking?
- The area grade is low — what's the realistic commute time and amenity access for the typical tenant pool here? Any planned neighborhood developments (good or bad) we should know about?
- What's the average days-on-market for RENTAL listings here right now (not sales)? A rising rental-DOM trend means longer vacancies and softer asking-rent achievability than the comps imply.
- What's the recent tenant-quality profile in this submarket — average credit score on applications, eviction rate, late-payment / NSF rate, and stable-employment percentage? A property-management company in the area should have these aggregated.
- How much new for-sale + rental construction is in the pipeline within 1–3 miles? Heavy new supply typically softens prices + rents 12–24 months out; constrained supply supports both.
Investment metrics
- 1% rule
- 0.79% ✗
- Cap rate
- 6.04%
- Cash-on-cash
- -0.91%
- DSCR
- 0.96
- GRM
- 10.5
CMA / ARV
- ARV (median comp)
- $256,800
- List price
- $259,900
- Delta
- 1.21%
- Verdict
- FAIR
- Comps
- 20 within 1.0 mi
Show comp detail 12 sales within ~0.75 mi
| Address | Dist | Beds/Ba | Sqft | Sold | Price | $/sf | Match |
|---|---|---|---|---|---|---|---|
| 26426 Avoyelles Ave | 0.35mi | 4/2.0 | 1,998 (0%) | 2mo | $245,000 | $123 | 82 |
| 26526 Acadia Ct | 0.54mi | 4/2.0 | 1,998 (0%) | 1mo | $260,000 | $130 | 74 |
| 26270 Avoyelles Ave | 0.09mi | 3/2.0 (-1) | 1,829 (-8%) | 5mo | $259,000 | $142 | 72 |
| 26288 Avoyelles Ave | 0.12mi | 3/2.0 (-1) | 1,829 (-8%) | 6mo | $259,999 | $142 | 70 |
| 11078 Iberia Dr | 0.25mi | 3/2.0 (-1) | 1,829 (-8%) | 1mo | $255,000 | $139 | 69 |
| 11066 Iberia Dr | 0.25mi | 3/2.0 (-1) | 1,863 (-7%) | 12mo | $200,000 | $107 | 62 |
| 26017 Big Ben Dr | 0.68mi | 4/2.0 | 2,014 (+1%) | 10mo | $244,000 | $121 | 59 |
| 26028 Wimbledon Ave | 0.64mi | 4/2.0 | 1,940 (-3%) | 11mo | $239,000 | $123 | 56 |
| 11190 Caddo Dr | 0.57mi | 3/2.0 (-1) | 1,863 (-7%) | 6mo | $270,000 | $145 | 52 |
| 11388 Meadow View Dr | 0.72mi | 3/2.0 (-1) | 2,122 (+6%) | 4mo | $265,000 | $125 | 48 |
| 26030 Big Ben Dr | 0.71mi | 3/2.0 (-1) | 1,908 (-4%) | 10mo | $250,000 | $131 | 46 |
| 11406 Meadow View Dr | 0.74mi | 4/2.0 | 2,266 (+13%) | 12mo | $285,000 | $126 | 33 |
Match score weights: distance 35% · size 25% · config 20% · recency 20%. Top-matched comps best support the ARV.
Projected returns pro-forma
-3.0% appreciation · 3.83% rent growth · sell at horizon
- IRR
- -17.0%
- Equity multiple
- 0.40×
- Total profit
- $-43,945
- Equity at exit
- $38,752
- IRR
- -7.5%
- Equity multiple
- 0.51×
- Total profit
- $-35,729
- Equity at exit
- $22,471
Cash invested: $72,772 (down + closing). Projections, not guarantees.
Landlord ↔ Tenant lean methodology
- Overall (STATE)
- 90 Strongly Landlord-Friendly
- State Louisiana
- 90 Strongly Landlord-Friendly · R+12
- County
- — inherits STATE
- City
- — inherits STATE
ZIP-level market 70726
- Rents YoY
- 3.8%
- Active inventory
- 976
- Price-to-rent
- 10.5×
Monthly cashflow live
- Estimated rent
- $2,059 high interval (Pro) →
- Mortgage (P&I)
- −$1,363
- Tax from tax record
- −$177 /mo · $2,122/yr
- Insurance
- −$108
- HOA
- −$34
- Vacancy / Maint / Mgmt
- −$432
- Net cashflow
- $-55
Break-even live
UW: 25.0% down · 7.5% · 30yr · 1.5% tax · 5.0% vac · 8.0% maint · 8.0% mgmt
Financing live
Cash to close
- Down payment
- $64,975
- Closing costs
- $7,797
- Reserves months
- —
- Total cash needed
- —
Loan-product check · same deal, 3 products live
Conventional
25% down · 7.5% · 30yr
- Down + closing
- —
- Monthly P&I
- —
- Monthly cashflow
- —
- DSCR
- —
- Eligible?
- —
Personal DTI + credit; lowest rate.
DSCR
20% down · 8.5% · 30yr
- Down + closing
- —
- Monthly P&I
- —
- Monthly cashflow
- —
- DSCR
- —
- Eligible?
- —
No personal income docs; deal must DSCR.
Hard money
10% down · 12.0% · 12mo
- Down + closing
- —
- Monthly P&I
- —
- Monthly cashflow
- —
- DSCR
- —
- Eligible?
- —
Short-term bridge; refi at stabilization.
Rent comps 11 comps
| Address | Beds | Baths | Sqft | Rent | $/sqft | DOM | Units | Dist |
|---|---|---|---|---|---|---|---|---|
| 25699 Raines Ave Dennis Mills, LA | 3.0 | 2.0 | 1463 | $1,850 | $1.26 | 14d | 1 | 1.11mi |
| 25717 Raines Ave Dennis Mills, LA | 4.0 | 2.0 | 1568 | $2,200 | $1.40 | 19d | 1 | 1.11mi |
| 25699 Raines Ave Dennis Mills, LA | 3.0 | 2.0 | 1463 | $1,850 | $1.26 | 43d | 1 | 1.11mi |
| 25729 Raines Ave Dennis Mills, LA | 4.0 | 2.0 | 1568 | $2,200 | $1.40 | 14d | 1 | 1.11mi |
| 25729 Raines Ave Dennis Mills, LA | 4.0 | 2.0 | 1568 | $2,200 | $1.40 | 23d | 1 | 1.11mi |
| 11385 Ashwood Ct Denham Springs, LA | 3.0 | 2.0 | 1556 | $1,900 | $1.22 | 43d | 1 | 1.16mi |
| 11402 Ashwood Ct Denham Springs, LA | 3.0 | 2.0 | 1331 | $1,750 | $1.31 | 21d | 1 | 1.19mi |
| 25662 Tarver St , LA | 4.0 | 2.0 | 1570 | $2,000 | $1.27 | 43d | 1 | 1.19mi |
| 12850 Silverbell Ave Denham Springs, LA | 3.0 | 2.0 | 1606 | $2,200 | $1.37 | 23d | 1 | 1.26mi |
| 12856 Silverbell Ave Denham Springs, LA | 4.0 | 2.0 | 1829 | $2,400 | $1.31 | 43d | 1 | 1.27mi |
| 10922 S Lakeside Dr Denham Springs, LA | 3.0 | 2.0 | 1369 | $1,750 | $1.28 | 23d | 1 | 1.29mi |
HOA detail
- Monthly dues
- $34 · $408/yr
Listing history 41 events
-
2026-06-18days on market $259,900 Active 59 DOM
-
2026-06-17days on market $259,900 Active 58 DOM
-
2026-06-16days on market $259,900 Active 57 DOM
-
2026-06-15days on market $259,900 Active 56 DOM
-
2026-06-14days on market $259,900 Active 54 DOM
-
2026-06-13days on market $259,900 Active 53 DOM
-
2026-06-10days on market $259,900 Active 51 DOM
-
2026-06-09days on market $259,900 Active 50 DOM
-
2026-06-08days on market $259,900 Active 49 DOM
-
2026-06-07days on market $259,900 Active 48 DOM
-
2026-06-03days on market $259,900 Active 44 DOM
-
2026-06-02days on market $259,900 Active 43 DOM
-
2026-06-01days on market $259,900 Active 42 DOM
-
2026-05-31days on market $259,900 Active 41 DOM
-
2026-05-31days on market $259,900 Active 40 DOM
-
2026-04-20$259,900 Active 866-char remark
Show marketing remark (861 chars)
NO FLOOD INSURANCE REQUIRED on this beautiful home located on serine LAKE LOT. Open split plan features den with fireplace & cathedral ceiling adjacent to updated gourmet kitchen with new granite countertops, new stove and dishwasher & updated lighting and hardware. The den/kitchen area overlooks the spacious backyard on the lake perfect for outdoor living and entertainment. All bedrooms have spacious walk-in closets and the primary has an ensuite bath with double vanities, soaker tub and separate shower. This home is move in ready with new interior paint, and freshly painted exterior trim: the roof and AC were replaced 4 years ago. The property's condition, along with it's location, convenient to Juban Crossing, just off I-12, combine to make this jewel a rare find and one that's sure to sell fast, so don't miss this remarkable opportunity.
-
2026-04-20$259,900 Active 861-char remark
Show marketing remark (861 chars)
NO FLOOD INSURANCE REQUIRED on this beautiful home located on serine LAKE LOT. Open split plan features den with fireplace & cathedral ceiling adjacent to updated gourmet kitchen with new granite countertops, new stove and dishwasher & updated lighting and hardware. The den/kitchen area overlooks the spacious backyard on the lake perfect for outdoor living and entertainment. All bedrooms have spacious walk-in closets and the primary has an ensuite bath with double vanities, soaker tub and separate shower. This home is move in ready with new interior paint, and freshly painted exterior trim: the roof and AC were replaced 4 years ago. The property's condition, along with it's location, convenient to Juban Crossing, just off I-12, combine to make this jewel a rare find and one that's sure to sell fast, so don't miss this remarkable opportunity.
-
2026-01-23price $265,000
-
2026-01-23price $265,000
-
2025-12-16status Active
-
2025-10-06price $270,000
-
2025-10-06price $270,000
-
2025-07-15price $274,995
-
2025-07-15price $274,995
-
2025-07-15price $274,000
-
2025-07-15price $274,000
-
2025-07-14$265,000 Active
-
2025-07-14$265,000 Active
-
2025-06-14$2,100
-
2025-06-13historical $2,020
-
2025-06-12$2,020
-
2025-06-11historical $2,020
-
2025-05-31price $2,020
-
2025-03-27$2,100
-
2021-11-26soldstatus
-
2021-11-17$1,650
-
2016-12-27soldstatus
-
2016-11-30$1,575
-
2016-05-16soldstatus
-
2016-05-16$1,550
-
2007-10-11soldstatus
ⓘ Source: listings_history table (triggers on properties + properties_extension) + one-shot
backfill from property_details.listing_events for pre-trigger history.
Tax reassessment forecast LA · Resets to sale price
- Current annual tax
- $2,122 · $177/mo
- Projected year-2 tax
- $2,122 · $177/mo
- Expected delta
- $0/yr ($0/mo · 0.0%)
ⓘ Screening estimate from a state-policy table — verify with the county assessor before closing.
Climate risk First Street
- Flood 1/10 Low FEMA zone X (unshaded) · 0% chance over 30 yrs
- Wildfire 3/10 Moderate
- Heat 8/10 Severe 7 d/yr ≥108°F today · 22 d/yr by 30 yrs out
- Wind 9/10 Extreme 99% chance of damaging wind over 30 yrs
- Air quality 3/10 Moderate 2 unhealthy d/yr today · 3 by 30 yrs out
Nearby sold comps map
Loading sold comps map…
Walkable amenities ~0.75 mi
Loading nearby amenities…
Taxation est. · year 1
- Rental income
- $24,709
- − Mortgage interest
- −$14,558
- − Property taxes
- −$2,122
- − Insurance
- −$1,300
- − Repairs & maintenance
- −$1,977
- − Management
- −$1,977
- − HOA
- −$408
- − Depreciation
- −$7,561
- Taxable loss
- −$5,193
- Est. tax savings @ 24.0%
- +$1,246
- After-tax cash flow
- $582/yr
For passive investors: Depreciation is non-cash, so a rental often shows a tax loss while cash-flowing — sheltering income. Rental losses are passive: they offset passive income freely, and up to $25,000/yr can offset ordinary (W-2) income if you actively participate and your MAGI is under $100k (phasing out to $0 by $150k); unused losses carry forward. On sale, claimed depreciation is recaptured at up to 25%, and gains may owe capital-gains tax (a 1031 exchange can defer both). Figures are a year-1 estimate at your 24.0% rate — not tax advice; consult a CPA.
Schools (NCES district)
- District
- Livingston Parish
- NCES district ID
- 2201020
- Math proficiency
- 40% ▼ -38.00%
- Reading proficiency
- 52% ▼ -32.00%
- Median HH income
- $56,755
- Composite
- 40.07/100
- National rank
- #3811
- State rank
- #13 of 98 in LA
Livability — Denham Springs
- Score
- 74/100
- State rank
- #29
- US rank
- #4939
Category grades
Schools grade is shown separately in the Schools card above.
Census & demographics
- County
- Livingston Parish · 87,496 people
- City population
- 63,575
- Metro
- Baton Rouge, LA
- Population (ZIP)
- 63,575
- Household income
- $78,621
- Rent vs Own
- Severe rent burden
- 1211.0
Population outlook (Livingston County) Hauer SSP2
- Today (2025)
- 158,511 people
- By 2030
- 168,241 · +6.1%
- By 2040
- 186,252 · +17.5%
- By 2050
- 201,516 · +27.1%
- By 2075
- 231,217 · +45.9%
- By 2100
- 241,697 · +52.5%
Race, ethnicity, and origin ACS 2023
- Neighborhood character
- Predominantly White (74%)
- Race & ethnicity
- White 74% Black 13% Hispanic / Latino 9% Two or more races 6%
- Hispanic origin (detail)
- Mexican 3%
- Common ancestry
- Lithuanian 9% Serbian 1% Italian 1%
- Foreign-born
- 6% · Canada
- Languages at home
- 91% English-only · Spanish 6% Other Indo-European 1%
Political lean MEDSL · Livingston
- 2024 margin
- Solid R (+68.5) · D 15.1% · R 83.6% · Other 1.3%
- 2008→2024 swing
- +3.4pp toward D · 2008: -71.9pp · 2024: -68.5pp
- All cycles
- 2024: R+68.5 2020: R+70.0 2016: R+72.5 2012: R+70.4 2008: R+71.9
Not yet ingested
- Civics
- —
Market trends
- HPI YoY
- ▼ -104.37%
- Current HPI
- 170.2207
- Rent YoY
- ▲ 3.83%
- Metro
- Baton Rouge, LA
- State GDP YoY
- ▲ 3.29%
- F500 in state
- 10
Industry mix (Fortune 500 HQ in LA)
| Industry | F500 HQs | Revenue |
|---|---|---|
| Telecommunications | 2 | $23B |
|
||
| Utilities | 1 | $12B |
|
||
| Wholesale / Distribution | 1 | $5B |
|
||
| Advertising | 1 | $2B |
|
||
Price history
+16667.7% since first listed26 events — show timeline
- 2026-04-20 Listed $259,900 GBRMLS
- 2026-04-20 Listed $259,900 AcadianaMLS
- 2026-01-23 Price Changed $265,000 GBRMLS
- 2026-01-23 Price Changed $265,000 AcadianaMLS
- 2025-12-16 Relisted — GBRMLS
- 2025-10-06 Price Changed $270,000 AcadianaMLS
- 2025-10-06 Price Changed $270,000 GBRMLS
- 2025-07-15 Price Changed $274,995 AcadianaMLS
- 2025-07-15 Price Changed $274,995 GBRMLS
- 2025-07-15 Price Changed $274,000 AcadianaMLS
- 2025-07-15 Price Changed $274,000 GBRMLS
- 2025-07-14 Listed $265,000 GBRMLS
- 2025-07-14 Listed $265,000 AcadianaMLS
- 2025-06-14 Listed for Rent $2,100 BUILDIUM
- 2025-06-13 Rental Removed $2,020 APPFOLIO
- 2025-06-12 Listed for Rent $2,020 APPFOLIO
- 2025-06-11 Rental Removed $2,020 GBRMLS
- 2025-05-31 Price Changed $2,020 GBRMLS
- 2025-03-27 Listed for Rent $2,100 GBRMLS
- 2021-11-26 Sold (MLS) — GBRMLS
- 2021-11-17 Listed $1,650 GBRMLS
- 2016-12-27 Sold (MLS) — GBRMLS
- 2016-11-30 Listed $1,575 GBRMLS
- 2016-05-16 Listed $1,550 GBRMLS
- 2016-05-16 Sold (MLS) — GBRMLS
- 2007-10-11 Sold (Public Records) — Public Records
Property tax history
+0.2%/yrLatest (2024): $2,122 · +4.2% YoY. Source: county tax records.
Cash-flow waterfall
monthlySold comps — $/sqft
last 12 mo · ≤1 miLoading sold comps…