2954 Lenox Ave · Jacksonville, FL
Flood risk 1/10 · Minimal
- FEMA flood zone
- X (unshaded)
- Chance of flooding over 30 yrs
- 0.0%
- Est. flood insurance / yr
- $507 – $1,088
Fire risk 1/10 · Minimal
- Est. fire insurance / yr
- $947 – $1,759
Heat risk 9/10 · Severe
- Hot days now (above 107°F)
- 7 days/yr
- Hot days in 30 yrs
- 21 days/yr
Wind risk 9/10 · Severe
- Chance of severe wind over 30 yrs
- 99.0%
Air-quality risk 5/10 · Moderate
- Unhealthy air days now
- 7 days/yr
- Unhealthy air days in 30 yrs
- 7 days/yr
Risk factors via First Street. Map © Google.
Why this score? — see what drove the B+ grade
The composite is a weighted blend of 9 inputs, each scored 0–100. Each bar is that input's sub-score; the figure is the points it added to the 100-point composite (weight × sub-score).
- Cash flow +30.0/30.0
- 1% rule +10.0/10.0
- DSCR +10.0/10.0
- ARV discount +7.5/15.0
- Appreciation +6.7/10.0
- Livability +4.2/5.0
- Schools +3.9/10.0
- Rent growth +2.9/5.0
- Condition / age +2.5/5.0
$50,000
🖨 Deal sheet (PDF) 📄 Offer letter ✓ Due diligence
Listing remarks
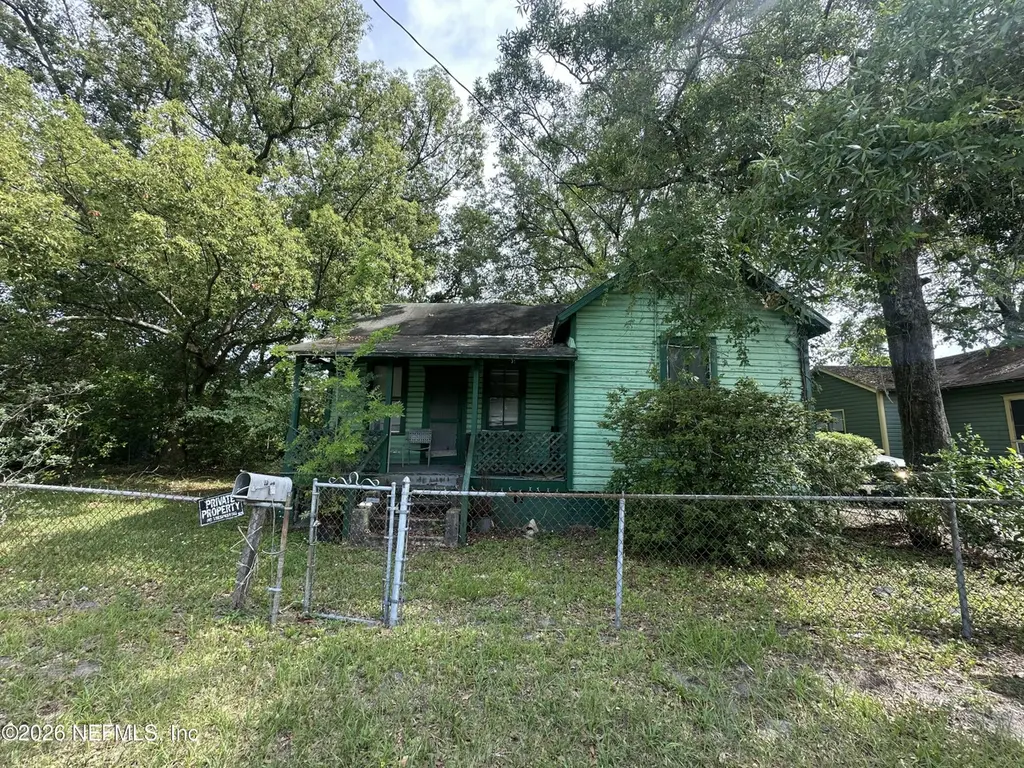
Attention flippers, investors, and bargain hunters--this is the opportunity you've been waiting for! Situated in the Gillen neighborhood, this 3-bedroom, 1-bath home offers 1,161 square feet of living space on a 0.23-acre double lot measuring approximately 100 x 102 feet. Opportunities like this are getting harder to find, especially at this price point! Built in 1916, this property is ready for a complete transformation. Whether you're looking for your next fix-and-flip project, a profitable resale opportunity, or a full-scale renovation, this property provides the perfect blank canvas to bring your vision to life. With city water and sewer already in place, you'll save valuable time an
Key facts
- City water and sewer
- Double lot
- Gillen neighborhood
Tags
Property features AI
Finance
- Other: Lot size approximately 0.23 acres
- HOA & community: Not a senior community
Exterior
- Parking: Off-street and on-street parking
- Utilities: Electricity connected; Water connected; Sewer connected; Public sewer
- Home design: Single family residence; One level, entry on level 1
- Construction: Wood siding construction; Shingle roof
- Exterior features: Chain link and other fencing; City street frontage with asphalt road
Interior
- Bedrooms: 3 bedrooms
- Bathrooms: 1 full bathroom
- Heating & cooling: No heating; No cooling
- Interior features: No built-in appliances listed
Neighborhood map
What this means for you Summary
Snapshot
- This is a 3-bed/1.0-bath single-family listed at $50k.
Deal economics
- At list price, monthly cash flow is $774 ($9k/yr) — positive.
- The deal already cash-flows at list — no discount required.
- Meets the 1% rule at list price ($1k rent vs $50k).
- Cap rate 24.9% vs local median 3.9% in Jacksonville — top-decile yield for the area; either an underpriced asset or a hidden risk that comps aren't pricing in. Stress-test before assuming the spread holds.
Location & tenants
- Location reads 83/100 on livability (#50 in FL, #911 nationally) — a professional / high-income tenant draw. Strengths: amenities A+, commute A+, housing A+.
- Duval (urban): math 46% / reading 45% proficiency, ranked #48 of 73 in FL (top 66%) — families likely to look elsewhere, expect single-tenant / working-renter base with shorter leases.
- Market conditions: Rents rising (+1.7%/yr); 173 active listings in the ZIP; 40 comparable units currently listed for rent nearby; rentals at typical pace (median 22d on market — plan ~3-4 weeks tenant-placement turnaround); lower-income renter base — watch delinquency; 6,503 units permitted in Duval County in 2024 (1,131 in 5+ unit buildings).
- At $1,477/mo this rent would consume 51% of the median local household income ($35k/yr) (locally 882% of renters already pay >50% of income on rent) — very limited rent-growth headroom before tenants either downsize or default.
Forward outlook
- In year one you build about $2k of equity ($346 loan paydown + $2k appreciation (3.4% local appreciation)).
- Duval County population projected at +19% by 2050 — long-run rental-demand tailwind backs the buy-and-hold thesis.
- At projected returns (3.4% appreciation + 1.7% rent growth), your $14k cash investment doubles in ~2 years — after that, you're playing with house money.
Negotiation context
- Only 1 days on market — expect competitive offers; lowballing is unlikely to land.
Risks & watch-outs
- Watch-outs: property tax is 2.6% of price; built in 1916 — expect roof / HVAC / electrical / plumbing capex.
- Climate carrying-cost: severe wind risk, 99% chance of damaging wind over 30y; extreme-heat days projected 7→21/yr by 2055 (HVAC capex compounding) — expect insurance premiums to compound above CPI over the hold.
Questions for the listing agent
- Built in 1916 — when were the roof, HVAC, electrical panel, plumbing, and water heater last replaced?
- Property tax is high relative to price — has the assessment been appealed recently, and will the sale trigger a re-assessment?
- Is there a deadline driving the sale (1031 exchange, divorce, estate, relocation)? That informs how much negotiation room exists.
- Schools are B-rated — typically a magnet for longer-tenancy family renters. What's the average tenant stay here, and is there a school-zone premium baked into asking?
- What's the average days-on-market for RENTAL listings here right now (not sales)? A rising rental-DOM trend means longer vacancies and softer asking-rent achievability than the comps imply.
- What's the recent tenant-quality profile in this submarket — average credit score on applications, eviction rate, late-payment / NSF rate, and stable-employment percentage? A property-management company in the area should have these aggregated.
- How much new for-sale + rental construction is in the pipeline within 1–3 miles? Heavy new supply typically softens prices + rents 12–24 months out; constrained supply supports both.
Investment metrics
- 1% rule
- 2.95% ✓
- Cap rate
- 24.86%
- Cash-on-cash
- 66.31%
- DSCR
- 3.95
- GRM
- 2.8
CMA / ARV
- ARV (on-the-fly)
- $202,014
- Comps found
- 12
Show comp detail 12 sales within ~0.75 mi
| Address | Dist | Beds/Ba | Sqft | Sold | Price | $/sf | Match |
|---|---|---|---|---|---|---|---|
| 2881 Lenox Ave | 0.13mi | 3/1.0 | 1,068 (-8%) | 2mo | $90,000 | $84 | 79 |
| 2908 Spencer St | 0.19mi | 3/2.0 | 1,100 (-5%) | 0mo | $158,000 | $144 | 78 |
| 3127 Dignan St | 0.37mi | 3/2.0 | 1,197 (+3%) | 2mo | $210,000 | $175 | 72 |
| 724 James St | 0.36mi | 3/2.0 | 1,207 (+4%) | 2mo | $265,000 | $220 | 71 |
| 3502 Dellwood Ave | 0.69mi | 3/1.0 | 1,131 (-3%) | 2mo | $155,000 | $137 | 61 |
| 3053 Gilmore St | 0.30mi | 2/1.0 (-1) | 1,008 (-13%) | 0mo | $130,000 | $129 | 59 |
| 156 Willow Branch Ave | 0.42mi | 4/2.0 (+1) | 1,268 (+9%) | 0mo | $105,000 | $83 | 56 |
| 768 James St | 0.41mi | 3/2.0 | 1,312 (+13%) | 2mo | $253,000 | $193 | 54 |
| 2790 Forbes St | 0.75mi | 2/1.0 (-1) | 1,110 (-4%) | 0mo | $259,000 | $233 | 52 |
| 3332 Dellwood Ave | 0.64mi | 2/1.0 (-1) | 1,023 (-12%) | 0mo | $184,000 | $180 | 45 |
| 2550 Summit St | 0.74mi | 2/2.0 (-1) | 1,083 (-7%) | 0mo | $130,000 | $120 | 45 |
| 3557 Dillon St | 0.73mi | 3/1.5 | 1,035 (-11%) | 1mo | $180,000 | $174 | 45 |
Match score weights: distance 35% · size 25% · config 20% · recency 20%. Top-matched comps best support the ARV.
Projected returns pro-forma
3.41% appreciation · 1.7% rent growth · sell at horizon
- IRR
- 70.1%
- Equity multiple
- 4.90×
- Total profit
- $54,541
- Equity at exit
- $23,653
- IRR
- 68.8%
- Equity multiple
- 9.67×
- Total profit
- $121,350
- Equity at exit
- $37,391
Cash invested: $14,000 (down + closing). Projections, not guarantees.
Landlord ↔ Tenant lean methodology
- Overall (STATE)
- 87 Strongly Landlord-Friendly
- State Florida
- 87 Strongly Landlord-Friendly · R+3
- County
- — inherits STATE
- City
- — inherits STATE
ZIP-level market 32254
- Home prices YoY
- 1.2%
- Rents YoY
- 1.7%
- Active inventory
- 173
- Price-to-rent
- 2.8×
Monthly cashflow live
- Estimated rent
- $1,477 high interval (Pro) →
- Mortgage (P&I)
- −$262
- Tax from tax record
- −$110 /mo · $1,318/yr
- Insurance
- −$21
- HOA
- −$0
- Vacancy / Maint / Mgmt
- −$310
- Net cashflow
- $774
Break-even live
Sensitivity live
| Price | -10% $802 | -5% $788 | +0% $774 | +5% $759 | +10% $745 |
|---|---|---|---|---|---|
| Rent | -10% $657 | -5% $715 | +0% $774 | +5% $832 | +10% $890 |
| Rate | -1.0pp $799 | -0.5pp $786 | base $774 | +0.5pp $761 | +1.0pp $747 |
UW: 25.0% down · 7.5% · 30yr · 1.5% tax · 5.0% vac · 8.0% maint · 8.0% mgmt
Financing live
Cash to close
- Down payment
- $12,500
- Closing costs
- $1,500
- Reserves months
- —
- Total cash needed
- —
Loan-product check · same deal, 3 products live
Conventional
25% down · 7.5% · 30yr
- Down + closing
- —
- Monthly P&I
- —
- Monthly cashflow
- —
- DSCR
- —
- Eligible?
- —
Personal DTI + credit; lowest rate.
DSCR
20% down · 8.5% · 30yr
- Down + closing
- —
- Monthly P&I
- —
- Monthly cashflow
- —
- DSCR
- —
- Eligible?
- —
No personal income docs; deal must DSCR.
Hard money
10% down · 12.0% · 12mo
- Down + closing
- —
- Monthly P&I
- —
- Monthly cashflow
- —
- DSCR
- —
- Eligible?
- —
Short-term bridge; refi at stabilization.
Rent comps 40 comps
| Address | Beds | Baths | Sqft | Rent | $/sqft | DOM | Units | Dist |
|---|---|---|---|---|---|---|---|---|
| 420 Sunshine St Jacksonville, FL | 3.0 | 2.0 | 1050 | $1,350 | $1.29 | 2d | 1 | 0.27mi |
| 2980 Ernest St Jacksonville, FL | 2.0 | 1.0 | 920 | $1,200 | $1.30 | 24d | 1 | 0.31mi |
| 3118 Dignan St Jacksonville, FL | 4.0 | 2.0 | 1103 | $1,148 | $1.04 | 2d | 1 | 0.33mi |
| 3035 Fitzgerald St Jacksonville, FL | 2.0 | 1.0 | 900 | $1,021 | $1.13 | 4d | 1 | 0.33mi |
| 3159 Phyllis St Jacksonville, FL | 3.0 | 2.0 | 1209 | $1,561 | $1.29 | 4d | 1 | 0.35mi |
| 809 McDuff Ave S Jacksonville, FL | 2.0 | 1.0 | 1006 | $995 | $0.99 | 5d | 1 | 0.38mi |
| 2812 Ernest St Jacksonville, FL | 3.0 | 1.0 | 1461 | $2,800 | $1.92 | 24d | 1 | 0.39mi |
| 3236 Phyllis St Unit 3244 Jacksonville, FL | 2.0 | 1.0 | 720 | $850 | $1.18 | 24d | 1 | 0.44mi |
| 3250 Phyllis St Jacksonville, FL | 2.0 | 1.0 | 720 | $850 | $1.18 | 24d | 1 | 0.46mi |
| 3036 Green St Jacksonville, FL | 3.0 | 1.0 | 924 | $1,495 | $1.62 | 24d | 1 | 0.49mi |
| 2759 Dellwood Ave Jacksonville, FL | 3.0 | 2.0 | 1080 | $2,100 | $1.94 | 20d | 1 | 0.50mi |
| 3319 Hunt St Jacksonville, FL | 3.0 | 1.0 | 924 | $1,295 | $1.40 | 24d | 1 | 0.52mi |
| 717 King St Jacksonville, FL | 3.0 | 2.0 | 1132 | $1,800 | $1.59 | 18d | 1 | 0.52mi |
| 3233 Dellwood Ave Jacksonville, FL | 2.0 | 2.0 | 1000 | $1,750 | $1.75 | 24d | 1 | 0.52mi |
| 3318 Dignan St Jacksonville, FL | 3.0 | 2.0 | 960 | $1,200 | $1.25 | 24d | 1 | 0.54mi |
| 3323 Nolan St Jacksonville, FL | 3.0 | 1.0 | 927 | $1,050 | $1.13 | 2d | 1 | 0.54mi |
| 371 Smith St Jacksonville, FL | 3.0 | 2.0 | 1050 | $1,325 | $1.26 | 5d | 1 | 0.54mi |
| 715 Ralph St Jacksonville, FL | 4.0 | 2.0 | 1338 | $2,195 | $1.64 | 5d | 1 | 0.55mi |
| 3347 Phyllis St Jacksonville, FL | 3.0 | 2.0 | 1145 | $1,395 | $1.22 | 24d | 1 | 0.57mi |
| 3356 Lenox Ave Jacksonville, FL | 2.0 | 1.0 | 899 | $999 | $1.11 | 24d | 1 | 0.58mi |
| 3312 Ernest St Jacksonville, FL | 3.0 | 1.0 | 1065 | $1,148 | $1.08 | 24d | 1 | 0.58mi |
| 3352 Dillon St Jacksonville, FL | 3.0 | 2.0 | 1229 | $1,372 | $1.12 | 24d | 1 | 0.61mi |
| 2803 College St Jacksonville, FL | 2.0 | 1.0 | 1100 | $1,550 | $1.41 | 15d | 1 | 0.62mi |
| 2701 Myra St Jacksonville, FL | 3.0 | 1.0 | 1065 | $1,595 | $1.50 | 22d | 1 | 0.63mi |
| 3515 Dignan St Jacksonville, FL | 3.0 | 1.0 | 915 | $1,036 | $1.13 | 4d | 1 | 0.65mi |
| 3313 Green St Jacksonville, FL | 3.0 | 1.0 | 1058 | $1,450 | $1.37 | 8d | 1 | 0.66mi |
| 3353 Dellwood Ave Jacksonville, FL | 3.0 | 1.0 | 934 | $1,595 | $1.71 | 18d | 1 | 0.66mi |
| 3550 Edison Ave Jacksonville, FL | 3.0 | 2.0 | 1230 | $1,463 | $1.19 | 5d | 1 | 0.66mi |
| 2777 Post St Jacksonville, FL | 2.0 | 1.0 | 1200 | $1,195 | $1.00 | 24d | 1 | 0.70mi |
| 2561 Rosselle St #1 Jacksonville, FL | 3.0 | 3.0 | 1287 | $1,395 | $1.08 | 24d | 1 | 0.71mi |
| 3233 Post St Jacksonville, FL | 2.0 | 1.0 | 750 | $1,095 | $1.46 | 24d | 1 | 0.71mi |
| 676 Bridal Ave Jacksonville, FL | 3.0 | 2.0 | 1008 | $1,450 | $1.44 | 24d | 1 | 0.73mi |
| 3302 College St Jacksonville, FL | 3.0 | 1.0 | 1174 | $1,095 | $0.93 | 8d | 1 | 0.73mi |
| 2526 Phyllis St Jacksonville, FL | 3.0 | 2.0 | 1300 | $1,800 | $1.38 | 24d | 1 | 0.74mi |
| 1060 Cherry St Jacksonville, FL | 2.0 | 1.0 | 1356 | $1,623 | $1.20 | 22d | 1 | 0.74mi |
| 2614 Dellwood Ave Jacksonville, FL | 3.0 | 1.0 | 1122 | $2,325 | $2.07 | 5d | 1 | 0.76mi |
| 2410 McQuade St Jacksonville, FL | 3.0 | 2.0 | 1307 | $1,425 | $1.09 | 24d | 1 | 0.77mi |
| 2611 Green St Jacksonville, FL | 2.0 | 1.0 | 728 | $1,195 | $1.64 | 24d | 1 | 0.79mi |
| 2611 Green St Jacksonville, FL | 2.0 | 1.0 | 728 | $1,195 | $1.64 | 15d | 1 | 0.79mi |
| 3352 College St Jacksonville, FL | 3.0 | 2.0 | 1335 | $1,550 | $1.16 | 15d | 1 | 0.79mi |
Listing history 3 events
-
2026-06-05status $50,000 Pending 1 DOM
-
2026-06-02remarks 699-char remark
-
2026-06-02$50,000 Active 1 DOM
ⓘ Source: listings_history table (triggers on properties + properties_extension) + one-shot
backfill from property_details.listing_events for pre-trigger history.
Tax reassessment forecast FL · Resets to sale price
- Current annual tax
- $1,318 · $110/mo
- Projected year-2 tax
- $1,318 · $110/mo
- Expected delta
- $0/yr ($0/mo · 0.0%)
ⓘ Screening estimate from a state-policy table — verify with the county assessor before closing.
Climate risk First Street
- Flood 1/10 Low FEMA zone X (unshaded) · 0% chance over 30 yrs
- Wildfire 1/10 Low
- Heat 9/10 Extreme 7 d/yr ≥107°F today · 21 d/yr by 30 yrs out
- Wind 9/10 Extreme 99% chance of damaging wind over 30 yrs
- Air quality 5/10 Major 7 unhealthy d/yr today · 7 by 30 yrs out
Nearby sold comps map
Loading sold comps map…
Walkable amenities ~0.75 mi
Loading nearby amenities…
Taxation est. · year 1
- Rental income
- $17,718
- − Mortgage interest
- −$2,801
- − Property taxes
- −$1,318
- − Insurance
- −$250
- − Repairs & maintenance
- −$1,417
- − Management
- −$1,417
- − Depreciation
- −$1,455
- Taxable income
- $9,061
- Est. tax owed @ 24.0%
- −$2,175
- After-tax cash flow
- $7,109/yr
For passive investors: Depreciation is non-cash, so a rental often shows a tax loss while cash-flowing — sheltering income. Rental losses are passive: they offset passive income freely, and up to $25,000/yr can offset ordinary (W-2) income if you actively participate and your MAGI is under $100k (phasing out to $0 by $150k); unused losses carry forward. On sale, claimed depreciation is recaptured at up to 25%, and gains may owe capital-gains tax (a 1031 exchange can defer both). Figures are a year-1 estimate at your 24.0% rate — not tax advice; consult a CPA.
Schools (NCES district)
- District
- Duval
- NCES district ID
- 1200480
- Math proficiency
- 46% ▼ -11.00%
- Reading proficiency
- 45% ▼ -4.00%
- Median HH income
- $48,987
- Composite
- 38.97/100
- National rank
- #4076
- State rank
- #48 of 73 in FL
Livability — Jacksonville
- Score
- 83/100
- State rank
- #50
- US rank
- #911
Category grades
Schools grade is shown separately in the Schools card above.
Census & demographics
- Census place
- Jacksonville, FL
- County
- Duval County · 1,015,274 people
- City population
- 979,034
- Metro
- Jacksonville, FL
- Population (ZIP)
- 13,927
- Household income
- $34,953
- Rent vs Own
- Severe rent burden
- 882.0
Population outlook (Duval County) Hauer SSP2
- Today (2025)
- 1,013,010 people
- By 2030
- 1,059,228 · +4.6%
- By 2040
- 1,141,439 · +12.7%
- By 2050
- 1,205,258 · +19.0%
- By 2075
- 1,324,282 · +30.7%
- By 2100
- 1,319,620 · +30.3%
Race, ethnicity, and origin ACS 2023
- Neighborhood character
- Diverse neighborhood (Simpson 0.56)
- Race & ethnicity
- Black 60% White 28% Two or more races 7% Hispanic / Latino 5%
- Hispanic origin (detail)
- Puerto Rican 1%
- Common ancestry
- Slovak 1% Hispanic 1% Lithuanian 1%
- Foreign-born
- 4% · Canada
- Languages at home
- 94% English-only · Spanish 4% French/Haitian/Cajun 2%
Political lean MEDSL · Duval
- 2024 margin
- Toss-up / Even · D 48.7% · R 50.1% · Other 1.2%
- 2008→2024 swing
- +0.4pp no change · 2008: -1.9pp · 2024: -1.5pp
- All cycles
- 2024: R+1.5 2020: D+3.8 2016: R+1.5 2012: R+3.6 2008: R+1.9
Not yet ingested
- Civics
- —
Market trends
- HPI YoY
- ▲ 3.41%
- Current HPI
- 282.2981
- Rent YoY
- ▲ 1.70%
- Metro
- Jacksonville, FL
- State GDP YoY
- ▲ 3.28%
- F500 in state
- 36
Industry mix (Fortune 500 HQ in FL)
| Industry | F500 HQs | Revenue |
|---|---|---|
| Industrial Technology | 2 | $29B |
|
||
| Insurance | 2 | $17B |
|
||
| Retail | 1 | $60B |
|
||
| Technology Distribution | 1 | $58B |
|
||
| Homebuilding | 1 | $35B |
|
||
| Technology Manufacturing | 1 | $35B |
|
||
Price history
1 event — show timeline
- 2026-06-02 Listed $50,000 realMLS
Property tax history
+6.0%/yrLatest (2025): $1,318 · +22.5% YoY. Source: county tax records.
Cash-flow waterfall
monthlySold comps — $/sqft
last 12 mo · ≤1 miLoading sold comps…